transformation, modeling algorithm, data analysis mod- ule, plot, etc.). ... ISL also provides a macro language, Clem, f
An Evaluation of High-end Data Mining Tools for Fraud Detection Dean W. Abbott Elder Research San Diego, CA 92122
[email protected]
I. Philip Matkovsky Federal Data Corporation Bethesda, MD 20814
[email protected]
ABSTRACT1 Data mining tools are used widely to solve real-world problems in engineering, science, and business. As the number of data mining software vendors increases, however, it has become more challenging to assess which of their rapidly-updated tools are most effective for a given application. Such judgement is particularly useful for the high-end products due to the investment (money and time) required to become proficient in their use. Reviews by objective testers are very useful in the selection process, but most published to date have provided somewhat limited critiques, and haven’t uncovered the critical benefits and shortcomings which can probably only be discovered after using the tool for an extended period of time on real data. Here, five of the most highly acclaimed data mining tools are so compared on a fraud detection application, with descriptions of their distinctive strengths and weaknesses, and lessons learned by the authors during the process of evaluating the products. 1. INTRODUCTION The data mining tool market has become more crowded in recent years, with more than 50 commercial data mining tools, for example, listed at the KDNuggets web site (http://www.kdnuggets.com). Rapid introduction of new and upgraded tools is an exciting development, but does create difficulties for potential purchasers trying to assess the capabilities of off-the-shelf tools. Dominant vendors have yet to emerge (though consolidation is widely forecast). According to DataQuest, in 1997, IBM was the data mining software market leader with a 15% share of license revenue, Information Discovery was second with 10%, Unica was third with 9%, and Silicon Graphics was fourth with 6% [1]. Several useful comparative reviews have recently appeared including those in the popular press (e.g., DataMation[2]) and two detailed reports sold by consultants: the Aberdeen Group [3] and Two Crows [4]. Yet most reviews do not (and perhaps cannot) address many of the specific application considerations critical to many companies. And, few show evidence of extensive practical experience with the tools. 1
This research was supported by the Defense Finance Accounting Service Contract N00244-96-D-8055 under the direction of Lt. Cdr. Todd Friedlander, in a project initiated by Col. E. Hutchison.
John F. Elder IV, Ph.D. Elder Research Charlottesville, VA 22901
[email protected]
This paper summarizes a recent extensive evaluation of high-end data mining tools for fraud detection. Section 2 outlines the tool selection process, which began with dozens of tools, and ended with five examined in depth. Multiple categories of evaluation are outlined; including the tool’s suitability to the intended users and computer environment, automation capabilities, types and quality of algorithms implemented, and ease of use. Lastly, each tool was extensively exercised on real data to assess its accuracy and its strengths “in the loop”. 2. TOOL SELECTION 2.1 Computer System Environment System requirements, including supported computer platforms, relational databases, and network topologies, are often particular to a company or project. For this evaluation, a client-server environment was desirable, due to the large data sets that were to be analyzed. The environment was comprised of a multi-processor Sun server running Solaris 2.x, and client PCs running Windows NT. All computers ran on an Ethernet network using TCP/IP. Data typically resided in an Oracle database, though smaller tables could be exported to ASCII format and copied to the server or client. 2.2 Intended End-User The analysts that will use the data mining tools evaluated were specified as non-experts; that is, they would have knowledge of data mining, but not be statisticians or experts at understanding the underlying mathematics used in the algorithms. They are, however, domain experts. Therefore, the data mining tools had to use language a novice would understand, and provide guidance for the non-expert. 2.3 Selection Process Thorough tool evaluation is time-intensive, so a twostage selection phase preceded in-depth evaluation. For the first stage, more than 40 data mining tools/vendors were rated on six qualities: • product track record • vendor viability • breadth of data mining algorithms in the tool • compatibility with a specific computer environment • ease of use • the ability to handle large data sets
Several expert evaluators were asked to rate the apparent strength of each tool in each category as judged from marketing material, reviews, and experience. The scores within each category were averaged, and the category scores were weighted and summed to create a single score for each product. The top 10 tools continued to the second stage of the selection phase. The 10 remaining tools were further rated on several additional characteristics: experience in the fraud domain, quality of technical support, and ability to export models to other environments as source code or ASCII text. When possible, tools were demonstrated by expert users (usually, vendor representatives), who answered detailed algorithmic and implementation questions.2 The expert evaluators re-rated each tool characteristic, and the top five tools were selected for extensive hands-on evaluation. They are listed, in alphabetical order of product, in Table 1.3
Data mining applications often use data sets far too large to be retained in physical RAM, slowing down processing considerably as data is loaded to and from virtual memory. Also, algorithms run far slower when dozens or hundreds of candidate inputs are considered in models. Therefore, the client-server-processing model has great appeal: use a single high-powered workstation for processing, but let multiple analysts access the tools from PCs on their desks. Still, one’s network bandwidth capability has a dramatic influence on which of these tools will operate well. Table 2 describes the characteristics of each tool as they relate to this project (other platforms supported by the data mining tool vendors are not listed). Note that some tools did not meet every system specification. For example, Intelligent Miner at the time of this evaluation did not support Solaris (server)4. Clementine had no Windows NT client, and PRW had no relational database connectivity, and wasn’t client-server.
Table 1: Data Mining Products Evaluated Company
Product
Table 2: Software and Hardware Supported
Version 4.0
Product
Server
Client
Clementine
Solaris 2.X Solaris 2.X Solaris 2.X1
X Windows Windows NT Windows NT
IBM AIX Data only
Windows NT Windows NT
Integral Solutions, Ltd. (ISL) [5]
Clementine
Thinking Machines (TMC) [6]
Darwin
3.0.1
Darwin
SAS Institute [7]
Enterprise Miner (EM)
Beta
Enterprise Miner
IBM [8]
Intelligent Miner for Data (IM)
2.0
Unica Technologies, Inc. [9]
Pattern Recognition Workbench (PRW)
2.5
Intelligent Miner PRW
Oracle Connect Server side ODBC Server side ODBC SAS Connect for Oracle IBM Data Joiner Client side ODBC
1 Most testing performed on a standalone Windows NT version.
3. PRODUCT EVALUATION All five tools evaluated are top-notch products that can be used effectively for discovering patterns in data. They are well known in the data mining community, and have proven themselves in the marketplace. This paper helps distinguish the tools from each other, and outlines their strengths and weaknesses in the context of a fraud application. The properties evaluated included the areas of client-server compliance, automation capabilities, breadth of algorithms implemented, ease of use, and overall accuracy on fraud-detection test data. 3.1 Client-Server Processing A primary difference between high-end and less expensive data mining products is scalability to large data sets. 2
One vendor withdrew at the second stage to avoid such scrutiny. One product that originally reached the final stage was found, on installation, to have stability flaws undetected in earlier stages. 3
The products implement client/server in a wide variety of ways. Darwin best implements the paradigm as the client requiring the least processing and network traffic. We were able to use Darwin from a client accessing a server over 28.8 Kbaud modems without appreciable speed loss because the client interface passed only command line arguments to the server (and the data sets used for most of this stage were relatively small). Clementine was tested as a standalone Unix application and without a native Windows NT client. However, we used X-terminal emulation software on the PC to display the windows (Microimage’s X Server). Because the entire window has to be transmitted over the network, the network and processor requirements were much higher than for the other tools. Performance on modem lines was unacceptably slow. 4
A Solaris version of Intelligent Miner for Data is due out in 3rd quarter 1998.
PRW was tested as a standalone application for Windows NT. Data is accessed via a file server or database on the network, but all processing takes place on the analyst's computer. Therefore, processor capabilities on the client (which is also the server) must be significantly better than is required for the others. Intelligent Miner for Data ran a Java client, allowing it to run on nearly any operating system. Java runs more slowly than other GUI designs, but this wasn't an appreciable problem in our testing. Enterprise Miner was tested primarily on Windows NT as a standalone tool because the Solaris version was released during the evaluation period. It has the largest disk footprint of any of the tools, at 300+MB. Note: for brevity, the products will be referred to henceforth primarily by the names of the vendor: IBM (Intelligent Miner for Data), ISL (Clementine), SAS (Enterprise Miner), TMC (Darwin), and Unica (PRW). 3.2 Automation and Project Documentation The data mining process is iterative, with model building and testing repeated dozens of times [10]. The experimentation process involves repeatedly adjusting algorithm parameters, candidate inputs, and sample sets of the training data. It would be a great help to automate what can be in this process in order to free the analyst from some of the mundane and error-prone tasks of linking and documenting exploratory research findings. Here, documentation was judged successful if the analyst could reproduce results from the notes, cues, and saved files made available by the data-mining tool. All five products provided means to document findings during the research process, including time and date stamps on models, text fields to hold notes about the particular model, and the saving of guiding parameters. The visual-programming interface of ISL and SAS uses an icon for each data mining operation (file input, data transformation, modeling algorithm, data analysis module, plot, etc.). ISL’s version is particularly impressive and easy to use, which makes understanding and documenting the steps taken during model creation very clear. ISL also provides a macro language, Clem, for advanced data manipulation, and an automated way to find Neural Network architecture (number of hidden layers and number of nodes in a hidden layer). TMC is run manually by the analyst via pull-down menus. At each step in an experiment, the options selected are recorded and retained (along with free-text notes the analyst thinks to include) providing a record of guidance parameters, along with a date and time stamp.
Unica employs an “experiment manager” to control and automate model building and testing. There, multiple algorithms can be scheduled to run in batch on the same data. In addition, the analyst can specify a search over algorithm parameters or data fields used in modeling. Unica allows free-text notes, and can encode models as internal functions with which to test on new data. IBM uses a “wizard” to specify each model. The Neural Network wizard (by default) automatically establishes the architecture, or the user can specify it manually. 3.3 Algorithms Data mining tools containing multiple algorithms usually include Neural Networks, Decision Trees and perhaps one other, such as Regression or Nearest Neighbor. Table 3 lists the algorithms implemented in the five tools evaluated. (Comments below focus on the distinctive features of each, but not all their capabilities.) Table 3: Algorithms Implemented Algorithm
IBM
ISL
SAS
Decision Trees
3
3
3
3
Neural Networks
3
3
3
3
1
3
3
Regression Radial Basis Functions
TMC Unica
3 3 3
32
3
Nearest Neighbor
3
3 3
Nearest Mean Kohonen SelfOrganizing Maps
3
Clustering
3
3
Association Rules
3
3
3 3
1 accessed in data analysis only 2 estimation only (not for classification)
Three of the tools included logistic (and linear) Regression, which is an excellent baseline from which to compare the more complex non-linear methods. Unica has implemented the most diverse sets of algorithms (though they do not have the single most popular — Decision Trees), and includes an extensive set of options for each. Importantly, one can search over a range of parameters and candidate inputs automatically.
SAS has the next most diverse set, and provides extensive controls over algorithm parameters. ISL implements many algorithms and has a good set of controls. TMC offers three algorithms with good controls, but does not yet have unsupervised learning (clustering). IBM has only two “mainstream” classification algorithms (though Radial Basis Functions are available for estimation), and their controls are minimal. However, IBM also includes a Sequential Pattern (time series) discovery tool. 3.3.1 Decision Tree Options Table 4 compares the options available for the Decision Tree algorithms. “Advanced pruning” refers to use of cross-validation or a complexity penalty to prune trees.
Table 5: Options for Neural Networks Algorithm Automatic Architecture Selection
IBM
ISL
3
3
Advanced Learning Algorithms
3
SAS
TMC
Unica 3
3
3
3 3
Assign Priors to Classes Costs for Misclassification Cross-Validation Stopping Rule
3
3
3
3
Table 4: Options for Decision Trees Algorithm Handles Real-Valued Data
IBM
ISL
SAS
TMC
3
3
3
3
3
3
3
3
3
Costs for Misclassification Assign Priors to Classes Costs for Fields
3
Table 6: Ease of Use Comparison 3
Multiple Splits
Category
IBM
ISL
SAS
Data Load and Manipulation
3.1
3.7
3.7
3.1
3.9
Model Building
3.1
4.6
3.9
3.2
4.8
Model Understanding
3.2
4.2
2.6
3.8
3.8
Technical Support
3.0
4.0
2.8
3.2
4.7
Overall Usability
3.1
4.1
3.1
3.4
4.2
3
Advanced Pruning Options Graphical Display of Trees
3.4 Ease of Use The four categories by which ease-of-use was evaluated are listed in Table 6. Each category score is the average of multiple specific sub-categories scored independently by five to six users, essentially evenly split between data mining experts and novices. The overall usability score is a weighted average of these four components, with model understanding weighted twice that of the others because of its importance for this application.
3
3
TMC Unica
3
All of the tools that implement trees allow one to prune the trees manually after training, if desired. TMC, in fact, does not select a best tree, but has the analyst identify the portion of the full tree to be implemented. TMC also does not provide a graphical view of the tree. IBM provides only limited options for tree generation. Unica does not offer Decision Trees at all. 3.3.1 Neural Network Options ISL and Unica provide a clear and simple way to search over multiple Neural Network architectures to find the best model. That capability is also in IBM. Surprisingly, none adjust for differing costs among classes, and only Unica allows different prior probabilities to be taken into account. All but IBM have advanced learning options and employ cross-validation to govern when to stop. Table 5 summarizes these properties.
3.4.1 Loading Data ISL, Unica, and IBM allow ASCII data to reside anywhere. For TMC, it must be within a project directory on the Unix server. SAS must first load data into a SAS table and store it in a SAS library directory. ISL, Unica and SAS automatically read in field labels from the first line of a data file and determine the data type for each column. Unica and TMC can save data types (if changes have been made from the default) to a file for reuse. For TMC and IBM, the user must specify each field in the dataset manually either in a file (TMC) or dialog (IBM).
3.4.2 Transforming Data All five tools provide means to transform data, including row operations (randomizing, splitting into training and testing sets, sub-sampling) and column operations (merging fields, creating new fields). TMC has built-in functions for many such operations. ISL and Unica use custom macro languages for field operations, though ISL has several built-in column operations as well. SAS has extensive “data cleaning” options, including a graphical outlier filter. 3.4.3 Specifying Models ISL and SAS specify models by editing a node in the icon stream. TMC and IBM employ dialog boxes and Unica uses the experiment manager. The last is more flexible, but takes a bit longer to learn. 3.4.4 Reviewing Trees IBM and SAS have graphical tree browsers, and IBM’s is particularly informative. Each tree node is represented by a pie chart containing class distributions for the parent node and the current split, showing clearly the improved purity from the split. The numerical results are displayed as well, and trees can be pruned by clicking on nodes to collapse sub-trees. SAS uses a color to indicate the purity of nodes, with text inside each node. ISL and TMC represent trees as text-based rules. ISL can collapse trees via clicking. TMC allows one to select subtrees for rule display.
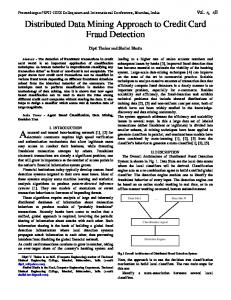
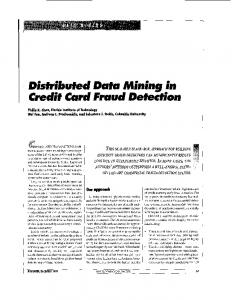
Half of the transaction data was used to create models, and half reserved for an independent test of model performance (evaluation data). To avoid compromising the independence of the evaluation data set, it was not used to gain insight into model structures, help determine when to stop training Neural Networks or Decision Trees, or validate the models. Approximately 20 models were created for each tool, including at least one from most of the algorithms available. Results are shown here only for Neural Networks and Decision Trees because they allowed the best crosscomparison, and because they proved to be better than the other models, in general. The best accuracy results obtained on the evaluation dataset are shown below. Figure 1 displays a count of false alarms obtained by each tool using Neural Networks and Decision Trees. (PRW, as noted, cannot yet build trees). Figure 2 displays a count of the fraudulent transactions identified. (While smaller is better for Figure 1, larger is better for Figure 2.)
25 Number False Alarms
3.4.5 Reviewing Classification Results ISL, Unica, and IBM automatically generate “confusion matrices” (a cross-table of true vs. predicted classes). TMC though, first requires one to merge together the prediction and target (true) vectors. SAS is currently the least capable in this area, as one must vectors to another program to view such a table.
result. Yet, interviewing fraud domain experts provided only general guidelines, and not a rule for making such a tradeoff. Therefore, the ability of each algorithm to adjust to variable misclassification costs is important. Instead of building a single model for each tool, multiple models were generated; the resulting range defined a curve trading off the number of fraud transactions caught versus false alarms.
20
Neural Networks Decision Trees
15 10 5
3.4.6 Support All five tools had excellent on-line help. Three also provided printed documentation (TMC and SAS did not). All also supplied phone technical support, with Unica and ISL delivering the most timely and comprehensive technical help to problems.
Figure 1: Accuracy Comparison: False Alarms (smaller is better)
3.5 Accuracy The data used to grade the accuracy of the tools contained fraudulent and non-fraudulent financial transactions. The goal given the data mining algorithms was to find as many fraudulent transactions as possible without incurring too many false alarms (transactions determined to be fraudulent by the data mining tools, but in fact not). Ascertaining the optimum tradeoff between these two quantities is essential if a single grade is to
Note that Decision Trees were better than Neural Networks at reducing false alarms. This is probably primarily due to two factors. First, most of the trees allowed one to specify misclassification costs, so nonfraudulent transactions could be explicitly given a higher cost in the data, reducing their number missed. Secondly, pruning options for the trees were somewhat better developed than the stopping rules for the networks, so the hazard of overfit was less. (Note that, in other
0 Darwin
Clementine
PRW
Enterprise Miner
Intelligent Miner
Data Mining Tool
applications, we have often found the exact opposite in performance. Accuracy evaluations – to be done right, must use data very close to the end application.)
100 Number Fraudulent Transactions Caught
Neural Networks
80
Decision Trees
4.4 Be Alert for Product Upgrades The data mining tool industry is changing rapidly. Even during our evaluation, three vendors introduced versions that run under Solaris 2.x (SAS’s Enterprise Miner, IBM’s Intelligent Miner, and Unica’s Model 1). While new data mining algorithms are rare, advances in their support environments are rapid. Practitioners have much to look forward to.
60 40 20 0 Darwin
Clementine
PRW
Enterprise Miner
Intelligent Miner
Data Mining Tool
Figure 2: Accuracy Comparison: Fraudulent Transactions Caught (larger is better) 4. LESSONS LEARNED The expense of purchasing and learning to use high-end tools compels one to first clearly define their intended environment; the amount and type of data to be analyzed, the level of expertise of the analysts, and the computing system on which the tools will run. 4.1 Define Implementation Requirements • User experience level: Will novices be creating models or only using results? How much technical support will be needed? • Computer environment: Specify hardware platform, operating system, databases, server/client, etc. • Nature of data: Size, location of users (bandwidth needed). Is there a target variable? (Is learning supervised or unsupervised?) • Manner of deployment: Can the models be run from within the tool? Will they be deployed in a database (SQL commands) or a simulation (source code)? 4.2 Test in Your Environment using Your Data Surprises abound. Lab-only testing might miss critical positive and negative features. (Indeed, we learned more than we anticipated at each stage of scrutiny.) 4.3 Obtain Training Data mining tools have improved significantly in usability, but most include functionality difficult for a novice user to use effectively. For example, several tools have a macro language with which one can manipulate data more effectively, or automate processing (e.g., Clementine, PRW, Darwin, and Enterprise Miner). If significant time will be spent with the tool, or if a fast turnaround is necessary, training should reduce errors, and make the modeling process more efficient.
5. CONCLUSIONS The five products evaluated here all display excellent properties, but each may be best suited for a different environment. IBM’s Intelligent Miner for Data has the advantage of being the current market leader, with a strong vendor offering well-regarded consulting support. ISL’s Clementine excels in support provided and in ease of use (given Unix familiarity) and might allow the most modeling iterations in a tight deadline. SAS’s Enterprise Miner would especially enhance a statistical environment where users are familiar with SAS and could exploit its macros. Thinking Machine’s Darwin is best when network bandwidth is at a premium (say, on very large databases). And Unica’s Pattern Recognition Workbench is a strong choice when it’s not obvious what algorithm will be most appropriate, or when analysts are more familiar with spreadsheets than Unix. 6. REFERENCES [1] Data Mining News, Volume 1, No. 18, May 11, 1998. [2] http://www.datamation.com/PlugIn/workbench/ datamine/stories/unearths.htm [3] Hill, D. and Moran R., Enterprise Data Mining Buying Guide: 1997 Edition, Aberdeen Group, Inc., http://www.aberdeen.com/. [4] Data Mining '98, http://www.twocrows.com/ [5] Integral Solutions, Ltd., http://www.isl.co.uk/clem.html. [6] Thinking Machines Corp., http://www.think.com/html/products/products.htm. [7] SAS Institute, http://www.sas.com/software/components/miner.html. [8] IBM, http://www.software.ibm.com/data/iminer/. [9] Unica Technologies, Inc., http://www.unicausa.com/prodinfo.htm. [10] Fayyad, U., Piatetsky-Shapiro, G. and Smyth, P. "From Data Mining to Knowledge Discovery: An Overview." In Advances in Knowledge Discovery and Data Mining. Fayyad et al (Eds.) MIT Press, 1996.