Evaluation of Fourteen Desktop Data Mining Tools Michel A. King Department of Systems Engineering University of Virginia Charlottesville, VA, USA
[email protected]
John F. Elder IV, Ph.D. Elder Research Charlottesville, VA, USA
[email protected]
Brian Gomolka, Eric Schmidt, Marguerite Summers, and Kevin Toop Department of Systems Engineering University of Virginia Charlottesville, VA, USA ABSTRACT Fourteen desktop data mining tools (or tool modules) ranging in price from US$75 to $25,000 (median < $1,000) were evaluated by four undergraduates inexperienced at data mining, a relatively experienced graduate student, and a professional data mining consultant. The tools ran under the Microsoft Windows95, Microsoft WindowsNT, or Macintosh System 7.5 operating systems, and employed Decision Trees, Rule Induction, Neural Networks, or Polynomial Networks to solve two binary classification problems, a multi-class classification problem, and a noiseless estimation problem. Twenty evaluation criteria and a standardized procedure for assessing tool qualities were developed and applied. The traits were collected in five categories: Capability, Learnability/Usability, Interoperability, Flexibility, and Accuracy. Performance in each of these categories was rated on a six-point ordinal scale, to summarize their relative strengths and weaknesses. This paper summarizes a lengthy technical report [1], which details the evaluation procedure and the scoring of all component criteria. This information should be useful to analysts selecting data mining tools to employ, as well as to developers aiming to produce better data mining products. 1.
INTRODUCTION
There are many desktop data mining tools currently available, spanning a wide price range, using a variety of technologies to solve classification and estimation problems. Very few direct comparisons of their features and performances have been published. This research was undertaken to help fill that gap. We sought to examine qualities both “hard” (accuracy) and “soft” (e.g., usability), and to assess relative performance both within and between algorithm groups.
The 14 tools evaluated were those from leading vendors which were available to the research team and which use one of the four technologies: Decision Trees; Rule Induction; Neural Networks; or Polynomial Networks. The Decision Tree products were CART [2], Scenario [3], See5 [4], and the tree module of S-Plus [5]. The Rule Induction tools were WizWhy [6], DataMind [7], and DMSK [8]. Neural Networks were built from three programs with multiple algorithms: NeuroShell2 [9], PcOLPARS [10], and PRW [11]. The Polynomial Network tools were ModelQuest Expert [12], Gnosis [13], a module of NeuroShell2, and KnowledgeMiner [14]. Most of the software used in this research was provided by Elder Research, a data mining consulting firm with offices in Charlottesville, Virginia and San Diego, California, USA. The remainder was acquired through the University of Virginia. The chief evaluators were academically prepared but inexperienced data miners: fourth year (senior) undergraduate Systems Engineering students at the University of Virginia, earning baccalaureate degree credit for a Capstone (advanced special projects) course on data mining taught by a Ph.D. candidate. (Their domain inexperience however, did make the students ideal subjects for evaluating tool Learnability.) 2.
DATA
Four data sets were employed on which several prior analyses had been published, to allow calibration of the results. To test tool flexibility and capability, their output types varied: two binary classification (one with missing data), a multi-class set, and a noiseless estimation set. A random two-thirds of the cases in each served as training data; the remaining third were test data.
The classification data sets—consisting of the Pima Indians Diabetes Data [15], the Wisconsin Breast Cancer Data [16], and the Forensic Glass Identification Data [17] are “real world” data sets assumed to contain an unknown amount of noise. They were obtained from the University of California, Irvine Machine Learning Repository [18]. The Pima Indians Diabetes data set consists of 768 cases of Native American women from the Pima tribe—some of whom are diabetic, most of whom are not—who were living near Phoenix, Arizona. There are eight attributes plus the binary class variable for diabetes per instance. We discarded the variable missing the most values and the remaining cases missing values, leaving 532 cases. The Wisconsin Breast Cancer data set consists of 699 instances of breast tumors—some of which are malignant, most of which are benign—collected at the University of Wisconsin Hospitals, Madison, Wisconsin, USA. There are 10 attributes plus the binary malignancy variable per case. About a dozen cases had some missing values; most tools could handle them, but some required preprocessing to remove those cases (see Table 1, column 1). The Forensic Glass Identification data set consists of 214 instances of glass collected during crime investigations. The glass specimens can be classified as one of six types according to oxide content. There are 10 attributes plus the multi-class output variable per instance. The estimation data, called the Moon Cannon data set [19] contains 300 solutions to the equation: x = 2v2sin(γ)cos(γ)/g and is the distance, x, a cannonball would travel on the moon (with gravity, g), if fired from a cannon with muzzle velocity, v, and angle of elevation, γ. The data were generated without adding noise, to identify whether the basis functions employed in each algorithm were capable of exact fits when such exist. 3.
METHODOLOGY
The research team developed a list of 20 criteria, plus a standardized procedure, for evaluating data mining tools. These criteria can be put into five categories: Capability, Learnability/Usability, Interoperability, Flexibility, and Accuracy. Capability measures what a desktop tool can do, and how well it does it; Learnability/Usability, how easy a tool is to learn and use; Interoperability, a tool’s ability to interface with other computer applications; and
Flexibility, the ease with which one can alter critical guiding parameters, or create a customized environment. The Accuracy metric for the three classification problems was simply the proportion of cases correctly classified (ignoring possibly different costs for different types of errors). For estimation problems, it was R2, the coefficient of multiple determination. These metrics allow comparison with other published results; and, their similar scale simplifies their visual comparison. The last key tool property, Price, did not explicitly enter the evaluation (though it appears in Table 3). We list the commercial price, but significant academic and government discounts are available from most of the vendors. 4.
RESULTS
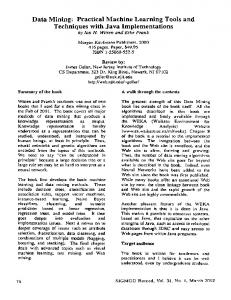
Table 1 summarizes the assessment of all evaluation criteria except Accuracy, grouped according to evaluation category and tool technology. Criterion averages by technology group and an overall average for each criterion are provided to make it easy to compare results across-the-board for all 14 tools, as well as within each technology group. The six-point scale employed is: ++ = excellent; + = good; √ = average; - = needs improvement; -- = poor; and “none” = none. Using equal weights for each category, and equal spacing between scale intervals (both assumptions which may be altered to reflect one’s particular situation), the best tools within each group were: S-plus for Decision Trees; DataMind for Rule Induction; PRW for Neural Networks; and ModelQuest Expert and NeuroShell2 for Polynomial Networks. Accuracy results on the test data are summarized for the four groups of tools in Figures 1 through 4, and detailed in Table 2 (Higher is better). The scores shown are for the final models selected after performing some iterations of the data mining process. Naïve models, run “right out of the box”, were also constructed, and their scores recorded. If one could improve upon the naive model during training, through experimenting with parameters, that factored into a tool’s Capability score. Similarly, tools with good defaults (where good naïve models were close to the final scores) got bonuses in Usability. Overall, the network methods (Polynomial and Neural) were more accurate than the partitioning methods (Trees and Rules).
Table 1: Capability, Learnability/Usability, Interoperability, and Flexibility
Allows data transformations
Quality of testing options
Has programming language
Provides useful output reports
Visualization
Tutorials
Wizards
Easy to Learn
User’s Manual
Online help
Interface
Importing data
Exporting data
Links to other applications
Model adjustment flexibility
Customizable work environment
Ability to write or change code
Overall (averaging groups)*
Flexibility
Considers misclassification costs
Interoperability
Handles missing data
Learnability/Usability
Data Mining Tool
Poly Net
Neural
Rule
Tree
Technology
Capability
CART Scenario See5 S-Plus Tree Average* WizWhy DataMind DMSK Rule Average* NeuroShell 2 PcOLPARS PRW Neural Avg.* MQ Expert NeuroShell 2 Gnosis K’Miner PolyNet Avg.* Overall Avg.*
+ + + + + + ++ -3 3 -3 + ++ 3 -3 3
+ -+ 3 + ------+ -3 --
+ 3 ++ + 3 ++ 3 -3 ++ 3 + + --3 3
+ -3 + 3 3 + 3 3 3 ++ 3 + 3 3 3 3
+ -3 ++ 3 ------3 + 3 3 -
+ 3 + ++ + + ++ + 3 3 3 3 + 3 3
+ + + + 3 ++ -3 ++ + + + 3 3 3
3 + 3 3 3 + ++ None 3 + 3 + + 3 3 3 3 3
None + None None -++ None 3 None 3 3 --
+ ++ + + + + -3 + 3 3 + 3 3 3
+ + NE + + 3 + -3 None 3 + 3 3 + None 3 3
+ + + + + 3 + 3 + + 3 3 3 3 3 3
+ ++ 3 3 + + ++ -3 3 3 ++ + + + 3 3
++ 3 ++ + + ++ + 3 -++ 3 3 3 3
+ + ++ + + 3 3 -3 ++ 3 3 3 --3 3
+ 3 ++ + 3 + 3 3 --++ 3 3 -3 3 3
+ -+ + 3 3 3 3 3 ++ ++ + + 3 3 3
3 3 -+ 3 3 3 -3 + 3 3 3
+ ++ 3 -------3 3 3 -3 -
3 3 3 + 3+ 3 3+ 3 + 33+ 3 33
Legend: ++ = Excellent; + = Good; 3 = Average; - = Needs Improvement; -- = Poor; None = Does not exist; NE = exists, but Not Evaluated. *Averages assume that the rating symbols represent an equal-interval ordinal scale.
1.0
.8
.8
Accuracy
Accuracy
1.0
.6
.4
CART Scenario See5 S-Plus
.2
.0 Diabetes
Cancer
Glass
.6 MQ Expert .4
NeuroShell2 Gnosis
.2
K'Miner .0 Diabetes
Distance
Cancer
Glass
Distance
Data Set
Data Set
Figure 1: Decision Tree Accuracy
Figure 4: Polynomial Network Accuracy
Distance
.76
.94
.66
.96
Scenario
.30
.70 *
NP
.93
See5
.73 *
.95
.76 *
.68*
DataMind
S-Plus
.79
.95
.67
.94
DMSK
WizWhy
.74
.96
EM
EM
DataMind
.69
.96
.66
.67
DMSK
.67 *
.94
.66 *
.98
NeuroShell2
.77
.96
.70 *
.96
PcOLPARS
.81
.97
.64 *
NP
PRW
.80
.96
.70
1.00
MQ Expert
.77
.94
.65
1.00
NeuroShell2
.78
.95
.63
1.00
Gnosis
.81
.95
.68 *
1.00
K’Miner
.78
.96
.61
.96
W izW h y
.0 Diabetes
Cancer
Glass
Distance
Tree
.4
.2
Data Set
Neural
Figure 2: Rule Induction Accuracy
Poly Net
1.0
.8
Accuracy
Glass
CART .6
Rule
Accuracy
.8
Cancer
Data Mining Tool
1.0
Diabetes
Table 2: Accuracy Results
.6
NeuroShell2
.4
PcOLPARS .2
* = Training results better by > .10 NP = Not Practical to compute EM = Error Message
PRW .0 Diabetes
Cancer
Glass
Distance
Data Set
Figure 3: Neural Network Accuracy
A striking characteristic of the Figures is their unexpected similarity. Although differences between algorithms are often overstated, they should be more pronounced than appear here (for example, see the experiments in [20]). Though we sought to employ a suite of test problems that
of data, as some evaluation cases would be duplicates of training cases.) See5 and DataMind scored poorest on the Distance (Moon Cannon) data set, but WizWhy and pcOLPARS were not even able to provide estimations, being limited solely to classification problems. Possible workarounds exist, but are time-consuming, and were not performed.
was neither too easy nor too hard to solve, it seems we did not succeed; the accuracy results are not as distinct as they probably could have been. Clearly, collecting a (small) test suite of problems with the requisite variety of goals, and level of difficulty (to separate algorithm performances) is still a worthwhile research goal. Still, some tools under-perform on certain types of problems. For instance, despite winning some of the “soft” categories among Decision Tree tools, Scenario did the worst on evaluation accuracy for two sets (Figure 1). (Scenario cannot actually read an external file for evaluation, but insists on randomly splitting a single file itself. Thus, its accuracy numbers are not exactly comparable to those of the other tools, where the same cases were evaluated for each. As it had a lower limit of 300 cases, no scores could be provided for the small third set, as duplicating cases to get over the limit would have artificially improved accuracy when combined with its self-splitting
Table 3 summarizes the information presented in Tables 1 and 2 by projecting results onto a seven-point rating scale (adding intermediate levels 3- and 3+ for precision), and by giving an overall score for each tool. (That score again assumes that: 1) each evaluation category (column of Table 3, except price) receives equal weight; 2) a category score is the average of its components; and 3) the intervals between the symbols in the component ratings are equal.) Then, S-plus and PRW score best. (Interestingly, both tools also possess further capabilities beyond what was tested here.)
3+ 3+ 3 3333 33+ 3 333 3-
+ -+ + 3+ 3 + 3 ++ 3 ++ + + + ++ + + 3+
3+ 3 3 + 3+ 3 3+ 3 33+ 33+ 3 333
Price (US$)
+ 3 ++ 3+ 3 + 33+ ++ 3 3 3 -3
Overall (equal weights)
Accuracy
3 + 333 3+ ++ -3 3 + 3 3 3 3 33
Flexibility
+ 33 + 3 3 3+ 3 33+ 3+ 3333
Learnability/ Usability
Capability
Tool CART Scenario See5 S-Plus Tree Average* WizWhy DataMind DMSK Rule Average* NeuroShell 2 PcOLPARS PRW Neural Average* MQ Expert NeuroShell 2 Gnosis KnowledgeMiner Poly Net Average* Overall Average*
Interoperability
Poly Net
Neural
Rule
Tree
Technology
Table 3: Data Mining Tool Evaluation Summary
995 695 440 1,795 Median = 845 4,000 25,000 75 Median = 4,000 395 495 10,000 Median = 495 5,950 495 4,900 100 Median = 2,698 Median = 845
++ = Excellent; + = Good; 3 = Average; - = Needs Improvement; -- = Poor; None = Does not exist; NE = Not Evaluated. *Averages assume that the symbols represent an equal interval ordinal rating scale.
5.
DISCUSSION
Clearly, data mining software can be designed to do well on both estimation and classification problems, as attested to by the performance of several of the tools across categories. It’s puzzling that some developers would restrict their tools to one or the other realm alone. The asterisked cells in Table 2 are all situations where the training score was at least 0.10 better than the evaluation score. Often, that signals overfit, where over-training leads to worse generalization (performance on new data). In other cases, “more” training (using options which led to better training results) also led to better evaluation results, even though the evaluation was still much worse than training. A welcome enhancement to future products would involve helping users to identify improperly fit models and, if possible, improve them. Evaluations of software applications are unavoidably subjective. Even using our scoring for the individual components, one could combine them with different emphases and arrive at different conclusions as to fitness to purpose. (Indeed, issues not considered here, such as computer environment, database connectivity, stability of vendor, etc., might also need to factor into a purchase decision.) To choose a tool using the information of this research, individual analysts could weight the category scores depending on, for example, their software budget, user experience, and the relative importance of likely incremental improvements in accuracy. Whatever the weights, some tools will not (in their current form) come out ahead; i.e., they are dominated. For the others, there exists some weighting of the categories in which the tool would be identified as the single best. The set of nondominated, or “Pareto-optimal” tools includes only Splus, PRW, and DataMind (the last only if Learnability/ Usability is paramount). In 100 random test weightings, S-plus won 59%, PRW 40%, and DataMind 1%. Two other tools are close contenders: ModelQuest Expert and CART. It takes a combination of two tools to linearly dominate either. An improvement in CART’s Interoperability, say, would move it into the top ranks. Or, a different summarization of the category components (besides averaging) could elevate either to the top group. Lastly, note that price is related to quality. Its correlation with the equal-weighted score is 0.45, and is 0.67 with log(price). If Affordability—defined to be 5 - log(price) to have a scale comparable to the other categories—is factored in, then DMSK, as the least expensive, appears
on the list, S-plus is further strengthened, and CART and Scenario join DataMind as winners under some situations (e.g., CART if Interoperability can be ignored but Affordability and Learnability/ Usability are essential). REFERENCES [1] Gomolka, B., Schmidt, S., Summers, M., and Toop, K., Data Mining Tool Evaluation: An Evaluation of Fourteen Tools Using Decision Trees, Rule Induction, Neural Networks, or Polynomial Networks, Capstone rpt., U. Virginia Dept. Systems Engineering, April 28, 1998. [2] Salford Systems. http://www.salford-systems.com. [3] Cognos Homepage. http://www.cognos.com. [4] RuleQuest Homepage. http://www.rulequest.com. [5] Mathsoft Homepage. http://www.mathsoft.com. [6] WizWhy for Windows® User’s Guide. WizSoft, 1996. [7] DataMind Corp. http//www.datamindcorp.com. [8] Weiss, S., and Indurkhya, N. Predictive Datamining A Practical Guide. Morgan Kaufamnn, 1998. http://www.data-miner.com. [9] NeuroShell 2 User’s Manual, 4th Edition. Ward Systems Group, Inc., Frederick, MD, June 1996. [10] PAR Homepage. http://
[email protected]. [11] Unica Homepage. http//www.unica.com. [12] ModelQuest Expert User’s Manual. Version 1.0 Beta. AbTech Corporation, Charlottesville, VA, 1996. [13] Gnosis User’s Manual. 1st Edition. Barron Associates, Inc., Charlottesville, VA, October 1996. [14] KnowledgeMiner Homepg. http//scriptsoftware.com [15] Smith, J. W., Everhart, J. E., Dickson, W. C., Knowler, W. C., and Johannes, R. S., “Using the ADAP learning algorithm to forecast the onset of diabetes mellitus”, Proc. Symposium on Computer Applications and Medical Care, 1988, pp. 261-265, IEEE CS Press. [16] Wolberg, W. H. and Mangasarian, O. L., “Multisurface method of pattern separation for medical diagnosis applied to breast cytology”, Proc. National Academy of Sciences, USA, Vol. 87, December 1990, pp. 9193-9196. [17] German, B. and Spiehler, V., Forensic Glass Identification Data Set, at the UC-Irvine ML Repository. [18 ] University of California, Irvine Machine Learning Repository, http://www.ics.uci.edu/~mlearn/ MLSummary.html, Nov. 1997. [19] Elder IV, J. F., and Brown, D. E., Induction and Polynomial Networks, IPC TR-92-009, Charlottesville, VA: Institute for Parallel Computation, 1992. [20] Elder, John F., IV (1996) Heuristic Search for Model Structure: the Benefits of Restraining Greed, Chapter 13 in Learning from Data: Artificial Intelligence and Statistics V, Lecture Notes in Statistics, Eds. D. Fisher and H.-J. Lenz, Springer-Verlag: New York.