Sep 12, 2015 - Dr. Ir. Han Ay Lie, M. Eng. Secondary Advisor .... Wen-Hsiang Hsieh for the effort and valuable support as the external examiners. My thanks are ..... distributed on a structure (Li et al., 2005; Szymczyk et al., 2007). Composite.
AN EXPERIMENTAL STUDY AND FINITE ELEMENT APPROACH TO THE BEHAVIOR OF GRADED CONCRETE
THESIS
As partial fulfillment for the degree of Master of Engineering at the Faculty of Engineering Diponegoro University
By :
M. MIRZA ABDILLAH PRATAMA 21010114420032
MASTER OF CIVIL ENGINEERING FACULTY OF ENGINEERING DIPONEGORO UNIVERSITY SEMARANG 2015 i
ENDORSEMENT
AN EXPERIMENTAL STUDY AND FINITE ELEMENT APPROACH TO THE BEHAVIOR OF GRADED CONCRETE
THESIS
By : M. MIRZA ABDILLAH PRATAMA 21010114420032
This Thesis has been approved for examination on September 12th, 2015
Primary Advisor
Secondary Advisor
Dr. Ir. Han Ay Lie, M. Eng.
Prof. Dr. Ir. Buntara Sthenly Gan
ii
ENDORSEMENT
AN EXPERIMENTAL STUDY AND FINITE ELEMENT APPROACH TO THE BEHAVIOR OF GRADED CONCRETE THESIS
By : M. MIRZA ABDILLAH PRATAMA 21010114420032 This Thesis has been corrected and improved in accordance with comments and suggestions from the Examiners, raised during the Final Examination on September 12th, 2015 at the Faculty of Engineering Diponegoro University. This Thesis has therefore been endorsed to proceed to the Final Edition. Examiners 1. Head
: Dr. Ir. Han Ay Lie, M. Eng.
………………………
2. Secretary : Prof. Dr. Ir. Buntara Sthenly Gan
………………………
3. Member 1 : Dr. techn. Ir. Sholihin As’ad, MT.
………………………
4. Member 2 : Dr. Ir. H. M. Jonkers
………………………
5. Member 3 : Prof. S. A. Kristiawan, ST., MSc., PhD.
………………………
6. Member 4 : Prof. Wen-Hsiang Hsieh
………………………
Semarang,
September 2015
DIPONEGORO UNIVERSITY Faculty of Engineering Master of Civil Engineering
Dr. Ir. Suharyanto, MSc. NIP. 19630914198803012 iii
DECLARATION OF SCIENTIFIC ORIGINALITY
The undersigned, M. Mirza Abdillah Pratama, hereby declares that the Thesis with the title: "An Experimental Study and Finite Element Approach to the Behavior of Graded Concrete" is an original work by the author, and has never been, and never will be submitted to obtain any other academic degree, elsewhere. This Thesis is entirely the product of my personal research, my laboratory work and thoughts. All information cited in this work has been noted and recognized by quotation of the author’s name, publication platform and publication dates. I therefore declare that this work is authentic, and that the outcome of which is solemnly my responsibility. Whenever similarities to other research work conducted by other authors are found, both in the title or the research product itself, throughout this entire paper, I hereby declare that I will take all accountability to the above mention acts. This statement is made with full recognizance and is true in all aspects.
Semarang, September 2015 The undersigned,
M. Mirza Abdillah Pratama 21010114420032
iv
HALAMAN PERNYATAAN PERSETUJUAN PUBLIKASI TUGAS AKHIR UNTUK KEPENTINGAN AKADEMIS Sebagai sivitas akademika Universitas Diponegoro, saya yang bertanda tangan di bawah ini : Nama NIM Jurusan/Program Studi Departemen Fakultas Jenis Karya
: : : : : :
M. Mirza Abdillah Pratama 21010114420032 Magister Teknik Sipil Teknik Sipil Teknik Tesis
demi pengembangan ilmu pengetahuan, menyetujui untuk memberikan kepada Universitas Diponegoro Hak Bebas Royalti Noneksklusif (None-exclusive Royalty Free Right) atas karya ilmiah saya yang berjudul : AN EXPERIMENTAL STUDY AND FINITE ELEMENT APPROACH TO THE BEHAVIOR OF GRADED CONCRETE beserta perangkat yang ada (jika diperlukan). Dengan Hak Bebas Royalti/Noneksklusif ini Universitas Diponegoro berhak menyimpan, mengalihmedia/formatkan, mengelola dalam bentuk pangkalan data (database), merawat dan memublikasikan tugas akhir saya selama tetap mencantumkan nama saya sebagai penulis/pencipta dan sebagai pemilik Hak Cipta. Demikian pernyataan ini saya buat dengan sebenarnya.
Dibuat di Pada Tanggal
: Semarang : September 2015
Yang menyatakan
( M. Mirza Abdillah Pratama )
v
ABSTRACT In structural analysis, a concrete element is assumed as homogeneous in terms of strength and physical properties throughout the entire section. Disintegration of materials caused by characteristics of concrete mixture and imperfection during casting, lead to an uneven material distribution, and creates non homogeneity as a function of section depth from the extreme bottom fibers of the section. The aim of this study is to model this graded phenomena through experimental testing and finite element modeling and analyzes. Two different concrete mixtures, having a concrete cylindrical compression strength of 20 MPa and 60 MPa, were casted and compacted by a newly developed casting method to create a smooth graded section without a distinctive transition zone. The mechanical behavior, i.e., the stress and strain responses and the concrete compression strength of the graded concrete was obtained through uniaxial compression testing of the cylindrical concrete specimens sized 100 x 200 mm at the age of 28 days. The results were validated by using the output of finite element analysis. The developed concrete casting procedure has effectively create no transition zone between both of concrete mixture. Finite element modeling of graded concrete approached by layer-wise homogenization method and axisymmetric models are very accurate to predict the peak load and displacement in accordance with the experimental results. The experimental results and finite element analysis showed that the compressive strength of graded concrete is determined by the lowest material strength, while the stiffness is influenced by the highest material strength. Keywords : graded concrete; experimental study; finite element modeling.
vi
ABSTRAK Dalam analisa struktur, elemen beton diasumsikan sebagai material yang homogen di mana seluruh bagian dari elemen struktur memiliki properties material yang seragam. Disintegrasi material yang disebabkan oleh faktor teknis selama pengecoran dan karakteristik campuran beton menyebabkan distribusi material pada elemen beton menjadi tidak seragam. Akibat adanya proses disintegrasi material tersebut, elemen beton memiliki properties material yang berubah secara gradasi sebagai fungsi jarak terhadap serat teratas elemen sehingga disebut sebagai beton gradasi. Penelitian ini bertujuan untuk memodelkan beton gradasi secara eksperimental dan analisa elemen hingga. Dua buah campuran beton yang memiliki mutu rencana 20 MPa dan 60 MPa dicetak dan dipadatkan secara intensif untuk membentuk zona transisi yang halus. Perilaku material dari beton gradasi diperoleh melalui pengujian uniaksial tekan dari spesimen silinder beton 100 x 200 mm pada umur 28 hari, dan divalidasi dengan output analisa elemen hingga dari program Strand7. Hasil penelitian menunjukkan bahwa prosedur pembuatan beton gradasi dengan cara pemadatan mekanis telah berhasil membentuk zona transisi secara efektif. Permodelan beton gradasi dengan metode layerwise homogenization dan model axisymmetric sangat akurat dalam memprediksi beban puncak dan perpindahan sesuai dengan hasil eksperimental. Hasil eksperimental dan analisa elemen hingga menunjukkan bahwa kuat tekan beton gradasi ditentukan oleh kekuatan material terendah, sementara kekakuan dari beton gradasi dipengaruhi oleh material yang memiliki kekuatan yang lebih tinggi. Kata Kunci : beton gradasi; eksperimental; analisa elemen hingga.
vii
AKNOWLEDGEMENTS Thank God for the gracious mercy and tremendous blessing that enables me to accomplish this Thesis entitled: An Experimental Study and Finite Element Approach to the Behavior of Graded Concrete. This Thesis is the partial fulfillment to obtain Master of Engineering degree at the Faculty of Engineering Diponegoro University I would like to express my special gratitude to my advisors: Dr. Ir. Han Ay Lie, M. Eng. and Prof. Dr. Ir. Buntara Sthenly Gan for their guidance, encouragement, and valuable assistance throughout this research process. I also would like to extent my gratitude to Dr. Techn. Ir. Sholihin As’ad, MT.; Dr. Ir. H. M. Jonkers; Prof. S. A. Kristiawan, ST., MSc., PhD.; and Prof. Wen-Hsiang Hsieh for the effort and valuable support as the external examiners. My thanks are conveyed to the Head of Master Program: Dr. Ir. Suharyanto, M.Sc.; Secretary: Ir. Arif Hidayat, CES, MT., and staffs for supporting me throughout the overall process. Moreover, I would like to address my thanks to all of my friends, lectures, laboratory assistants, and technicians at the Structural and Material Laboratory, Engineering Faculty of the Diponegoro University. I would like to give special appreciations to Ir. Adiwibawa Reksabuana; Johan Puspowardojo, ST.; and Farisi Abdul Aziz, ST. for their effort, time, and intellectual contribution in completing this work. Besides, I am also grateful to my friends, Aldyan Wigga Okiyarta, ST., Banu Ardi Hidayat, ST., Vanessa Numalita, ST., Yanuar Setiawan, ST., MT., Bobby Rio Indriyantho, ST., MT., and Aditya Sage Pamungkas, ST., MT., for their help and support during my research work. The greatest honor and appreciation would be finally dedicated to my beloved parents, Anwar Gozali, BSc. and Dra. Mamik Dwi Lestari. It is truly undoubted that loves, cares, spirits, motivation, patience and willingness to wait for my graduation and timeless prayers during days and nights are everything for me.
viii
TABLE OF CONTENT ENDORSEMENT
ii
DECLARATION OF SCIENTIFIC ORIGINALITY
iv
HALAMAN PERNYATAAN PERSETUJUAN PUBLIKASI
v
ABSTRACT
vi
ABSTRAK
vii
AKNOWLEDGEMENTS
viii
TABLE OF CONTENT
x
LIST OF FIGURES
xii
LIST OF TABLES
xiv
LIST OF NOTATIONS
xv
CHAPTER I
INTRODUCTION 1.1. Background
1
1.2. Scope of Research Work
2
1.2.1. Research Methodology
2
1.2.2. Research Outcome
3
1.2.3. Variable and Research Instruments, Samples, and Population
CHAPTER II
3
1.3. Problem Identification
5
1.4. Research Limitations
5
1.5. Summary of Content
7
LITERATURE REVIEW 2.1. Functionally Graded Material
9
2.2. Graded Concrete
10
CHAPTER III EXPERIMENTAL STUDY 3.1. Mix Proportion of Concrete
13
3.2. The Production of Graded Concrete
14
3.3. Testing of Specimens
19
ix
3.4. Evaluation of the Experimental Data
CHAPTER IV
CHAPTER V
3.4.1. Evaluation of Load-Displacement Response
21
3.4.2. Evaluation of Toe Region
22
3.4.3. Evaluation of Teflon Layer
23
FINITE ELEMENT ANALYSIS 4.1. Properties of Material
24
4.2. Graded Concrete Modeling
26
4.3. Arc Length Iteration
27
VALIDATION 5.1. Sensitivity Analysis
29
5.2. The Result of Axisymmetric and 3D Modeling
30
5.3. The Comparison of Experimental Test and Finite Element Analysis Result
CHAPTER VI
31
CONCLUSION
37
REFERENCES
39
APPENDIX A : Concrete Mix Proportion APPENDIX B : Laboratory Works APPENDIX C : List of Equipment APPENDIX D : The Weight of Specimen (Preliminary Test) APPENDIX E : Finite Element Modeling
x
LIST OF FIGURES
Figure 1.1
Methodology of the Research Work
Figure 2.1
Layer-wise Homogenization Model on Continuously Graded Microstructure (Rhee, 2007)
Figure 2.2
3
10
FGM as a Heterogeneous Material was Divided into 8 Layers of Homogeneous Material (Miedzinska and Niezgoda, 2012)
10
Figure 3.1
Visual Observation of Non-compacted Specimens
15
Figure 3.2
Visual Observation and Hammer Test Results of Vibrated Specimens
Figure 3.3
16
(a) Manual Compacting Equipment; (b) Procedure of Manual Compaction
Figure 3.4
17
Visual Observation and Hammer Test Results of Manual Compacted Specimens
Figure 3.5
18
The Configuration of Strain Gauge Application on Normal Concrete and Graded Concrete Specimen
19
Figure 3.6
Test Set Up for Graded Concrete Specimens
20
Figure 3.7
Poisson’s Ratio of the Graded Concrete Specimen
21
Figure 3.8
Evaluation of Toe Region on Load-Displacement Curve
22
Figure 3.9
Illustration of Superposition Procedure
23
Figure 4.1
Stress-Strain Relationship of Concrete in accordance with CEBFIB Model Code 2010
25
Figure 4.2
Axisymmetric Model
27
Figure 5.1
Stress Distribution of Axisymmetric Model in ZZ axis
29
Figure 5.2
Result of Sensitivity Analysis on Peak Load and Displacement Response
30
xi
Figure 5.3
Vertical Displacement and Stress Distribution Responses of Axisymmetric (left) and 3D (right) Model
Figure 5.4
31
The Comparison of Experimental Result to CEB–FIB Model Code 2010
32
Figure 5.5
The Result of Experimental Test and the Output of FEM
33
Figure 5.6
Stress Distribution on Graded Concrete Model and Normal Concrete Model
Figure 5.7
34
Stress Distribution on Graded Concrete at (a) Initial Loading until (b) Peak Load
Figure 5.8
35
(a) Vertical Strain; (b) Initial Stiffness Response of the Graded Concrete
36
xii
LIST OF TABLE
Table 1.1
Detail of Testing Specimen
4
Table 3.1
Mix Proportion of Concrete Mix
13
Table 3.2
The Results of Uniaxial Compression Test
20
Table 4.1
Initial Tangent Modulus and Corresponding Strain according to CEB-FIB Model Code 2010
25
Table 5.1
Comparison of Axisymmetric and 3D Analysis
31
Table 5.2
The Comparison of the Experimental Data and FEM Result
33
xiii
LIST OF NOTATIONS
ASTM
: American Standard of Testing Methods
DFRCC
: Ductile Fiber Reinforced Cementitious Composite
DOE
: Department of Environment
DOF
: Degree of Freedom
FGM
: Functionally Graded Material
FRC
: Fiber Reinforced Concrete
G
: Graded concrete specimen
h
: height of specimen
kN
: kilo Newton
LVDT
: Linear Variable Displacement Transducer
MPa
: Mega Pascal
P20
: Normal concrete specimen design to have a characterictic strength of 20 MPa
P60
: Normal concrete specimen design to have a characterictic strength of 60 MPa
PCC
: Portland Composite Cement
VCFEM
: Vonoroi Cell Finite Element Method
Eci
: initial tangent modulus
k
: plasticity number
σc
: concrete compression stress
εc,lim
: strain at the ultimate stress
fcm
: mean compressive strength of concrete at the age of 28 days
σct
: concrete tensile stress
Ec1
: secant modulus from (0,0) to the peak load point (MPa)
εc1
: strain at the peak load
εc
: concrete compression strain
εct
: concrete tensile strain
fctm
: mean tensile strength of concrete at the age of 28 days
υ
: Poisson’s ratio
xiv
CHAPTER I INTRODUCTION
1.1. Background Concrete is one of construction materials dominantly used as basic material together with steel wire to create a reinforced concrete structure. As compared with a fabricated material, concrete provides a wide freedom on deciding its strength depending on the mandated design. By adjusting the composition of cement, aggregates, and water in a mixture, a specific strength of concrete will be obtained. Besides its simplicity in design, the implementation of concrete casting does not require complex equipment. By using an integrated concrete casting instrument, the concrete mix could be easily placed and compacted into the frameworks, moreover in high rise building. Even though concrete element has been planned to have a uniform strength on the entire section, the characteristic of concrete mixture aggravated by some errors during the casting process make the distribution of concrete material becomes uneven along its resulting element. This phenomenon is caused by segregation and bleeding that commonly occur in the thick elements, such as column and deep beam. Neville (2003) in his study stated that segregation was defined as the disintegration of coarse aggregate from the mortar matrix, and load the coarse aggregates to sink in the bottom of the formwork, meanwhile bleeding was the rising of mix water from the concrete mix to the surface of element, shortly after the casting was completed. Segregation and bleeding are mostly caused by the differences in size and density of the concrete material, and the improper of casting procedures, such as the high usage of water-cement factor and the falling distance that exceed the code. Hidayat et al. (2015) prove the existence of a gradual structure on a concrete panel with a size of 600 x 600 x 200 mm in which planned with the uniform strength. A series of non-destructive and destructive testing, included Ultrasonic Pulse Velocity, Hammer testing, and uniaxial compression test from cored drill sample, were carried out to explain and to clarify the distribution of concrete
1
strength of the panel. The results showed that the bottom part of the element possessed of a higher compressive strength than the upper part. Furthermore, Hidayat et al. (2015) also analyzed the effect of gradual structure to the moment capacity of a beam structure. The gradual structure decreases the bending moment capacity. Despite the strength of concrete in the tensile area is ignored, the disintegration of the material causes the strength of the concrete in compression area weaker. The objective of this research was to propose intentionally a method to create a graded concrete specimen. This specimen was further utilized to study its behavior, and to explain the property mechanism of the resulting element through an experimental study and finite element analysis. 1.2. Scope of Research Work 1.2.1. Research Methodology This research is divided into two major parts; those are an experimental study and a finite element analysis (Figure 1.1). The experimental study was conducted at the Laboratory of Materials and Construction Diponegoro University while the finite element modeling was developed by using the Strand7 program. Two different types of concrete mix, 20 MPa and 60 MPa, were prepared, and casted into normal concrete and graded concrete specimens. Cylindrical concrete with a dimension of 100 x 200 mm were used as specimen and tested at the age of 28 days. The laboratory testing in this study was divided into two purposes: to obtain the Poisson's ratio of the concrete and the characteristics compressive strength of normal concrete specimens; and to obtain the behavior of the graded concrete specimens by using uniaxial compressive test method. In finite element analysis, the cylindrical specimen was approached with an axisymmetric model. The compressive strength and Poisson's ratio of concrete obtained through experimental tests were used as an input to Strand7 program while the stress-strain relationship of corresponding concrete strength was adopted from the CEB-FIB Model Code 2010. The output of
2
finite element analysis was further used to validate the results of experimental tests. Research Work of Graded Concrete
Experimental study
Finite element analysis
Concrete casting
Axisymmetric and 3D modelling
Stress distribution
Concrete testing
Load Displacement
Stiffness of material
Load Displacement
Properties of Material
Poisson’s ratio
Characteristic strength of concrete
Validation
Analysis and conclusion
Figure 1.1 Methodology of the Research Work
1.2.2. Research Outcome The result of this research was expected to be a preliminary study of graded concrete material, in which the testing specimen was constructed by using two concrete mixes, which have difference strength substantially. The influence of gradual structure on concrete was further observed on the responses of the compressive strength, the load-displacement relationship, the stiffness, and stress distribution.
3
1.2.3. Variable and Research Instruments, Samples, and Population Portland Composite Cement (PCC) manufactured by PT. Semen Indonesia, volcanic sand from Muntilan, Central Java, and coarse aggregate sized of 5/10 mm from the stone crusher product of PT. Jati Kencana Beton were used as the constituent materials of the concrete mix. Sika Vicocrete10, production from PT. SIKA Indonesia was also utilized as superplasticizer and poured to the P60 concrete mix to increase the workability. The testing specimens were divided into two groups, namely normal concrete and graded concrete specimens. Detail of the testing specimen in this research is shown in Table 1.1. Table 1.1 Detail of Testing Specimen Code
Description
Total (pcs)
Normal concrete specimen 100 x 200 mm (f’c = 20 MPa) P20
6
Normal concrete specimen 100 x 200 mm (f’c = 60 Mpa) P60
6
Graded concrete specimen 100 x 200 mm G
6
The normal concrete specimens were made with 20 MPa and 60 MPa and labeled as P20 and P60 respectively, while the graded concrete specimen
4
was created by combining those two concrete mixes in certain procedure and labeled as G. The uniaxial compression test was conducted by using Hung Ta HT-8391PC Computer Servo Controlled with a capacity of 2000 kN. 1.3. Problem Identification Based on the chronological explanation written in the background, the main issues that were elevated in this research were: •
How to create a smooth gradation in the transition zone between both of the casted mix?
•
How are the differences in the response of compressive strength, loaddisplacement relationship, stiffness, and stress distribution of the graded concrete with normal concrete specimens?
•
How is the significance of the experimental tests and finite element analysis results?
1.4. Research Limitations To specify the objective of this research work, some boundaries were defined as follow: Experimental Study •
The mixture of concrete consisted of PCC, sand, and coarse aggregate size of 5/10 mm.
•
Sika Viscocrete 10 with the percentage of 0.6% to the cement weight was used as an additive to increase the workability of the concrete mix.
•
The concrete mix was planned in accordance with Department of Engineering (DOE) standard.
•
Graded concrete specimens were casted by the developed method to create the smooth transition. Meanwhile, normal concrete specimens were placed based on ASTM C192. Both of them were casted in a cylindrical mold with a size of 100 x 200 mm and tested at the age of 28 days.
•
Graded concrete specimens were casted by using two different mixes designed to have the strength of 20 MPa and 60 MPa. The higher
5
concrete strength was laid down at the bottom of the mold during the casting, while it was set reversely upside down during the testing, so the 20 MPa layer opposed the loading platen. •
The valid data was obtained from six pieces of specimens for each variable.
•
Uniaxial compression test was conducted by using the stress rate of 0.20 MPa/sec (ASTM C33).
•
The Poisson's ratio was calculated from the strain reading of strain gauge at 40% of the peak load.
Finite element analysis •
Strand7 was employed for analyzing the graded concrete specimen through finite element modeling.
•
The graded concrete was modeled as an axisymmetric and 3D models.
•
The model was meshed with the quadrilateral element by ratio closely to 1, so the element has a good stability during the analysis.
•
Load increment was defined as load displacement approach.
•
Arc length was chosen for the iteration process to obtain the closest peak load before the iteration met diverged solution.
•
The modelling of graded concrete in FEM adopted the theory of layerwise homogenization.
•
Stress-strain relationship representing the behavior of concrete material was adopted from the CEB-FIB Model Code 2010.
•
The concrete strength in the graded concrete modeling was considered to follow a linear function to its depth.
•
The elements were analyzed as elastic non-linear material and nonlinear geometry.
•
Failure of the elements was determined by the Max Stress criterion.
•
The material was considered to behave elastic to identify the stressstrain table in compression and tension region as well.
•
The density of concrete was considered uniform for the overall concrete strength, which was 2400 kg/m3.
6
1.5. Summary of Content This thesis was compiled by the following arrangement: CHAPTER I
INTRODUCTION This chapter elaborates the basic thought about this study, the scope of research work covering the methodology of the work, research outcome, and research instrument and a sample of specimen equipped to obtain the sufficient data. Then, the problem identification was defined to highlight the objective of research. Furthermore, the research limitation was also considered to get focusing on the current works.
CHAPTER II
LITERATURE REVIEW The second chapter summarizes all of the research works related to functionally graded material, and also the graded concrete. This summary hopefully help the researcher to find the grey area of the previous study, and to develop further for the next works.
CHAPTER III
EXPERIMENTAL STUDY This chapter initially explains the concrete mix proportion used in this research, then the procedure of concrete casting, especially for graded concrete specimen, was further explained in depth, from the preliminary attempt until the recent method that successfully create a smooth transition. The test set up in the laboratory was also got across briefly, and the resulting experimental data was shown slightly. At last, a set of validation methods carried out on the experimental data was explained in certain sub-chapter to obtain a more valid and a realistic data series.
7
CHAPTER VI
FINITE ELEMENT ANALYSIS Chapter VI outlines the properties of the material used as the input of Strand7 program, the utilizing of CEB-FIB code was explained to generate a function relating the strength of concrete to the specific parameters. The understanding of the axisymmetric model and the concept of arc length iteration were discussed at a glance.
CHAPTER V
VALIDATION In this chapter, the result of sensitivity analysis from six constructed models were shown and discussed. The resulting analysis from the axisymmetric and 3D were evaluated, and the most suitable model to represent the graded concrete specimen was chosen. The comparison of the experiment test and finite element analysis was discussed in depth.
CHAPTER VI
CONCLUSION This chapter underlines the highlighted idea about this research work, either in experimental test result or the developed model in finite element analysis. Some suggestions were also mentioned to improve the future research.
8
CHAPTER II LITERATURE REVIEW
2.1. Functionally Graded Material Silva et al. (2006; 2008) and Ramu and Mohanty (2014) defined a functionally graded material (FGM) as a material which has properties that gradually changes within the microstructure of components, including modulus of elasticity, density, and Poisson's ratio. The use of FGM as an alternative material was firstly introduced by Cavanagh et al. (1972). In 1984, FGM project was subsequently developed for spacecraft in Japan. The concept of this research was to combine metal and ceramic material with a gradual transition, so there was no stress discontinuity and diminished a problems associated with delamination that often occurred in the laminate structure. This idea was also aimed to create a new material that was more resistant to high temperatures (Rhee, 2007; Birman and Byrd, 2007; Szafran, et al., 2005; Vemaganti, 2006; Kieback et al., 2003; Suresh, 2001). Roesler et al. (2007; 2008) stated that FGM could create material that possessed an optimal performance with lower production cost. FGM has the advantage of increasing the residual stress distribution, improve thermal resistance, resistance to cracking, and reduce the stress intensity factor, so that FGM is very prospective for further developed (Kapuria et al, 2014). The microstructure of FGM was grouped into three types, i.e. continuously graded microstructure, discretely graded microstructure, and graded multi-phase microstructure (Rhee, 2007). The composite material, included graded concrete, is classified into a heterogeneous material in terms of the microstructure. Long running time was required if the analysis was conducted at the microstructural level since the model has the excessive degree of freedom (DOF). To overcome this problem, the model is idealized into a structure which constructed by a number of layers containing the homogeneous properties of material, so called as layer-wise homogenization (Reiter et al., 1997; Sills et al., 2002). By using this method, the DOF of the structure will reduce, and the analysis becomes faster (Birman and Byrd, 2007).
9
Figure 2.1 Layer-wise Homogenization Model on Continuously Graded Microstructure (Rhee, 2007)
Miedzinska and Niezgoda (2012) conducted a numerical analysis to compare the behavior of FGM as a homogeneous and heterogeneous material. Layer-wise homogenization was used to simplify the model into homogeneous FGM (Vemaganti et al., 2006; Sills et al., 2002; Dong, 1983). FGM was modeled as the heterogeneous material when the composite material was considered as the particles distributed on a structure (Li et al., 2005; Szymczyk et al., 2007). Composite materials were considered linearly distributed with respect to the height of the specimen. Both types of models was analyzed by non-linear analysis program until it reached the ultimate load. The results showed that some sufficient layers in homogeneous model produced a stress-strain curve that was closely convergent with the heterogeneous models (Figure 2.2).
Figure 2.2 FGM as a Heterogeneous Material was Divided into 8 Layers of Homogeneous Material (Miedzinska and Niezgoda, 2012)
2.2. Graded Concrete The concept, modeling, and analysis of FGM on concrete elements: beam, plate, and shell have been discussed in several publications, especially by Birman
10
and Byrd (2007) and Jha et al. (2013). The accuracy of finite element analysis was influenced by micromechanical and kinematic models of the material used. The kinematic properties of the model were covering the displacement as a function of the thickness of the structure. Some research had defined that displacement was formulated as an exponential function of the thickness (Kashtalyan, 2004; Xu and Zhou, 2009; Vaghefi et al., 2010; Wen et al., 2011; Pendhari et al., 2012; Yang et al., 2012; Mantari and Soares, 2013; Thai and Kim, 2013; Sofiyev and Kuruoglu, 2014; Zuiker, 1995), others it was approached by a power law function (Yang et al., 2012). Dias et al. (2009) performed research on a corrugated sheets that featured with functionally graded fiber cement. These idea was come through a phenomenon that during the bending test, the stress tend to concentrate at the top and bottom fiber of its plate while the stress at the neutral axis was subtle. Therefore, the decision of distributing the fiber evenly along the structure becomes less effective. Fiber should be distributed gradually along its height, and accumulating at the bottom of the plate, to reduce the production cost without loss a significant capacity of structure, particularly in response to the modulus of rupture. Mastali et al. (2014) and Shen et al. (2008) substituted fiber to improve the ductility of the beam element, to increase the flexural strength, and to optimize the distribution of the load. To ensure the fiber was gradually distributed, Shen et al. (2008) implemented the compression techniques during the casting, and then the beam was examined by using scanning electron microscope (SEM). Another study stated that distribution of fiber on fiber reinforced concrete (FRC) should be ascertained by X-ray computed tomography (Bordelon et al., 2014; Krause et al., 2010). Additionally, Ferrara (2011) utilized a magnetic method to detect the spreading and density of fiber in steel fiber reinforced concrete (SFRC). By using one of the listed method above, the distribution of composite materials in concrete could be predicted and determined without performing a destructive action on the test specimen. Shin et al. (2007) investigated the influence of ductile fiber reinforced cementitious composite (DFRCC) on the concrete beam element. The use of DFRCC was intended to improve the strain hardening behavior of the beam. The
11
study was carried out in experimental and numerical analysis. DFRCC with a dimension of 10%, 20%, and 30% of the depth of beam were mounted on the bottom of the beam. Four-point bending testing was carried out, and the load-displacement response between the three specimens were compared. The results showed that DFRCC improved the deflection capacity and load capacity as well. Sburlati (2014) analyzed the effect of FGM on the sandwich structure. The testing specimen consisted of two types, namely sandwich plate with FGM core, and the other using a homogeneous core. The modulus of elasticity of the elements was considered to have an exponential function to the transversal direction while Poisson's ratio was considered at the same value. The results showed that FGM core influenced the response displacement and shear stress of the plate. Pendhari et al. (2012) developed an analytical study of FGM on a rectangular plate. Singha et al. (2011) investigated the behavior of plate subjected to transversal load by using non-linear FEM. FGM plate on simply support and subjected to transversal load previously had been investigated by the Chi and Chung (2006). In last decade, FGM analysis has been carried out by many researchers, including analysis of the plate bending with Navier approach (Chi and Chung, 2006), Rayleigh-Ritz approach (Loy et al., 1999; Pradhana et al., 2000; Sofiyev, 2003), even the dynamic analysis due to free vibration on plate and shell structures (Tornabene and Viola, 2013; Qu et al., 2013; Ferreira et al., 2005; Ferreira et al., 2006; Akbarzadeh et al. 2011; Oktem et al., 2012; Sofiyev and Kuruoglu, 2014; Kapuria et al., 2014).
12
CHAPTER III EXPERIMENTAL STUDY
3.1. Mix Proportion of Concrete Mix proportion is commonly used to determine the percentage of each concrete constituent based on the mandatory concrete strength. Two different concrete mixes that literary planned to have a very significant strength, those were 20 MPa and 60 MPa, were prepared. This significant difference in strength was decided to observe the behavior of an element having a contrast difference in compressive strength, between top and bottom layers. At this research, the proportion was obtained by using a method of Department of Engineering that has been modified to provide a sufficient fluidity on its resulting concrete mix. The modification of this standard was accomplished by adding a dosage of superplasticizer to increase the workability of the concrete. Coarse aggregate and volcanic sand satisfied with ASTM C33 standard were normalized into an ideal gradation. By using a sieving apparatus, both of them were separated by the grain size, and re-proportion by weight according to the formulated mix proportion. The proportion of concrete mix used in this study is shown in Table 3.1. Table 3.1 Mix Proportion of Concrete Mix Proportion in weight
fc’ (MPa)
Cement
Sand
Coarse Aggregate
Water
Superplasticizer
20 60
1.00 1.00
1.98 0.91
2.41 1.11
0.64 0.32
0.006
Table 3.1 shows that superplasticizer was omitted from 20 MPa mixture, since the original mix had already had a good workability, due to the high watercement factor. Meanwhile, the design strength of 60 MPa required a dosage of superplasticizer to increase its workability. As the result of many trial works, the superplasticizer will be optimally functions with the concrete mix at a minimum percentage of 0.6% to the cement weight. The challenge to produce a high degree of workability in combination with a high strength concrete was a major concern 13
for a smooth transition between the two concrete strengths, it could only be achieved by having a liquid mix. If the concrete mixes did not have a good fluidity, the compaction of concrete specimens would be hardly carried out, and graded concrete specimen could not be obtained. 3.2. The Production of Graded Concrete The specimens of this research were distinguished into two parts. Firstly, normal concrete that had 20 MPa and 60 MPa strength was equipped to be a control specimen and also to observe the mechanical properties of the material under the uniaxial compression test. Secondly, the graded concrete that created by casting both of concrete mixes through an intensive concrete casting method. Unlike the normal concrete specimens which casted by using a straight forward procedure in accordance with ASTM C192, the graded concrete had to go through several trial and error stages, until finally obtain the best method that resulting a smooth transition between the 60 MPa and 20 MPa mix. The mixing process was accomplished by mixing the basic materials that had been precisely measured based on the proportion in a concrete mix with the capacity of 0.8 m3 and a rotation speed of 25-30 rpm for three minutes. The water was gradually poured into the mixer, and then the mixing process was continued until a uniform mixture was obtained. Superplasticizer was simultaneously added, and the mixing was continued for another three minutes, so that it distributed evenly with the mix, and could optimally interact with the cement. The casting method of this study was done through several attempts and divided into two groups, namely gravitation approach and manual compacting method. In gravitational approach, the mix was expected to form a gradual structure because of the influence of gravitation. The mix proportion of 60 MPa concrete strength tends to have slightly higher cement content than the 20 MPa, causing it had a higher mass density as compared with the 20 MPa mix. The mixes were casted by using two different techniques to observe the effect of this contrast disparity. Both of them were placed in a layer into the mold without any additional compaction. In case A, the 60 MPa concrete was positioned at the bottom of the cast, while, in case B, the 60 MPa was positioned on top of the 20 MPa concrete that had been casted before. This approach was conducted to evaluate the possibility 14
of gravitationally creating a smooth graded concrete in the transition zone. The 20 MPa mix was dyed with a yellow color and the 60 MPa was in red to visually emphasize each of the concrete mix. The specimens were then split along its longitudinal axis. In both cases, a distinguishing line was observed at the border of the two mixes (Figure 3.1). The method did not yield in a graded specimen. A cold joint was also detected between the concrete mixes, resulting in a very weak interfacial zone that could easily be fractured by hand. Nevertheless, case A represented a better transition zone whereas some of the 20 MPa mix infiltrated to the 60 MPa. In the other hand, case B resulted in rather flat transition between the mixes, so it was suggested to place the 60 MPa concrete on the bottom of the cast.
60 MPa
20 MPa Transition zone
20 MPa
60 MPa
(a)
(b)
Figure 3.1 Visual Observation of Non-compacted Specimens (a) Case A: 60 MPa was at the bottom; (b) Case B: 20 MPa was at the bottom
The next attempt was to observe the influence of vibration to the resulting specimens. The specimens that have the exact similar configuration were casted into the prepared mold. The coloring was only done in the 20 MPa mix by using dark yellow to minimize the negative effect of dye on the concrete strength. After the specimens had completely casted, then both of them were vibrated on a vibration table for 30 seconds. Besides the visual evaluation, a rebound hammer test on the specimens was conducted to observe the degree of concrete strength gradation. The specimens were tested at the age of three days. Figure 3.2 depicted that the vibration resulted in a very smooth gradation between the two concrete mixes. The transition zone was covering about 50% height of the specimens. The graph next to the cutting plane of specimens was shown a distribution of concrete strength at its height 15
through the hammer test. Case A showed that the resulting compression strength graphs as a function of specimen’s height was more continuous than the case B, which was less smooth and irregular. This occurrence was most probably originating from the dense 60 MPa concrete mix that restricted its infiltration into the 20 MPa mix. From the visual observation, a severe segregation occurred in the 20 MPa mix. From here on it was decided to situate the denser mix on the bottom of the cast, beneath the less dense mixture. Even though vibration had successfully created a gradual structure on the specimens, this method would make the distribution of concrete strength turning into vary, so the upper and the bottom part
Height (cm)
of the specimen was no longer having either 20 MPa or 60 MPa strength.
Transition Zone
17.5 15 12.5 10 7.5 5 2.5 0
Transition Zone
5
10 15 20 25
Estimated Concrete Strength (MPa)
Height (cm)
Case A
17.5 15 12.5 10 7.5 5 2.5
Case B
0 5 10 15 20 25 Estimated Concrete Strength (MPa)
Figure 3.2 Visual Observation and Hammer Test Results of Vibrated Specimens (a) Case A: 60 MPa was at the bottom; (b) Case B: 20 MPa was at the bottom
16
Other than the previous approach, the manually compacted method was accomplished to improve the resulting specimen, especially to create a better transition zone in the vicinity of the boundaries between the two mixes. At this attempt, the casting procedure was done by multiple steps that more complex than before. Several pieces of equipment were used to assist during the casting procedure. Three types of tamping screw equipped with the fastening nuts were set with a length of 10, 15, and 18 cm. A perforated thin steel plate was also prepared to manage the tamping points during the manual compaction process. In order to avoid a surface bleeding, the tamping on the plate were done for 25 times through the template marked. The holes in the plate were designed to have one mm clearance to the diameter of the rod to ensure a free vertical movement, but minimize its horizontal motion. The plate is positioned on the upper edge of the cylindrical iron cast with clamps (Figure 3.3a). Tamping screw Nut Perforated thin steel plate
Tamping points
(a)
Tamping screw Perforated thin steel plate Cylindrical mold 100 x 200 mm
20 MPa
60 MPa
60 MPa
(b)
Figure 3.3 (a) Manual Compacting Equipment; (b) Procedure of Manual Compaction 17
First of all, half of the cast measuring ten cm in height was filled with the 60 MPa mix and compacted by using a tamping screw with a length of 18 cm. According to the study conducted by Juliana (2009), the tip of tamping screw did not have to touch the bottom side of the cast that could influence negatively to the specimen. Next, a quarter layer of 20 MPa concrete was poured on top of the first layer, and compacted by using the 15 cm tamping screw. This attempt would create five cm from each of the 20 MPa and 60 MPa mix minggled by this compaction. It was aimed to manually creating a graded transition zone. Then, a final layer of 20 MPa concrete was placed on top and was compacted by using the ten cm of tamping screw. These procedures are ilustrated in Figure 3.3b. A visual examination of the cutted specimen showed that a gradual transition between the two mixes, the 60 MPa being dark gray, and the 20 MPa mix whitish, was obtained (Figure 3.4). This method was proven in artificially created an almost perfect smooth transition between the two concrete strengths. The accompanying rebound hammer test also demonstrated a much better graph when compared to the
Height (cm)
vibration method. 17.5 15 12.5 10 7.5 5 2.5 0 5 10 15 20 25 Estimated Concrete Strength (MPa)
Figure 3.4 Visual Observation and Hammer Test Results of Manual Compacted Specimens
After the normal and graded concrete specimens had been casted into the molds, the specimens were placed on a flat plane for about 24 hours before demolding. The resulting specimens were then submerged in water pond and dried up under the sunlight before the testing that was held at the age of 28 days.
18
3.3. Testing of Specimens Both of normal concrete and graded concrete specimens were tested at the age of 28 days by using Hung Ta Servo HT-8391PC Computer Controlled in uniaxial compression testing with the loading rate of 0.20 MPa/sec. The specimen was equipped with four linear variable displacement transducers (LDVTs) to measure the displacement response during loading. A load cell with a capacity of 1000 kN was used to record the load increment, and strain gauges type PFL 30-113LT (Tokyo Sokii Kenkyujo) was used to measure the longitudinal and transversal strains during the testing, so further could be measured the Poisson’s ratio and the initial stiffness of each material. The configuration of strain gauges mounted on normal and graded specimens is shown in Figure 3.5.
Strain gauge
Front Side
a) Normal Concrete Specimen
Back Side
b) Graded Concrete Specimen
Figure 3.5 The Configuration of Strain Gauge Application on Normal Concrete and Graded Concrete Specimen
For normal concrete, the strain gauges were set precisely in the middle of specimen’s height, while, for the graded concrete, the strain gauges were mounted at five points along the height of the specimen. All of testing equipment, included the LVDTs, loadcell, and the strain gauges, were connected to a data logger that had been synced to a computer. Two layers of 1000 µm Teflon coated with grease were inserted on top and at the bottom of the specimens to diminish the confinement effect resulting from friction between the loading plate and the specimen, and to generate a more realistic experimental data (Vonk, 1992; Kotsovos, 1983). The load-displacement response of the Teflon layers was recorded separately and was used to correct the load-displacement data of the specimens. During the test, the 19
position of graded concrete specimens was reversed against the original casting condition, so the 20 MPa was at the bottom side and contacted with loading platen. The test set up for the specimens were depicted in Figure 3.6. Loading platen Bearing plate I (t =10 mm) Teflon LVDT Strain gauge PFL 30-11-3LT Concrete Specimen Magnetic base Teflon Bearing plate II (t =10 mm) Load cell
Figure 3.6 Test Set Up for Graded Concrete Specimens
Six pieces of valid specimens were used to compose a representative data. The concrete strength of the testing specimens were obtained by dividing the data of ultimate load with the base area of the cylindrical specimens. The resulting experimental data for the normal concrete (P20 and P60) and the graded concrete (G) is shown in Table 3.2. Table 3.2 The Result of Uniaxial Compression Test Concrete Strength (MPa) Code P20 P60 G
1
2
3
4
5
6
22.618 58.240 27.030
27.628 58.159 24.309
24.824 60.032 24.041
25.938 58.591 24.041
23.463 44.352 22.515
23.752 63.983 27.360
Mean Concrete Strength (MPa) 24.704 57.226 24.883
Poisson’s ratio was calculated by dividing the horizontal strain to the vertical strain at the 40% of peak load. The reading of Poisson’s ratio was represented in five different height. The data representing the Poisson’s ratio at 62.5, 100, and 137.5 mm were obtained from graded concrete specimen. Because the strain gauge could not be perfectly attached at a very extreme part of the graded concrete
20
specimens, the Poisson’s ratio for 0 and 200 mm was considerably adopted from normal concrete specimens, P20 and P60. After, the Poisson’s ratio was approached to follow a linier behavior to the height of concrete specimen. A graph disclosed a relationship between the height of graded concrete specimens to the resulting Poisson’s ratio is depicted in Figure 3.7. At this part, the strength of concrete in each layer having a linier relation with the height. A mathematical function
Poisson's Ratio (v)
generated from this approach was then used as the input to finite element program. 0.290 0.270 0.250 0.230 0.210
v(h) = -0,0002h + 0.2662
0.190 0.170 0.150 0
50
100
150 200 Height (mm)
Figure 3.7 Poisson’s Ratio of the Graded Concrete Specimen
3.4. Evaluation of the Experimental Data Load-displacement data obtained from the experimental test had not necessarily had a good data order, despite it had represented a specific behavior of the material. Before this result was compared with the output of finite element analysis, it required the correction to evaluate some issues related to the test set up being used. The evaluation was covered in the response of toe region, and also the usage of Teflon sheet during the testing. 3.4.1. Evaluation of Load-Displacement Response The experimental data recorded by data logger was initially sorted into a good sequence. The starting point of load-displacement data was set to zero, and then all of the following data was calibrated with a coefficient number that was used for normalizing the data. The following data should obey a
21
pattern that the load continued to rise until the peak load was achieved, and decrease until the specimen had been failed. The displacement response of the specimen will also increase simultaneously along the testing time, due to the failure of the specimens. The stagnant and declining points found on data should be removed, and then macro Excel program was used to generate a series of data with the uniform load increment. The interpolated data will ease the researcher on evaluating the load-displacement response due to the usage of Teflon layers. 3.4.2. Evaluation of Toe Region Toe region represents an unrealistic behavior of the non-linear material, as though the material exhibits the lower stiffness in a low loading level. Concrete, as a non-linear material represents a higher stiffness in a very initial loading, then the stiffness gradually decreases due to the crack propagation during the testing. Toe region is prominently influenced by the testing set up. During the initial loading, a loading platen will start settling to the specimen, until both of them adhere each other. This adjustment leads the displacement to have been recorded at the moment while the load remains zero. An evaluation was conducted by approaching the curved part with a straight line from an inflection point and intercepting the displacement axis (ASTM D695). The inflection point was then appointed to be a new initial
Load (kN)
point for the load-displacement curve (Figure 3.8). 250 200 150
Inflection point
100 50 Toe region
0 0.000
0.500
1.000 1.500 Displacement (mm)
Figure 3.8 Evaluation of Toe Region on Load-Displacement Curve
22
3.4.3. Evaluation of Teflon Layer Teflon layer utilized for a laboratory testing is intended to generate a more realistic data series (Vonk, 1992; Kotsovos, 1983; van Vliet and van Mier, 1995). The experimental data was superposed on the resulting data of Teflon test, which had been carried out separately at the same loading rate. The superposition of those two curves resulted in a load-displacement
Load (kN)
relationship from the concrete material only (Figure 3.9). 180 160 140 120 100 80 60
Concrete + Teflon Beton + Teflon
40
Teflon Teflon
20
Concrete Beton
0 0.000
0.200
0.400
0.600 0.800 Displacement (mm)
Figure 3.9 Illustration of Superposition Procedure
23
CHAPTER IV FINITE ELEMENT ANALYSIS
4.1. Properties of Material Strand7 is one of finite element program; that is eligible to model and to solve a non-linear material, including the graded concrete specimen. The parameter of the program could be adjusted to obtain an output of analysis that closely similar with the experimental data. Strand7 requires the properties of materials as the input of the program, such as Poisson’s ratio (υ), the density of the material (γ), and stressstrain curve (σ-ε), failure criteria. Poisson’s ratio of material was obtained from the experimental data, while the density of concrete was considered as constant for all of the concrete strength, at 2400 kg/m3. Stress-strain relationship of concrete was adapted from CEB-FIB Model Code 2010, so the solver of the program could calculate and update the modulus of elasticity in every load increment along the analysis. The relationship between stress-strain in compression region is following CEB-FIB Model Code 2010 code in equation 4.1. 𝜎𝜎𝑐𝑐
𝑓𝑓𝑐𝑐𝑐𝑐
𝑘𝑘𝑘𝑘−𝜂𝜂 2
= − �1+(𝑘𝑘−2)µ� for 𝜀𝜀 ≤ 𝜀𝜀𝑐𝑐𝑐𝑐
(4.1)
Where : 𝜂𝜂
𝑘𝑘
𝜀𝜀
= 𝜀𝜀 𝑐𝑐
𝑐𝑐1
𝐸𝐸
= plasticity number = 𝐸𝐸 0
𝑐𝑐1
𝐸𝐸𝑐𝑐𝑐𝑐
= initial tangent modulus = 21,5
𝜀𝜀𝑐𝑐1
= strain at peak stress
𝜀𝜀𝑐𝑐
= compression strain of concrete
𝐸𝐸𝑐𝑐1
𝜎𝜎𝑐𝑐
𝑓𝑓𝑐𝑐𝑐𝑐
1
𝑓𝑓𝑐𝑐𝑐𝑐 3 � 10 �
(GPa)
= secant modulus from (0,0) to ultimate stress (MPa)
= compression stress of concrete
= mean of concrete strength at the age of 28 days
Strain and plasticity number of concrete are listed in Table 4.1.
24
Table 4.1 Initial Tangent Modulus and Corresponding Strain according to CEB-FIB Model Code 2010 f’ c (MPa)
12
20
30
40
50
60
70
80
90
100
110
120
𝐸𝐸𝑐𝑐𝑐𝑐 (GPa)
271
30.3
33.6
36.3
38.6
40.7
42.6
44.4
46.0
47.5
48.9
50.3
𝜀𝜀𝑐𝑐1 (‰)
1.8
2.1
2.3
2.4
2.5
2.6
2.7
2.8
2.9
3.0
3.0
3.0
𝜀𝜀𝑐𝑐,𝑙𝑙𝑙𝑙𝑙𝑙 (‰)
3.5
3.5
3.5
3.5
3.4
3.3
3.2
3.1
3.0
3.0
3.0
3.0
k
2.44
2.28
2.04
1.82
1.66
1.55
1.47
1.41
1.36
1.32
1.24
1.18
Stress (MPa)
Where : 𝜀𝜀𝑐𝑐,𝑙𝑙𝑙𝑙𝑙𝑙
= strain at ultimate stress
fcm fcf Eci
Ecf
Ec1
0.00015 εct
εc1
εc,lim
0.9fctm
Strain, ε
fctm
Figure 4.1 Stress-Strain Relationship of Concrete in accordance with CEB-FIB Model Code 2010
Based on the data listed in Table 4.1, the strain value and plasticity number of each concrete strength was formulated as a function of compression strength of concrete (Han, 2013; Setiawan, 2014; CEB-FIB Model Code 2010). 𝜀𝜀𝑐𝑐1
= 0.0005 𝑙𝑙𝑙𝑙(|𝑓𝑓𝑐𝑐𝑐𝑐 |) + 0.0006
𝜀𝜀𝑐𝑐,𝑙𝑙𝑙𝑙𝑙𝑙
= −10−5 |𝑓𝑓𝑐𝑐𝑐𝑐 | + 0.0039
𝜀𝜀𝑐𝑐,𝑙𝑙𝑙𝑙𝑙𝑙
𝜀𝜀𝑐𝑐,𝑙𝑙𝑙𝑙𝑙𝑙
(4.2)
= 0.0035
for |𝑓𝑓𝑐𝑐𝑐𝑐 | ≤ 40
(4.3)
= 0.0030
for |𝑓𝑓𝑐𝑐𝑐𝑐 | ≥ 90
(4.5)
for 40 < |𝑓𝑓𝑐𝑐𝑐𝑐 | < 90
(4.4)
25
𝑘𝑘
= −0.572 𝑙𝑙𝑙𝑙(|𝑓𝑓𝑐𝑐𝑐𝑐 |) + 3.9265
(4.6)
The tension behavior of concrete was formulated in equation (4.7) and (4.8),
and was distinguished from two different condition, as follow : 𝜎𝜎𝑐𝑐𝑐𝑐 ≤ 0,9. 𝑓𝑓𝑐𝑐𝑐𝑐𝑐𝑐 and 0,9. 𝑓𝑓𝑐𝑐𝑐𝑐𝑐𝑐 < 𝜎𝜎𝑐𝑐𝑐𝑐 ≤ 𝑓𝑓𝑐𝑐𝑐𝑐𝑐𝑐 . 𝜎𝜎𝑐𝑐𝑐𝑐 𝜎𝜎𝑐𝑐𝑐𝑐
= 𝐸𝐸𝑐𝑐𝑐𝑐 . 𝜀𝜀𝑐𝑐𝑐𝑐 (4.8)
= 𝑓𝑓𝑐𝑐𝑐𝑐𝑐𝑐 . �1 − 0,1.
0,0015−𝜀𝜀𝑐𝑐𝑐𝑐 � 𝑓𝑓 0,0015−0,9. 𝑐𝑐𝑐𝑐𝑐𝑐 𝐸𝐸𝑐𝑐𝑐𝑐
for 𝜎𝜎𝑐𝑐𝑐𝑐 ≤ 0,9. 𝑓𝑓𝑐𝑐𝑐𝑐𝑐𝑐 for
(4.7)
0,9. 𝑓𝑓𝑐𝑐𝑐𝑐𝑐𝑐 < 𝜎𝜎𝑐𝑐𝑐𝑐 ≤ 𝑓𝑓𝑐𝑐𝑐𝑐𝑐𝑐
4.2. Graded Concrete Modeling In finite element modeling (FEM), the graded concrete specimen was modeled in an axisymmetric and a 3D model. This approach was intended to compare both of analysis results and to propose the most suitable model that represent the actual behavior of graded concrete. The modeling was carried out by simplifying the gradual structure into some layers that possess the homogeny properties of materials, so called as layer-wise homogenization. In this analysis, the material was considered as an isotropic. Thus the material remain the same modulus of elasticity in all strain direction even when the material has exceeded the cracking. The concrete was expected to behave as an elastic material, so Strand7 could completely read the stress-strain curve, in compression and tension area. Maximum Stress was chosen as the failure criterion in analysis, due to the limitation of other criteria provided for the brittle material inside of this program. The modeling of axisymmetric in Strand7 have to accomplished either in the first quadrant (X+, Y+) or the fourth quadrant (X+, Y-). The loading should act in X-Y plane, and the boundary condition of the model should be symmetrical about the axis of rotation. The cylindrical model was approached with a 2D plane, representing a half part of the longitudinal section, rotating about Y axis to establish a full model (Figure 4.2). The axisymmetric models were discretized by using a quadrilateral element while the 3D model used a brick elements. The size of meshing was determined solely so that the aspect ratio of the meshed element was close to 1. Higher ratios will result in poor-elements, and could lead to ill conditions
26
during the FEA. High ratios also negatively influence the level of accuracy of the FEA. The boundary conditions for the FEM were adapted to the current state of the experimental testing, enabling a horizontal node displacements at the upper and bottom of the model due to the usage of Teflon layer (Hutton, 2004). During testing, the 20 MPa concrete layers of the graded specimen were therefore placed opposite to the casting configuration and positioned on the bottom. Restraint
Layerwise Homogenization
Restraint
Displacement Load
Figure 4.2 Axisymmetric Model
The displacement control was used as the external load during the analysis, instead of the load control. The model was subjected with one mm of displacement load at every node in the bottom fiber, to ensure the bottom nodes moving toward the top nodes simultaneously. Freedom case was used to configure the increment of displacement during the analysis. The increment was reduced when the iteration steps up to the peak load; then the solver could reach the convergence easier. In order to reduce automatically the increment step until the iteration process completed the sub-step option was activated. Load-displacement interaction resulted from the iteration was then extracted into load-displacement curve, and compared with the experimental result. 4.3. Arc Length Iteration Arc length iteration is one of many iterations that frequently used in nonlinear analysis, since it does not only accommodate a negative stiffness behavior,
27
but also can handle snapping and buckling (Riks, 1979; Crisfield, 1981; Ramm, 1981; Schweizerhof and Wriggers, 1986). During the analysis, arc length requires a predictor and a corrector parameter to find the equilibrium path. As compared with the Newton-Raphson method, arc length method provides the better stability in determining the convergence point. Sub-stepping functions to reduce the load increment, to obtain the convergence solution. In Strand7, there are three types of sub-stepping: Load scaling, displacement scaling, and displacement control (arc length). Load scaling is the simplest method, in which the sub-stepping is accomplished by downscaling the load to 50% if the solutions resulted from the iterations have not satisfied the converged point yet, whilst displacement scaling has a different concept of the previous method. Displacement scaling will reduce the increment of displacement when the displacement and the rotation of the model exceed the maximum boundary that has been defined before. Displacement control (arc length), that used in current analysis, considers the length of arc resulted from the iteration, to define the displacement allowed for each step through the parameter Maximum Rotation Increment and Maximum Displacement Increment. If the solution resulted from the resulted has not convergent, the arc length will be reduced until Minimum Arc Length Reduction Factor. In this program, a set of the parameter was defined as the boundary of the analysis. Some parameters used in this analysis are stated below. Maximum rotation degree increment = 0.003 degree; Maximum displacement increment = 0.00001; Maximum non-linear fiber material strain incerement = 0.0001; and the minimum arc length reduction factor = 1 x 10⁻⁶.
28
CHAPTER V VALIDATION
5.1. Sensitivity Analysis Six variants of axisymmetric model consisting of two, four, eight, 16, 32, and 64 layers were analyzed through the sensitivity analysis to distinguish the stress concentration from each model, and to acquire the number of layers resulting the most efficient outcome in modeling. The stress distribution in ZZ axis resulted from the displacement = 0.01 mm is shown in Figure 5.1.
(a) 2 layer
(b) 4 layer
(c) 8 layer
(d) 16 layer
(e) 32 layer
(f) 64 layer
Figure 5.1 Stress Distribution of Axisymmetric Model in ZZ axis
Blue contour showed the greatest stress while the red color indicated the smallest stress. Stress concentration in each model was highlighted with a red circle. Figure 5.1 depicted that the model constructed with two and four layers had slightly different stress distribution. The first model showed that the stress concentration occurred in mid high of the model or was pointed in the transition area, yet the second model occurred in the lower position. Other than that, the stress distribution occurred in a model built from eight until 64 layers had almost the same contour. Stress concentration happened at the bottom tip of the element having the lowest strength and propagated to the upper layer that has greater strength. In model constructed with eight layers, the stress concentration was also befallen in transition
29
areas, as well as found in the previous models. The sensitivity analysis proved that the sufficient number of layers used in the model could eliminate the stress concentrations, and could increase the convergence of the analysis (Figure 5.2). The significance response of peak load and displacement become smaller as the increasing of the layer. The response to peak load increased up until the eight layer model and dropped on the model 16 to 64 layers. Displacement and peak load response began to converge on 32 layers model towards 64 layers. With the significance value of 0.819% for peak load response, and 0.125% for the displacement, the current model was considered to be closely convergent. The analysis for the model constructed with more than 32 layers generates the non-
193
0.300
192
0.250
191
0.200
190
Displacement (mm)
Peak Load (kN)
significant results.
0.150 189 0.100
188
Peak Load Series1 187
0.050
Series2 Displacement
186
0.000 0
10
20
30
40
50
60
70
Number of Layers
Figure 5.2 Result of Sensitivity Analysis on Peak Load and Displacement Response
5.2. The Result of Axisymmetric and 3D Modeling The comparison of the results analysis of the axisymmetric and the full model are shown in Table 5.1. The results exhibited that both of models have the same displacement at the peak load, however, the axisymmetric model yield the higher peak load respond than the 3D.
30
Table 5.1 Comparison of Axisymmetric and 3D Analysis Model Displacement (mm) Peak Load (kN)
Axisymmetric 0.209 190.352
3D 0.209 187.792
The vertical displacement and stress distribution resulted from the FEA were used as the visual observation of the model. Because of the 3D represented a specimen into a full model, the observation plane was obtained from the cutting plane along its longitudinal axis (Z axis). Both of the axisymmetric and 3D model showed the similar contour, especially on the stress distribution. The stress concentration of both of the models occurred at the certain location, in which has the weakest strength. Therefore, an axisymmetric model could be applied and developed further in FEM to represent the cylindrical specimen, due to the excessive DOF on a 3D model that requires a long running time during the analysis.
(a) Vertical Displacement
(b) Stress Distribution
Figure 5.3 Vertical Displacement and Stress Distribution Responses of Axisymmetric (left) and 3D (right) Model
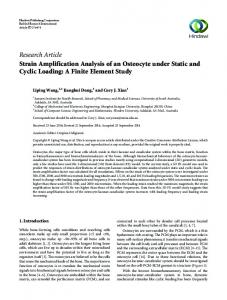
5.3. The Comparison of Experimental Test and Finite Element Analysis Results The experimental test showed that the peak load achieved by the graded concrete specimen (G) was similar to P20, that was equal to 194 kN while the P60 specimen reached 449 kN. It indicated that the compressive strength of graded concrete was determined by the lowest strength material. Once the subjected load
31
reaching the peak load, the P20 layer began to crack, propagating towards the upper layer, and create a large crack in direction to the applied load. Although the graded concrete specimen had been failed, the P60 layer locating at the extreme upper part of the specimen was still intact. The stress-strain relationship of the P20, P60, and G from the experimental test and finite element analysis were compiled together in the same axis coordinates. The uniform specimens P20 and P60 exhibited a stress-strain behavior that following the CEB-FIB code while the graded concrete showed the greater stiffness and complied the behavior of P60 material. It was proven through a deep observation on the G data that showing the material responded linearly up to 50% of the ultimate strength and followed the behavior of the higher compound rather than P20. At the ultimate load, P20 and P60 reached the ultimate strain that equals to 0.003, while the G specimen possessed more brittle in nature and only reach the
Stress (MPa)
ultimate strain 30% of the normal concrete (Figure 5.4). 60 50 40 30 CEB P60 CEB P20 Eksperimental P60 Experimental P60 Experimental GG Eksperimental Experimental P20 Eksperimental P20
20 10 0 0
0.0005
0.001
0.0015
0.002
0.0025
0.003 0.0035 Strain
Figure 5.4 The Comparison of Experimental Results to CEB–FIB Model Code 2010
Whereas the post peak behavior of the experimental test was quite different with the code, the loading rate chosen during the testing had to be considered. Stress rate adjusts the testing machine to compress the specimen with a constant stress from the beginning until the failure. When the loading reaches the peak load, the concrete specimen occurs the major deformation without any influence of the external load, so that the data could not be completely read by the equipment. Strain 32
rate could be considered to use for further research work, due to the loading is adjusted by an increment of strain during the testing so the resulting data would be better. The validation of experimental results and the output of FEM is shown Figure 5.5 and Table 5.2 below. The output of the developed model in Strand7 was closely similar the experimental data, specifically on peak load and displacement responses. The significance of both results on graded concrete was 1.9562% for the peak load response and 17.5388% for the displacement response. The difference between the experimental result and output of FEM was primarily caused by several approaches to modeling, and uncontrollable factor during the experimental test. The existence of interlocking within the concrete compound likely takes place on the increasing of strength and displacement respond during the experimental test. Table 5.2 The Comparison of the Experimental Data and FEM Result
Load (kN)
Parameter Peak Load (kN) P20 P60 G Displacement at the Peak Load (mm) P20 P60 G
Experimental
FEM
Sig. (%)
194.103 449.633 194.150
194.102 449.497 190.352
0.0006 0.0302 1.9562
0.396 0.539 0.253
0.440 0.520 0.209
11.0938 3.5562 17.5388
500 450 400 350 300 250 200
Experimental P60 P60 Eksperimental FEMP60 P60 FEM Eksperimental Experimental G G FEM FEMGG Eksperimental Experimental P20 P20 FEM FEMP20 P20
150 100 50 0 0
0.1
0.2
0.3
0.4 0.5 0.6 Displacement (mm)
Figure 5.5 The Result of Experimental Test and the Output of FEM
33
Figure 5.5 showed that Strand7 could not generate the post peak responses for the analysis. Based on the parameter inputted to the program, the solution becomes non-convergence immediately, after the iteration beyond the peak load. Nonetheless, the current load-displacement relationship resulted from Strand7 was likewise with experimental data. To emphasize that the iteration has completely done, and the peak load has been achieved, the load-displacement curve was equipped with an imaginary line (dash line) to represent the post peak behavior of the model. Based on the stress distribution from the finite element analysis, the model of graded concrete has substantially different patterns with the normal concrete model (Figure 5.6). At the beginning of loading, the stress is concentrated in the lowest layer of the model, then spreading toward the layers that have higher material properties, and at last, the stress was also concentrated at the lower part of the cylinder’s body (Figure 5.7). It agreed with the current experimental result that the specimen initially failed on the weakest element, and was followed by a failure on the lower part of cylindrical specimen. Unlike the graded concrete model, none of stress concentration was found in the normal concrete specimen, so it formed a columnar crack during the uniaxial compression test.
(a) Graded Concrete
(b) Normal Concrete
Figure 5.6 Stress Distribution on Graded Concrete Model and Normal Concrete Model
34
(a)
(b)
(d)
(c)
(e)
(f)
Figure 5.7 Stress Distribution on Graded Concrete at (a) Initial Loading until (b) Peak Load
The reading of the strain gauge mounted on the surface of the graded concrete specimen during the experimental study showed that the lowest concrete strength located at the extreme bottom fiber exhibited the greatest strain value (Figure 5.8). The reading is because, at the same load level, the low strength material that has the smaller stiffness will experience greater displacement. Meanwhile, the strain response of the upper part of the specimen had the greater gradient, which means that it possesses the greater stiffness than the bottom layer. The stiffness responses of the layer located at h = 175 mm and h = 137.5 mm seems to be very similar and almost create a lap-joint. It was due to the failure was predominantly occurred at the bottom part, and it did not disturb the upper part at most. Figure 5.8 clarified the vertical strain response of graded concrete model in color contour. Vertical strain pattern in the upper part has rather a same contour color while the bottom shows the diverse colors. This finite element analysis results in deal with strain gauge readings of the experimental test. Strain concentration at the lower part of the model caused the model to experience greater strains.
35
Stress (MPa)
10 Exp. - h = 175 mm FEM - h = 175 mm Exp. - h = 137.5 mm FEM - h = 137.5 mm Exp. - h = 100 mm FEM - h = 100 mm Exp. - h = 62.5 mm FEM - h = 62.5 mm Exp. - h = 25 mm FEM - h = 25 mm
8 6 4 2 0 0.0000
(a)
0.0001
0.0002
0.0003
0.0004 0.0005 Strain
(b)
Figure 5.8 (a) Vertical Strain; (b) Initial Stiffness Response of the Graded Concrete
36
CHAPTER VI CONCLUSION
•
The developed concrete casting procedure has successfully created a smoother transition zone between two substantially different concrete strength. The resulting specimen was accompanied by a visual observation and a rebound hammer test to prove the gradual structure along its height of the specimen. The more innovative, precise, and standardized casting method could be developed further to produce a graded concrete specimen. The mechanical system should be considered to control the compacting method so that the perfect gradual structure could be obtained further.
•
Layer-wise homogenization approach together with the axisymmetric modeling were versatile in predicting the resulting peak load and the displacement corresponding with the experimental test. The model was able to illustrate precisely the stress concentration and the strain behavior of every layer within the graded concrete specimen. The axisymmetric model could reduce the number of degree of freedom within the specimen so that the iteration will be more efficient and faster.
•
Sensitivity analysis was required to obtain the sufficient number of layers and meshing size of the model so that the analysis becomes convergent in peak load and displacement responses.
•
The result of the experimental test and FEM explained that the peak load of the graded concrete specimens leaned toward the weakest concrete strength, that equals to P20 strength, while the greatest concrete strength increased the stiffness response of the resulting specimen. The input data used as the parameter of the program should be studied in depth to generate the post peak behavior of the models, whilst the choice of loading rate utilized during the experimental test should be considered to obtain the ductility behavior of the specimens.
37
•
Graded concrete posses are more brittle in nature than the conventional concrete in the uniaxial compression test. The ultimate strain of the graded concrete only reached about 30% from the strain of normal concrete. The brittle behavior of the resulting material is due to a combination of premature microcracking in a low loading level, and the stress differentiation in the material, that leads to stress concentrations in the corresponding layer.
•
More elaborate and in-depth experimental study should be conducted to explain the influence of the strength differences factor to the behavior of the graded specimen. The dimensional effect of specimen, the amount of concrete mixes, range of concrete strength, and casting technique should be observed in order to clarify the result of the recent findings. The configuration of concrete casting should be adjusted and be optimized, so it accords a positive influence on performance of the building element. In beam elements, concrete material which has a higher compressive strength should be positioned on the upper part of the element in order to increase the compressive strength of the beam section. If the higher strength of concrete is concentrated at the lower section, so the strength of the concrete was then ignored by the presence of steel reinforcement, withstanding the overall tensile strength of the structure.
38
REFERENCES
Akbarzadeh, A.H., Abbasi, M., Hosseini Zad, S.K., Eslami, M.R., 2011. Dynamic analysis of functionally graded plates using the hybrid fourier-laplace transform under thermomechanical loading. Mechanica 46, 1373-1392. ASTM C192/C192M. Practice for Making and Curing Concrete Test Specimens in the Laboratory. ASTM Book of Standards 04.02. ASTM C33. Standard Spesification for Concrete Aggregate. ASTM Book of Standards 04.02. ASTM C39/ C39M. Standard Test Method for Compression Strength Of Cylindrical Concrete Spesimens. ASTM Book of Standards 04.02. ASTM D695. Standard Test Method for Compressive Properties of Rigid Plastics. ASTM Book of Standards 04.02. Birman, V., Byrd, L.W., 2007. Modeling and analysis of functionally graded materials and structures. Appl. Mech. Rev. 60, 195-216. Bordelon, A. C., Roesler, J. R., 2014. Spatial distribution of synthetic fibers in concrete with X-ray computed tomography. Cement and Composites 53, 3543. Cavanagh, J.R., Cross, K.R., Newman, R.L., Spicer, W.C., 1972. The graded thermal barrier-a new approach for turbine engine cooling. In: Proc. Thirteenth U.S.Structural Dynamics and Materials Conference, 1. Chi, S., Chung, Y., 2006. Mechanical behavior of functionally graded material plates under transverse load, part I: analysis. Int. J. Solids Struct. 43, 36573674. Crisfield, M.A. 1981. A fast incremental/iterative solution procedure that handles snap-through. Comput and Struct 13(1):55–62.
39
Dias, C. M. R., Savastano Jr., H., John, V. M. 2009. Exploring the potential of functionally graded materials concept for the development of fiber cement. Const. and Building Materials (24), 140-146. Dong, S.B., 1983. Global–local finite element methods, state-of-the-art surveys on finite element technology. American Society of Mechanical Engineers (ASME). New York. 451–474. Ferrara, L., Faifer, M., Toscani, S., 2012. A magnetic method for non destructive monitoring of fiber dispersion and orientation in steel fiber reinforced cementitious composites—part 1: method calibration. Materials and Structures 45, 575–589. Ferreira, A.J.M., Batra, R.C., Roque, C.M.C., Qian, L.F., Jorge, R.M.N., 2006. Natural frequencies of functionally graded plates by a meshless method. Compos. Struct. 75, 593-600. Ferreira, A.J.M., Batra, R.C., Roque, C.M.C., Qian, L.F., Martins, P.A.L.S., 2005. Static analysis of functionally graded plates using third-order shear deformation theory and a meshless method. Compos. Struct. 69, 449-457. FIB Bulletin Nr. 55 and 56, 2010, Model Code 2010, First Complete Draft, Vol. 1 and 2, ISBN 978-2-88394-095-3/6, Federal Institute of Technology, Lausanne, Switzerland. Han, A.L., 2013. Modeling the stiffness properties of the aggregate-to-mortar interfacial transition zone. Ph.D Dissertation, PhD Program Civil Engineering, Faculty of Engineering, Diponegoro University, Semarang, Indonesia. Hidayat, A., Purwanto, Puspowadojo, J., Aziz, F.A. 2015. The influence of graded concrete strength on concrete element, In: Pro Eng, The 5th International Conference of Euro Asia Civil Engineering Forum (EACEF-5), unpublished.
40
Hutton, D.V. 2004. Fundamentals of finite element analysis, 1st edition, New York: MacGraw-Hill. Jha, D.K., Kant, T., Singh, R.K., 2013. A critical review of recent research on functionally graded plates. Compos. Struct. 96, 833-849. Julianda, I. 2009. Pengaruh Limbah Granit sebagai Agregat Kasar Beton terhadap Kuat Tekan Beton, Undergraduate Thesis, Universitas Pendidikan Indonesia. Kapuria, S., Patni, M., Yasin, M. Y., 2014. A quadrilateral shallow shell element based on the third-order theory for functionally graded plates and shells and the inaccuracy of rule of mixture. European Journal of Mechanics A/Solids 49, 268-282. Kashtalyan, M., 2004. Three-dimensional elasticity solution for bending of functionally graded rectangular plates. Eur. J. Mech. A Solids 23, 853-864. Kieback, B., Neubrand, A., Riedel, H., 2003. Processing techniques for functionally graded materials. Mater. Sci. Eng. 362, 81-106. Kotsovos, M. D. and Pavlović, M. N., 1995. Structural concrete: finite-element analysis for limit-state design. Thomas Telford, London, ISBN: 0-71772027-9. Krause, M., Hausherr, J. M., Burgeth, B., Herrmann, C., Krenkel., 2010. Determination of the fibre orientation in composites using the structure tensor and local X-ray transform. J Mater Sci 45, 888–896. Li, Y., LeBoeuf, E.J., Basu, P.K., Mahadevan, S., 2005. Stochastic Modeling Of The Permeability Of Randomly Generated Porous Media. Advances in Water Resources, Vol. 28 No. 8. 835-844. Loy, C.T., Lam, K.Y., Reddy, J.N., 1999. Vibration of functionally graded cylindrical shells. Int. J. Mech. Sci. 41, 309-324.
41
Mantari, J.L., Soares, C.G., 2013. A novel higher-order shear deformation theory with stretching effect for functionally graded plates. Composites Part B 45, 268-281. Mastali, M., Abdollahnejad, Z., Ghasemi Naghibdehi, M., K. Sharbatdar, M., 2014. Numerical evaluations of functionally graded rc slabs. Hindawi Publishing Corporation, Chinese Journal of Engineering, Volume 2014, 20 pages. Miedzińska, Danuta., Niezgoda, Tadeusz., 2012. Numerical homogenization of structurally graded materials for high strain rate application. Proceeding of PACAM XII. 12th Pan-American Congress of Applied Mechanics January 02-06. Port of Spain, Trinidad. Neville, A., 2003. Properties of Concrete, Fourth Edition. Prentice Hall, New Jersey. Oktem, A.S., Mantari, J.L., Soares, C.G., 2012. Static response of functionally graded plates and doubly-curved shells based on a higher order shear deformation theory. Eur. J. Mech. A Solids 36, 163-172. Pendhari, S.S., Kant, T., Desai, Y.M., Subbaiah, C.V., 2012. Static solutions for functionally graded simply supported plates. Int. J. Mech. Mater. Des. 8, 5169. Pradhana, S.C., Loya, C.T., Lama, K.Y., Reddy, J.N., 2000. Vibration characteristics of functionally graded cylindrical shells under various boundary conditions. Appl. Acoust. 61, 111-129. Purwanto, 1994. Mix Design DOE dan ACI, Pilar Edisi III Tahun II, 26-30. Qu, Y., Long, X., Yuan, G., Meng, G., 2013. A unified formulation for vibration analysis of functionally graded shells of revolution with arbitrary boundary conditions. Composites Part B 50, 381-402. Ramm, E. 1981. Strategies for tracing the nonlinear response near limit points. In: Wunderlich W, Stein E, Bathe KJ, editors, Nonlinear finite element analysis in structural mechanics, Springer-Verlag. p. 63–89.
42
Ramu, I., Mohanty, S. C., 2014. Modal analysis of functionally graded material plates using finite element method. Procedia Materials Science 6, 460-467. Reiter T., Dvorak G., Tvergaard, V., 1997. Micromechanical models for graded composite materials. J. Mech. Phys. Solids 45 [8], 1282-1302. Rhee, R. S. 2007. Multi-scale modeling of functionally graded materials (FGMs) using finite element methods. Dissertation : Faculty of the Graduate School University of Southern California. Riks, E. 1979. An incrememtal approach to the solution of snapping and buckling problems. Int J of Solids and Struct15(7):524–551. Roesler, J., Paulino, G., Gaedicke, C., Bordelon, A.,., Park, K., 2008. Fracture Behavior of Functionally Graded Concrete Materials for Rigid Pavements. Transportation Research Record: Journal of the Transportation Research Board No. 2037, Transportation Research Board of the National Academies, Washington D. C., 40-49. Roesler, J., Bordelon, A., Gaedicke, C., Park, K., Paulino, G., 2008. Fracture Behavior and Properties of Functionally Graded Fiber-Reinforced Concrete. CP973 Multiscale and Fuctionally Graded Material, 513-518. Sburlati, R., 2014. Three-dimensional analysis of functionally graded multi-layered systems. Procedia Engineering 88 (2014), 235-241. Schweizerhof K, Wriggers P. 1986. Consistent linearization for path following methods in nonlinear FE-analysis. Comput Methods in Appl Mech and Eng 59(1):261–279. Shen, B., Hubler, M., Paulino, G. H., Struble, L. J., 2008. Functionally-graded fiber-reinforced cement composite: Processing, microstructure, and properties. Cement and Composites 30, 663-673. Shin, S. K., Kim, J. J. H., Lim, Y. M., 2007. Investigation of the strengthening effect of DFRCC applied to plain concrete beams. Cement & Concrete Composites 29 , 465–473.
43
Sills, L., Eliasi, R., Berlin, Y., 2002. Modeling of functionally graded materials in dynamic analysis. Composites: Part B, Vol. 33. 7–15. Silva, E. C. N., Walters, M. C., Paulino, G. H., 2006. Modelling bamboo as a functionally graded material: lessons for the analysis of affordable materials. Journal of Materials Science 41 (21), 6991 – 7004. Silva, E. C. N., Walters, M. C., Paulino, G. H., 2008. Modelling bamboo as a functionally graded material. AIP Conference Proceedings 973 (1): 754759. Singha, M.K., Prakash, T., Ganapathi, M., 2011. Finite element analysis of functionally graded plates under transverse load, Finite Elements in Analysis and Design 47, 453–460. SNI 03-2834-1993. Tata cara pembuatan rencana campuran beton normal. Pusjatan – Balitbang Pekerjaan Umum. Sofiyev, A.H., 2003. Dynamic buckling of functionally graded cylindrical thin shells under non-periodic impulsive loading. Acta Mech. 165, 151-163. Sofiyev, A.H., Kuruoglu, N., 2014. Buckling and vibration of shear deformable functionally graded orthotropic cylindrical shells under external pressures. Thin-Walled Struct. 78, 121-130. Suresh, S., 2001. Graded materials for resistance to contact deformation and damage. Science 292, 2447-2451. Szafran, M., Rokicki, G., Lipiec, W., Konopka, K.., Kurzydłowski, K., 2005. Investigation of elastomer structure and adhesion effect on compression strength of ceramic-elastomer composites, kompozyty (composites), Vol. 2, No. 5, 41-46. Szymczyk, W., Włodarczyk, J., 2007. Influence of chosen microstructure features on residual stresses distribution in fgm surface coating system with the use of fem micromechanical random models. Journal of KONES, Vol. 14 No. 2. 485-492.
44
Thai, H.T., Kim, S.E., 2013. A simple quasi-3D sinusoidal shear deformation theory for functionally graded plates. Compos. Struct. 99, 172-180. Tornabene, F., Viola, E., 2013. Static analysis of functionally graded doubly-curved shells and panels of revolution. Meccanica 48, 901-930. Vaghefi, R., Baradaran, G.H., Koohkan, H., 2010. Three-dimensional static analysis of thick functionally graded plates by using meshless local PetrovGalerkin (MLPG) method. Eng. Anal. Bound. Elem. 34, 564-573. van Vliet, M.R.A., van Mier, J.G.M. 1995. Softening behaviour of concrete under uniaxial compression, In: Whittmann, FH, editor. Proc FRAMCOS-2. Freiburg: AEDIFICATTIO Publishers, p. 383-386. Vonk, L. 1992. Softening of concrete loaded in compression. PhD dissertation, The Netherlands: Eindhoven University of Technology. Vemaganti, K., Deshmukh, P., 2006. An adaptive global–local approach to modeling functionally graded materials. Computer Methods in Applied Mechanics and Engineering, Vol. 195, No. 36. 4230-4243. Wen, P.H., Sladek, J., Sladek, V., 2011. Three-dimensional analysis of functionally graded plates. Int. J. Numer. Methods Eng. 87, 923-942. Xu, Y., Zhou, D., 2009. Three-dimensional elasticity solution of functionally graded rectangular plates with variable thickness. Compos. Struct. 91, 5665. Yang, B., Ding, H.J., Chen, W.Q., 2012. Elasticity solutions for functionally graded rectangular plates with two opposite edges simply supported. Appl. Math. Model. 36, 488-503. Zuiker, J. R., 1995. Functionally graded materials: choice of micromechanics model and limitations in property variation. Composite Eng., 5, 807–819.
45
MATERIAL AND CONSTRUCTION LABORATORY DEPARTMENT OF CIVIL ENGINEERING DIPONEGORO UNIVERSITY TELP (024) 76480727 FAX (024) 76480727 APPENDIX A1
f'c
=
20 MPa
CONCRETE MIX PROPORTION 361.4
# Proposed Concrete Strength # Standard Deviation # Max. Water Cement Ratio
= = =
20.00 3.50 0.60
MPa MPa
# Min. Cement Proportion # Slump Range # Density of Sand in SSD # Density of Coarse Aggr. in SSD # Water Content of Sand in SSD # Water Content of Coarse Aggr. in SSD # Water Content of Sand in Dry Cond. # Water Content of Coarse Aggr. in Dry Cond. # Density of Cement # Density of Dried Sand # Density of Dried Coarse Aggr.
= = = = = = = = = = =
325.00 60-180 2.67 2.66 0.88 1.21 0.03 0.30 1.49 1.38 1.36
kg/m3 mm
30
% % % % kg/dm^3 kg/dm^3 kg/dm^3
Procedures : 1). Calculate mean concrete compressive strength ( sbm ) Mean concrete compressive strength ( sbm ) Mean concrete compressive strength ( sbm )
=
20
+
1.64
*
3.5
=
25.74 MPa
2). Determine water cement factor : Water cement factor is determined by using Graph 2 Regarding the data on Graph 2 is then obtained thus it is decided to use
fas : fas :
= 0.625 = 0.600
f a s max. =
37 MPa
0.6
3). Calculate the percentage of cement in the mixture : The estimated amount of mixing water of the mixture is written in Table 3. Max. Coarse Aggr. Size = 200 Slump = 60.00 - 180 Amount of mixing water = 225.00 - 250
mm mm liter
was then corrected : 2/3 x
225.00
+ 1/3 x
Percentage of cement was calcuated by : Cement
250
=
water / wcf = water / wcf
Amount of mixing water
= 233.3333 =
0.600
/ *
233.3333
liter/m3
388.8889
kg/m3
0.60 388.89
=
388.89
kg/m3
=
388.89
kg/m3
=
233.33
kg/m3
4). Combination between Coarse Aggr. and Fine Aggr. :
Percentage of Fine Aggr. Percentage of Coarse Aggr.
= =
Density of Sand in SSD Density of Coarse Aggr. in SSD
= =
Density of Combined Aggr. in SSD
=(
0.45 X 2.67
45 % 55 % 2.67 2.66 )+(
0.55 X
2.66
)=
2.67
5). Calculate the density of fresh concrete mix
Density of Combined Aggr. in SSD Amount of mixing water
= =
2.67 233.33
Density of fresh concrete mix could be estimated by using Graph III 2343.75
kg/m3
233.33 =
1721.53
kg
=
So, the amount of each material could be attained : =
2343.75 -
388.89 -
Fine Aggr.
=(
45.00 / 100
)x
1,721.53 =
774.69
kg
Coarse Aggr.
=(
55.00 / 100
)x
1,721.53 =
946.84
kg
= 0.88 % = 0.03 % 0.03 - 0.88 =
-0.85 %
6). Correction for water content and absorbsion Fine Aggr. # Absorbtion in SSD condition # Water content Correction Amount of fine aggr. (corrected)
=
774.69 +(
-0.85 / 100
)x
(kekurangan Air) 774.6875 =
768.10 kg
Coarse Aggr. # Absorbtion in SSD condition # Water content Correction
= 1.21 % = 0.30 % 0.30 - 1.21 =
-0.91 %
(Lack of water)
Amount of coarse aggr. (corrected)
=
946.84 +(
-0.91 / 100
)x
946.8403 =
938.22 kg
Amount of mixing water (corrected)
=
233.33 -( -(
-0.85 / 100 -0.91 / 100
)x )x
774.6875 946.8403 =
248.53 kg
7). Required material for 1 m3 concrete mix Water Cement Fine Aggr. Coarse Aggr.
248.53 388.89 768.10 938.22
kg kg kg kg
= = = =
Ratio in weight Cement : Fine Aggr. : Coarse Aggr. : Water
248.5 388.9 768.1 938.2
kg kg kg kg
1.00
:
1.98
:
2.41
:
0.64
7). Required material for 1 m3 concrete mix Water
388.89 /
1.49
=
261.00 dm3
(liter)
Cement
768.10 /
1.38
=
556.53 dm3
(liter)
Fine Aggr.
938.22 /
1.36
=
691.71 dm3
(liter)
Coarse Aggr.
248.53 /
1.00
=
248.53 dm3
(liter)
1.00
:
Ratio in volume Cement : Fine Aggr. : Coarse Aggr. : Water
2.13
:
2.65
:
0.95
MATERIAL AND CONSTRUCTION LABORATORY DEPARTMENT OF CIVIL ENGINEERING DIPONEGORO UNIVERSITY
TELP (024) 76480727 FAX (024) 76480727 APPENDIX A2
f'c
=
60 MPa
CONCRETE MIX PROPORTION 361.4
# Proposed Concrete Strength # Standard Deviation # Max. Water Cement Ratio
= = =
60.00 3.50 0.60
MPa MPa
# Min. Cement Proportion # Slump Range # Density of Sand in SSD # Density of Coarse Aggr. in SSD # Water Content of Sand in SSD # Water Content of Coarse Aggr. in SSD # Water Content of Sand in Dry Cond. # Water Content of Coarse Aggr. in Dry Cond. # Density of Cement # Density of Dried Sand # Density of Dried Coarse Aggr.
= = = = = = = = = = =
325.00 30-60 2.67 2.66 0.88 1.21 0.03 0.30 1.49 1.38 1.36
kg/m3 mm
30
% % % % kg/dm^3 kg/dm^3 kg/dm^3
Procedures : 1). Calculate mean concrete compressive strength ( sbm ) Mean concrete compressive strength ( sbm ) Mean concrete compressive strength ( sbm )
= f'c + 1,64 * s = 60 + 1.64
*
3.5
=
65.74 MPa
2). Determine water cement factor : Water cement factor is determined by using Graph 2 Regarding the data on Graph 2 is then obtained thus it is decided to use
wcf : wcf :
= 0.300 = 0.300
max. wcf :
0.6
3). Calculate the percentage of cement in the mixture : The estimated amount of mixing water of the mixture is written in Table 3. Max. Coarse Aggr. Size = 10 Slump = 30.00 # 60 Amount of mixing water = 205.00 - 230
mm mm liter
was then corrected : 2/3 x
205.00
+ 1/3 x
Percentage of cement was calcuated by : Cement
230
=
water / wcf = water / wcf
Amount of mixing water
= 213.3333 / =
0.300
*
213.3333
liter/m3
711.1111
kg/m3
0.30 711.11
=
711.11
kg/m3
=
711.11
kg/m3
=
213.33
kg/m3
4). Combination between Coarse Aggr. and Fine Aggr. :
Percentage of Fine Aggr. Percentage of Coarse Aggr.
= =
Density of Sand in SSD Density of Coarse Aggr. in SSD
= =
Density of Combined Aggr. in SSD
=(
0.45 X 2.67
45 % 55 % 2.67 2.66 )+(
0.55 X
2.66
)=
2.67
5). Calculate the density of fresh concrete mix
Density of Combined Aggr. in SSD Amount of mixing water
= =
2.67 213.33
Density of fresh concrete mix could be estimated by using Graph III =
So, the amount of each material could be attained :
=
2368.75 -
711.11 -
3
2368.75
kg/m
213.33 =
1444.31
kg
Fine Aggr.
=(
45.00 / 100
)x
1,444.31 =
649.94
kg
Coarse Aggr.
=(
55.00 / 100
)x
1,444.31 =
794.37
kg
= 0.88 % = 0.03 % 0.03 - 0.88 =
-0.85 %
6). Correction for water content and absorbsion Fine Aggr. # Absorbtion in SSD condition # Water content Correction Amount of fine aggr. (corrected)
=
649.94 +(
-0.85 / 100
)x
(Lack of water) 649.9375 =
644.41 kg
Coarse Aggr. # Absorbtion in SSD condition # Water content Koreksi :
= 1.21 % = 0.30 % 0.30 - 1.21 =
-0.91 %
(kekurangan Air)
Amount of coarse aggr. (corrected)
=
794.37 +(
-0.91 / 100
)x
794.3681 =
787.14 kg
Amount of mixing water (corrected)
=
213.33 -( -(
-0.85 / 100 -0.91 / 100
)x )x
649.9375 794.3681 =
226.09 kg
7). Required material for 1 m3 concrete mix Water Cement Fine Aggr. Coarse Aggr.
226.09 711.11 644.41 787.14
kg kg kg kg
= = = =
Ratio in weight Cement : Fine Aggr. : Coarse Aggr. : Water
226.1 711.1 644.4 787.1
kg kg kg kg
1.00
:
0.91
:
1.11
:
0.32
7). Required material for 1 m3 concrete mix Water
711.11 /
1.49
=
477.26 dm3
(liter)
Cement
644.41 /
1.38
=
466.91 dm3
(liter)
Fine Aggr.
787.14 /
1.36
=
580.32 dm3
(liter)
Coarse Aggr.
226.09 /
1.00
=
226.09 dm3
(liter)
1.00
:
Ratio in volume Cement : Fine Aggr. : Coarse Aggr. : Water
0.98
:
1.22
:
0.47
APPENDIX B : Laboratory Works
Figure 1. Preparation for concrete casting
Figure 4. Concrete mixing
Figure 2. Perforated steel plate used for compacting the graded concrete specimen
Figure 5. 60 MPa concrete mixture
Figure 3. Tamping rod made from screw and adjusted by nut to provide certain depth during compaction
Figure 6. 20 MPa concrete mixture
Figure 7. Compacting graded concrete specimen by using manual tamping method
Figure 10. Submerging the specimens in water pond for concrete curing
Figure 8. Tapping the outsides of mold lightly with mallet to reduce the air pocket within the casted concrete specimen
Figure 11. Initial condition of graded concrete specimen before uniaxial compression loading
Figure 9. Store the casted specimens on rigid surface and free from vibration
Figure 12. Fracture pattern on graded concrete specimens after uniaxial compression loading
APPENDIX C : List of Equipment Table 1. List of Equipment No.
Description
1
Data Logger
2
Load Cell
3
Linear Variable Displacement Transducer (LVDT)
4
Strain Gauge
5
Magnetic Base
6 7 8
Power Supply Unit Personal Computer Universal Testing Machine
Brand Tokyo Sokki Kenkyujo Co., Ltd. Tokyo Sokki Kenkyujo Co., Ltd. Tokyo Sokki Kenkyujo Co., Ltd. Tokyo Sokki Kenkyujo Co., Ltd. Mitutoyo Corporation Japan ICA Toshiba Hung Ta
9
Concrete Mixer
Tiger
10 11 12
Cylindrical Concrete Mold Perforated Thin Plate Tamping Rod
Tatonas (Customed) (Customed)
Type TDS-303 CLC-1000KNA CDP-5MT PFL-30-11-3LT Code No. 7010S CT682B Satellite L745 HT-8391PC Capasity : 350 liter Ø100 x 200 mm
APPENDIX D : The Weight of Specimen (Preliminary Test) Table 2. The Comparison of Weight of the Specimen Type of Specimen P60 G P20
A 3930 3810 3710
Weight (grams) B 3970 3800 3690
C 3920 3840 3680
APPENDIX E : Finite Element Modeling
Figure 1. Modeling graded concrete specimen as axisymmetric model
Figure 2. Load and freedom cases – primary load cases
Figure 3. Load and freedom cases – freedom cases
Figure 4. Node attributes
Figure 5. Plate attributes
Figure 6. Stress vs strain table
Figure 7. Plate element property - Structural
Figure 8. Plate element property - Nonlinear
Figure 9. Nonlinear static analysis - Start
Figure 10. Nonlinear static analysis – Start – Load increment
Figure 11. Nonlinear static analysis – Default – Sub-steps
Figure 12. Result of the analysis
Figure 13. Results settings