An eye-tracking methodology for characterizing program comprehension processes Markku Tukiainen† Department of Computer Science University of Joensuu PO Box 111, FI-80101, Finland
Roman Bednarik∗ Department of Computer Science University of Joensuu PO Box 111, FI-80101, Finland
Abstract
ing, especially by means of visual representations of program execution, e.g. [Moreno et al. 2004; Sajaniemi and Kuittinen 2003]. Surprisingly, given the importance of identifying the cognitive processes involved in program comprehension, little has been done by applying visual attention tracking systems such as eye-movement tracking. Instead, investigations have been mostly based on verbalprotocols, a well established - and probably the most popular method used to capture the thought-processing.
Program comprehension processes have previously been studied using methodologies such as think-aloud or comprehension summary analysis. Eye-tracking, however, has not been previously widely applied to studies of behavioral aspects of programming. We present a study in which program comprehension was investigated with a help of a remote eye-tracker. Novice and intermediate programmers used a program visualization tool to aid their comprehension while the location of fixations, fixation durations and attention switching between the areas of interest were recorded.
To safely apply eye-movement tracking to study the behavioral aspects of programming, however, requires to develop a methodological framework. This study starts to build such a framework. As eye-tracking has not been previously applied in the domains of program comprehension and visualization, despite clearly presenting a strong potential, our motivation is to create a methodological framework that would allow to apply the eye-tracking and provide a way to analyze the data. An obvious solution to the latter problem would be to use some variation of repeated measures designs and analysis. However, as seen from previous studies (e.g. [Bednarik et al. 2005]), treating the data as average values over a longer period without considering the actual underlying task- might blur individual differences in between-participant and within-participant trials. In addition, the comprehension process with program visualization is dynamic and gradual in its nature and cannot be effectively examined by studying long-term averages.
In this paper 1) we propose an approach how to investigate trends in repeated-measures sparse-data of few cases captured by an eyetracker and 2) using this technique, we characterize the development of program comprehension strategies during dynamic program visualization with help of eye-movement data. CR Categories: H.5.2 [Information Interfaces and Presentation]: User Interfaces Evaluation/methodology—Input devices and strategies; Keywords: eye-movement tracking methodology, psychology of programming, program comprehension, program visualization
1
In this paper, we apply eye-movement tracking to a study of comprehension processes of programmers using a program visualization tool. To allow for as natural conditions as possible, the participants were not limited in the ways they used and interacted with the tool, particularly in replaying the visualizations. Therefore, although designed as a repeated-measures experiment, the resulting data have often a sparse structure. We present an approach to analyze the data and apply the method to characterize the strategies and behavior of programmers to coordinate multiple representations of a program during program comprehension.
Introduction
Program comprehension, the ability to understand programs written by others, is widely recognized as central to programming. Being also a cognitively complex skill of acquiring mental models of structure and function of a program, program comprehension has been for many years a field of need to develop and apply methods and techniques to effectively capture and analyze the involved mental processes. Although originally centered around (professional) computer-programmers developing computer programs, studies of programming strategies nowadays extend far beyond these borders [Blackwell 2002], both in terms of users and application domains.
2
Previous research in the domain has established a solid body of knowledge about the comprehension models and strategies employed in comprehension, expert and novice differences or comprehension outcome analysis [Good and Brna 2004]. Other studies concentrated on developing tools to aid program understand-
2.1
Related Work Capturing Mental Processing during Programming
Studies of cognitive processes involved in program comprehension tasks are central to our understanding of software maintenance and development [von Mayrhauser and Vans 1996]. Particularly popular techniques to capture the thought-processes are different variations and derivations of the think-aloud methodology, either concurrent or retrospective, since the seminal work of Ericsson and Simon [1984]. In the empirical studies of programmers and psychology of programming, the think-aloud methodology was applied in the pioneering experiments conducted by Soloway and others during 1980’s and 1990’s (e.g. [Letovsky 1986; Soloway et al. 1988; Littman et al. 1986; von Mayrhauser and Vans 1996] or recently
∗ e-mail:
[email protected] † e-mail:
[email protected] Copyright © 2006 by the Association for Computing Machinery, Inc. Permission to make digital or hard copies of part or all of this work for personal or classroom use is granted without fee provided that copies are not made or distributed for commercial advantage and that copies bear this notice and the full citation on the first page. Copyrights for components of this work owned by others than ACM must be honored. Abstracting with credit is permitted. To copy otherwise, to republish, to post on servers, or to redistribute to lists, requires prior specific permission and/or a fee. Request permissions from Permissions Dept, ACM Inc., fax +1 (212) 869-0481 or e-mail
[email protected]. ETRA 2006, San Diego, California, 27–29 March 2006. © 2006 ACM 1-59593-305-0/06/0003 $5.00
125
during its animation, patterns of novice and expert programmers did not differ. An effect of experience was found, however, on overall strategies adopted to comprehend programs and on fixation durations.
[Burkhardt et al. 2002; Ko and Uttl 2003] and many others). By analyzing verbal protocols, these and other studies attempted to get an access to cognitive processes and provide insights into what strategies programmers of various expertise take while undergoing the tasks of program comprehension.
Bednarik et al. [2005], however, approached the analysis of eyemovement data only from a long-term, global point of view: the data were treated as means over a whole comprehension session. To characterize the comprehension processes more completely, another, more detailed procedure has to be taken. In the present paper, we subdivide the comprehension process aided by a program visualization into meaningful pieces and study gradual changes in the related eye-movement patterns. By doing so, we believe to capture the changes in the role each of the representations take during the comprehension and to characterize the construction of the mental model of the comprehended program.
To increase the validity of verbal reports, research practitioners often complement them with other concurrent behavioral data, such as direct observations, video or interaction protocols, as for example [von Mayrhauser and Vans 1996] or [Ko and Uttl 2003]. The approaches based on verbal reports, however, have been criticized widely, e.g. [Branch 2000; Nielsen et al. 2002; van den Haak et al. 2003], especially when used with complex tasks involving high cognitive load and requiring verbalizing visual information.
2.2
Previous Studies Using Visual Attention Tracking
3 Normally, programmers work within a computer-based (graphical) environments, such as program debugging or visualization tools. These environments often present some of the program representations in several adjacent windows and programmers have to coordinate these representations in order to construct a viable mental model. In these situations, when the problem-solving and formation of mental model is driven by visual information, such as during dynamic program visualization, it would be beneficial to capture and analyze the patterns of visual attention. As eye-movement data provide insight into attention allocation, it is also possible to infer underlying cognitive processes [Rayner 1998].
Experiment
The present experiment was conducted to discover whether there is any development in the way programmers visually attend the representations provided by a program visualization tool during program comprehension. In particular, we were interested in whether the role of different representations of a program changes in the course of time, as reflected in the gaze data. Ratios of fixation counts, attention switching, and fixation durations between the main representations of a program were analyzed. Since the present analysis reports the data recorded from an experiment previously described and reported elsewhere, the following sections might share some parts with the previous reports [Bednarik et al. 2006; Bednarik et al. 2005].
Understanding that opportunity, Romero et al. [2002] conducted a series of experiments that involved the Restricted Focus Viewer (RFV) [Jansen et al. 2003], a tool that links visual attention to a small fully-focused spot within an otherwise blurred stimulus. When an experimenter employs the RFV to track the visual attention, participants move the focused spot using a computer mouse to explore the visual representations in task. This approach, however, was shown to be questionable. Using a remote eye-tracker, Bednarik and Tukiainen [2004; 2005] replicated one of the experiments in which the RFV was employed. They suggested that the technique interferes with natural strategies involved in program debugging. Similarly as in the influential studies of Petre [1995], the visual representations in experiments of Romero et al. were static. Modern program visualization tools, however, often present the concepts in form of dynamic animations. The ecological validity of these experiments could be, therefore, questioned too.
3.1
Participants
A total of eighteen participants were recruited from high-school students attending a university level programming course, undergraduate and graduate computer science students from the local university; each received a lunch ticket as an incentive. Data from two participants had to be discarded due to technical problems with eye-tracking. Therefore the eye-tracking results are based on data collected from 16 subjects (13 male, 3 female). The participants, according to their report, can be characterized as having, on average, 49.3 (SD = 54.1) months of experience with programming, 13.1 (SD = 12.8) months of experience with Java, 19.3 (SD = 29.5) months of experience with other programming language. Five participants had a previous experience with the program visualization tool used in this experiment, other two participants had a previous industrial experience. All participants had normal or corrected-tonormal vision, according to their own report.
Eye-tracking as a research methodology in studies of programmers has been previously applied to investigate how programmers read the code [Crosby and Stelovsky 1990]. Using an eye-tracker, patterns of programmers’ visual attention were recorded while reading a binary search algorithm written in Pascal. Authors analyzed fixation times and number of fixations to reveal the strategies involved in reading source code. Crosby and Stelovsky shown, beside other findings, that while the subjects with greater experience paid attention to meaningful areas of source code and to complex statements, novice participants, on the other hand, visually attended comments and comparisons. Both groups paid least attention to the keywords and did not exhibit any difference in reading strategies.
For some parts of the analysis, participants were divided into two groups according to the number of animation runs they initiated during the experiment. The number of animation runs can be considered as a measure of experience and comprehension performance: those who animated the program once did not need the support of the visualization tool further but to confirm their hypothesis, while those running the visualization more times were in need of its help.
Other studies using eye-movement tracking during program comprehension or debugging, such the one of Crosby and Stelovsky above, are infrequent and appeared only recently, e.g. [Bednarik and Tukiainen 2004; Bednarik and Tukiainen 2005; Nevalainen and Sajaniemi 2005]. Bednarik et al. [2006; 2005] reported that in terms of fixation counts and attention switching between main representations (code and graphical representation of execution) of a program
3.2
Materials
Three short Java programs, a factorial computation, recursive binary-search program and na¨ıve string matching, were presented
126
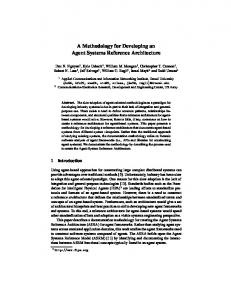
the Jeliot 3 interface were defined: the code, the expression evaluation area, the method area, the instances area, the constants, the control, and the output area.
to the participants. The lengths of the programs (in lines of code) were 15, 34, and 38, respectively. Each of the programs generated only one line of output and did not require any user input. To make recognition of a program based on these surface features difficult, the names of the methods and variables were altered. In practice, method and variable names were made random and neural. To visualize the Java programs, Jeliot 3 [Moreno et al. 2004], a novice-oriented program visualization tool, was used. The user interface of Jeliot 3 (Figure 1) consists of four separate areas: the Code is on the top left, the visualization is shown in the top right area (called Theater), the Control panel with VCR-like buttons to control the animation is on the bottom left, and the Output of the program is displayed in the bottom right panel. Moreover, the Theater area is further split into four discrete sections that detail a) the method calls, b) expression evaluation, c) constants and static objects, and d) instantiation of objects and arrays. In the present experiment, the specialized views of method-call-tree and history of execution provided by regular Jeliot 3 were disabled. Jeliot 3 automatically visualizes execution of Java programs by demonstrating graphically the data and control flows, using an object-oriented approach. In a typical session, a user loads or write a program, compiles it and then selects Play or Step button to start the animation in a continuous or step-wise fashion, respectively. An animation step consists of highlighting a block of instructions, statement, assignment or expression in the Code and displaying their respective graphical visualization in the Theater area.
Figure 2: Experimental settings.
3.4
Procedure and Design
The experiment was conducted in a quiet usability laboratory. After becoming acquainted with the experiment and signing a consent form, participants were seated in an ordinary office chair near the experimenter and facing a 17” TFT display (resolution of 1024x768). Every participant then passed an automatic eyetracking calibration. The calibration required the participants to follow sixteen shrinking points that appeared one by one across the display. If needed, the calibration was repeated in order to achieve the highest possible accuracy. The window with program visualization tool was resized to occupy full-screen. Participants performed three sessions, each consisting of a comprehension phase using Jeliot 3 and a program summary writing phase. The target programs contained no errors, were always preloaded into Jeliot and compiled to demonstrate the absence of errors. Participants were instructed to comprehend the program as well as possible, and they could interact with Jeliot as they found necessary. The duration of a session was not limited and participants were told about it. Figure 1: Program visualization tool used in the experiment with a representative scan-path superimposed.
3.3
The first target program was a factorial computation that was used as a warm-up and the resulting data were discarded. The order of the two actual comprehension tasks was randomized so that half of the participants started with the recursive binary search and other half with na¨ıve string matching.
Apparatus
As one of our requirements was to use a minimally invasive experimental setting, we used the remote Tobii ET-1750 (sampling at 50Hz) eye tracker that made no contact with participants (for setting see Figure 2). We used a single computer setup, in which operator’s and participant’s displays share same computer. The eye tracker is built into a TFT panel so no moving part is visible and no sound can be heard during recording. Interaction protocols (such as keystrokes and mouse clicks) were collected for all target programs, and audio and video streams were recorded for a whole session. To avoid involuntary fixations, a minimal duration of fixation for the algorithm processing the eye-data was set at 100ms. Seven static areas of interest (AOI) that matched with the seven main panels in
4
Data Analysis Methodology
In the present experiment, the participants were not limited in the ways they used and interacted with the visualization tool nor in the time they needed to spend on the comprehension. Some of the participants performed only one animation run, while others, in order to comprehend the program as best as they could, needed the help of the dynamic animation more. Since we are interested in commonalities during the comprehension process and to allow for a fair comparison, the whole stream of eye-movement data for a single participant was segmented into the sections where the animation
127
Participant A B C D E
was on and off. The results are therefore in a form of sparse matrix (see a hypothetical example in Table 1 below), depending on the number of animation runs (the columns marked Run 1 ... 4) each participant performed. The columns then contain a measurement obtained during first, second, and following animations of a program. Let’s consider now the situation in which a participant C (Table 1, for fixation count ration between two areas of interest) used the visualization tool to animate the program execution four times, while participant D only two times. Not only the analysis of variance would suffer from a low degree of freedom as the number of animation runs decreases, but potentially, such an approach would align two measures (e.g. in column Run 2) that reflect different cognitive tasks. While participant C was, supposedly, still attempting to create a hypothesis of the visualized problem, the participant D was most probably confirming the hypothesis she created during the Run 1. Therefore, a research question whether the ratio of fixations between two areas is different during Run 1 and Run 2, so that it reflects a shift in the relative importance of the two areas, would be not only ill-defined but also hard to answer using traditional ANOVA. Participant A B C D E
Run 1 1.162 1.170 1.234 2.106 1.953
Run 2
Run 3
Run 4
1.288 1.562 2.670 1.321
1.978 1.619
1.432
1-2 1 1 1 0
1-3 1 1 1
1-4 1 -
2-3 1 1 1
2-4 0 -
3-4 0 -
Table 2: Data from Table 1 in binomial form. the trend was increasing x, 3) setting the probability of null hypothesis to p = .5 since the variable is binary, 4) computing the cumulative probability by using binomial formula (1) for all i = x..N, and 5) finding the mean value and standard deviation of this distribution. N
P(X ≥ x) = ∑ P(X = i) = i=x
N! (p)i (1 − p)(N−i) i!(N − i)!
(1)
Following the example given in Table 2, N = 13, x = 10, p = .5, then P(X≥10) = .0461, with mean value of 6.5 and standard deviation of 1.8. That means, that the probability of getting greater than or equal to 10 increases out of 13 trials, given the probability of having no trend is .5 (null hypothesis), is .0461. Shall the null hypothesis hold (no trend) the mean number of increases would have to be 6.5 (SD = 1.8). However, as the number of successive increases was 10, we can conclude that we have found an increasing trend with proportion of 10 increases to 3 decreases (76.9%), with an exact probability of getting the same or greater number of increases, assuming the null hypothesis was p = .5, of .0461. Therefore, the null-hypothesis is rejected.
2.342
Table 1: Example of sparse data: ratio of fixation counts on two areas of interest
5
Typically, repeated measures designs are analyzed using analysis of variance (ANOVA) procedures. However, in the situations when the result matrix is sparse, of few cases, and matching up of corresponding trials between participants is not explicit, as found also in the present experiment, the ANOVA is ruled out. We suggest a possible solution to this problem by reframing the data set as binomial trials and using nonparametric statistical methods to analyze the outcome. This approach allows for answering the research questions related to trends over time and solves the problem with sparse data.
Results
In this paper, we study coordination of multiple program representations during program comprehension. We report results related to the time spent on animating the program execution, rather than reporting mean values for a whole comprehension session. We do so because the task was complex and participants were allowed to select their own strategy. Some of the more experienced participants first did not use the animation but instead studied the source code only. Therefore, they did not perform any coordination of multiple representations; these were available during animation only. To allow for a fair comparison, we split the whole stream of data into distinct phases of code-reading and animation and analyze the data during animation.
The original data set is considered as whether the scores on successive trials in respect to all previous trials of a participant were higher (an observed increase) or lower (a decrease). While reframing the original data into binomial trials, the research hypothesis needs to be also restated. The claims of null-hypothesis and alternative hypotheses are then stated as:
A detailed analysis of comprehension summaries and interaction patterns is reported and discussed in [Bednarik et al. 2006]. The effects of experience levels on gaze patterns during program comprehension have been reported in [Bednarik et al. 2005].
• H0: ”There is no trend in the trials and same number of increases and decreases will occur.”
We analyzed several measures related to the gaze behavior. First, a ratio between the code and visualization in terms of total fixation times was measured. This ratio shall reveal the importance of the two representations during the comprehension process. Next, the number of attention switches per minute between any of the areas of interest shall reflect the dynamics of attention allocation. Finally, we analyzed fixation durations in overall, on the code representation of the program and on graphical visualizations. Fixation durations are believed to reflect relative importance and complexity of information during problem-solving[Just and Carpenter 1976]. The longer the durations are, the more mental efforts a participant has to exert.
• HA: ”There is a trend in the trials and the number of increases and decreases will differ significantly.” Table 2 shows the result of applying such a transformation from original data contained in Table 1. For example of the Participant E, the first ”0” represents no increase in the measurement between Run 1 and Run2, while the consecutive ”1” signals an increase in the measurement between Run 1 and Run 3. As for participant A who performed only one Run, no trend it the measurement could be analyzed. Having the original problem reframed into binomial distribution, the statistical analysis of the newly formed data consists of: 1) counting the total number of trials N, 2) counting the cases in which
Although being an important representation during program comprehension, the output area of Jeliot interface was excluded from
128
the analysis due to the low amount of output of the programs. Since the purpose of this experiment was to explore how the roles of different representations of a program develop during program comprehension, the control area of Jeliot interface was also excluded, as it does not contain any information about the program being visualized.
on the two main areas of interest during each of the animation runs. Then, for each of the animations a participant initiated, we calculated the ratio of the fixation time spent on code to the time spent fixating the graphical representation. For those participants who animated at least twice, these ratios were then transformed into binomial trials as described in Section 4.
Because of the experimental design, commonly used ANOVA could not be applied for some part of the results. The results were therefore analyzed in part using the method described in section 4, ANOVA and using t-tests for pre-planned comparisons.
The mean ratio of total fixation times on code/visualization of remaining participants that animated the programs only once was 0.86 (SD = 0.5) and 0.65 (SD = 0.32) for recursive binary search and for na¨ıve string-matching, respectively. There was no statistical difference in the mean ratios between the two programs of this group, independent-sample t(8) = 0.77, ns.
5.1
Interaction with the Tool
Twenty-two increasing trials and six decreases were found during the replays of recursive binary search. Therefore, the ratio of fixation time spent on code/visualization had an increasing tendency, p = .0019. Twenty-one increases and 16 decreases were found during the replays of na¨ıve string matching animation. Thus, the ratio of fixation time spent on code/visualization had a slightly increasing trend, p = .26, also in this program.
In overall, the grand mean number of program animation replays was 2.21 (SD = 0.98), with a minimum of no animation, and a maximum of 5. On average, there were 2.06 (SD = 1.2) and 2.25 (SD = 1.2) animations of binary-search program and na¨ıve stringmatching program initiated, respectively. There was no difference in the number of animations between the two target programs, pairwise t(15) = .64, ns. For the recursive binary-search program, five participants animated the program only once and one did not animate at all, while for the naive string matching, six participants replayed the animation only once. Therefore, the analysis of eyemovement patterns in the following subsections is based on data of remaining ten participants that could be considered as binomial trials.
5.4
The dynamics of attention allocation was measured as a number of switches per minute between any of the areas of interest during the animation. We define a switch as any change of the focus of visual attention between any of the pre-defined areas of interest.
Two groups were formed post-hoc from all participants, depending whether a participant animated the programs on average more or less than two times. Table 3 details the distribution of expertise in the resulting groups and resulting statistical differences. Group # ≤2 >2 p
9 7
Replays 1.25 (0.38) 3.21 (0.49) < .001
Progr. 73.5 (69.92) 18.0 (19.4) .014
Java 16.9 (16.4) 7.3 (4.1) .044
Other 29.6 (38.1) 5.1 (4.9) .034
Jeliot 2
Prof. 2
3
0
ns
ns
5.5
Fixation Duration
The interface of the program visualization tool consisted of two main areas of interest, the code and the visualization panel (Theater). Besides for the code as a main representation, we measured fixation durations also for the four discrete areas of the Theater that show certain aspects of the program execution (described in section 3.2).
Animation Replays as Binomial Trials
For the purposes of the eye-movement analysis using binomial distribution, the replays of the animations were transformed into binomial trials. Thus, during the animations of binary-search program, 28 trials were performed. The resulting binomial distribution for null hypothesis (p = 0.5, i.e. no trend with same number of increases and decreases) have a mean of 14 with a standard deviation of 2.65. During the animations of na¨ıve string matching program 37 trials were performed, that formed a binomial distribution with a mean of 18.5 and a standard deviation equal to 3.04.
5.3
Those participants that animated the program execution only once, performed 40.6 (SD = 22.7) and 48.8 (SD = 9.8) attention switches per minute, while comprehending binary-search and string-matching programs, respectively. There was no difference in the number of switches per minute between the programs, independent-sample t(8) = 0.74, ns, of this group. Attention switching behavior of the group that animated program execution more than once can be characterized as 10 increases in the number of switches per minute and 18 decreases, p = .96, in binary-search program, and as 11 increases and 26 decreases, p = .99, in na¨ıve-string matching. Therefore, in both of the target comprehension tasks, the number of attention switches per minute performed by the participants shown a strongly decreasing trend.
Table 3: Characteristics and differences (means, standard deviations in parentheses) of the two groups (≤ 2 animations, > 2 animations) in months (Programming, Java, Other experience), analyzed by one-tailed t-test, and number of participants (Jeliot experience, Professional experience), by χ 2 test.
5.2
Attention Switching Behavior
Mean fixation durations of the group that animated the programs only once (Table 4) were analyzed using ANOVA (program(2) x area (5)); missing values were replaced by the means of the group for that particular area and program. No effect of program on fixation duration was found, F(1,8) = 1.28, ns, together with no interaction with area, F(4,32) = .51, ns. However, there was a major effect of area on fixation duration, F(4,32) = 3.22, p = .025. In both programs, the longest durations were measured on the area containing visualization of expression evaluation, while the shortest durations fell on the area displaying constants.
Fixation Time
Fixation durations of the group that animated the programs more than once were analyzed using the binomial trials (Table 5). Several
To estimate the importance of the available representations, we computed the total fixation time as a sum of all fixation durations
129
Program binary-search string-matching
Code 301.7 (137.4) 273.7 (26.7)
Methods 285.5 (80.6) 249.2 (16.7)
Expressions 387.3 (159.6) 317.9 (93.3)
Instances 293.9 (189.5) 276.6 (13.5)
Constants 249.5 (53.4) 214.2 (32.2)
Overall 312.8 (120.1) 284.3 (38.1)
Table 4: Mean fixation durations and standard deviations (in parentheses) over the main areas of interest and in overall for the group that animated one time. values of the measures, but rather investigate trends in a time. Although the proposed approach provides many advantages in these situations, several limitations can be identified. Most importantly, by converting the data sets to binomial trials the nominal values of original data are not part of the results any more. This makes the results hard to compare to other studies that used parametric methods to analyze their results and reported means of their measures. However, as the resulting probabilities are reported and exact, these can be used for a comparison. Second problem, that will be addressed in future studies, is that the binomial distribution requires all trials to be independent. While this condition holds for betweenparticipant trials, within-participants trials can hardly be considered independent.
general trends can be observed, regardless of the program. Most importantly, the steepest increasing trend is related the fixation durations on the code area. On the other hand, the fixations that fell on the area containing instances of objects and arrays were decreasing with following animation runs. No trends were observed in areas visualizing expression evaluations. Altogether, participant’s fixation durations on the areas of the Theater were decreasing or remained about same while those on the code area, on the other hand, were showing an increasing trend. Finally, the overall fixation duration in both of the programs seemed to stay same during consecutive animations.
6
Discussion 6.3
Unlike many previous studies that involved some variation of thinkaloud protocol to trace the subjects thought processes, we have conducted an exploratory study of program comprehension on unfamiliar code using eye-movement tracking. Our aims were to introduce eye-tracking as a valid source of data about behavioral aspects of programming and to develop an approach to analyze this data. Although the study was designed as a repeated measures, traditional statistical methods for analyzing the data could not be applied. Therefore, we reframed the results and considered the data as binomial trials.
6.1
With the exception of one experienced participant during one program comprehension session, all participants animated the program execution at least once. Mean number of animation runs turned out to be a good indicator of previous programming experience. Those, who on average run the animation at most twice belonged to a more experienced group, especially in terms of general experience in programming. This finding is not surprising and can be explained by at least two reasons. First, although we provided all participants with a short introduction to Jeliot and we tried to equalize the previous experience with the tool by having a warm-up session, most of the experts in our study were not previously familiar with the tool and with the visualization. As it has been argued, to benefit from program visualization, users have to be explicitly taught to use it [BenAri 2001]. Therefore, experts’ low number of animation runs could be explained by their unfamiliarity with the tool. However, the previous experience with Jeliot was balanced between the groups and still those participants in the less experienced group who have animated the program several times were lacking the previous training with the tool.
Eye-movement Data as Binomial Trials
In comparison with other more traditional approaches to statistical analysis of eye-movement data of repeated measures designs, the methodology introduced in this paper provides researchers with a possibility to investigate trends over time. Using average values of collapsed measurements and some methods of analysis of variance might not provide enough information about how strategies of experimental participants develop during problem solving and learning.
Second reason of the low number of animations of experts can stem from a difference in the strategies to comprehend the program using the visualization tool [Bednarik et al. 2006]. According to Brooks [1983], once a hypothesis of the program is formed, the programmer tries to verify it against the program text. In our experiment, more experienced participants read the code first, created a model and hypotheses, and then confirmed their hypotheses by (usually) only one run of the animation.
However, also practical considerations have to be taken into account when applying this approach. First, the valuable data from those participants that performed only one trial are not considered and this dissipates the efforts spent on recruiting the participants. In the present experiment, fortunately, these participants belonged to the group whose behavior was different from the rest of sample population. Second, the reframing of the original data represents an additional step in the analysis. However, the computations do not require any special techniques and, in our opinion, are justified by the possibility to interpret eye-movement data as trends.
6.2
Comprehension process analysis
On the other hand, less experienced programmers did not read the code at the beginning, but instead animated the program several times and let the tool to visually explain the execution. They engaged in doing so, until they have collected enough information to form a hypothesis and then, during the last run, coordinated the representations in the way that favored code more than at the beginning, to confirm their hypotheses.
Limitations of the Data Analysis
The results obtained by capturing and analyzing the eye-movement data can be seen as supporting the discussion above. At the beginning of the comprehension, less experienced participants targeted
The proposed methodology of analyzing sparse data that originated from unequal number of trials in a repeated measure design seems to be practical when the research questions do not concern the exact
130
Program/Trials binary-search/28 string-matching/37
Increases p Increases p
Code 17 0.17 21 0.25
Methods 9 0.98 18 0.63
Expressions 11 0.91 19 0.50
Instances 4 1.0 17 0.74
Constants 12 0.83 20 0.37
Overall 12 0.83 18 0.63
Table 5: Fixation durations over the main areas of interest and in overall, as binomial trials with associated probabilities.
7
their attention toward the visualization of the target program, as indicated by the total fixation time. However, with increasing iterations, the less experienced participants focused more on the code representation.
Eye-movement based analysis can contribute to our understanding of cognitive processes involved in program comprehension, debugging, and visualization. Unlike verbal reports used in numerous previous studies of program comprehension, eye-movement-based analysis does not require any training of experimental participants to verbalize their thoughts neither interferes with their mental processing.
Considering the dynamics of the coordination strategies, participants gradually decreased the attention switches between the code and the visualization, and concentrated on the code representation. In other words, the attention allocation and related eye-movements reflect what information and what representation is relevant to the programmers during the comprehension task. It turned out that at the early phases of comprehension, visualization provides more important information and plays more important role than at the later stages.
This paper demonstrated, that in incorporation with other experimental protocols, eye-tracking data can reveal important information about behavior of computer programmers, that can be hard to access using only a single methodology. Reframing of original repeated-measures eye-movement data as the sets of binomial trials allowed to characterize the development of program comprehension behavior in terms of representation use and coordination.
More experienced programmers exhibited different behavior. During their single animation run, they spent more time focusing on visualization than on the code. Based on the mean fixation durations over the discrete areas of visualization, we believe that the more experienced programmers faced highest difficultness with the expression evaluations, while following the visualization of constants did not introduce similar depth of cognitive processing.
However, as the applications of eye-movement tracking to program comprehension are rare up to date, more studies have to be conducted and the methodological framework needs to be further developed. The framework shall provide researchers with a tool to capture, analyze, and explain the cognitive processing during program comprehension using eye-movement data.
As discussed before, expert programmers, in this experiment, studied the code of the program first before they initiated the visualization. The visualization then provided them with an additional information, most probably needed to confirm and fine-tune their previously established mental model and hypotheses.
6.4
Conclusions and Further Work
8
Acknowledgement
We would like to thank all participants for taking part in the experiments. Help of Niko Myller before, during, and after the experiment has been greatly appreciated, as well as that of Justus Randolph whose idea initiated this work. Several anonymous reviewers provided valuable comments on an earlier version of the manuscript.
Limitations of the Experiment
Some limitations can be identified considering the experimental part of this study. The number of participants was relatively low and further decreased by technical problems with eye-movement tracking. This issue will be addressed in future studies to ensure higher validity of data and drawn conclusions.
References B EDNARIK , R., AND T UKIAINEN , M. 2004. Visual attention tracking during program debugging. In Proceedings of The Third Nordic Conference on Human-Computer Interaction (NordiCHI’04), ACM Press, New York, NY, USA, 331–334.
Another limitation is related to the generalizability of the findings, concerning the gaze behavior during comprehension. Although the current program visualization systems that are in use share many external features, such as design of interface (e.g. the horizontal split of main area, code on left, visualization on right), their inner mechanism and interaction with the tools might differ. For example, the visualization of Jeliot 3 is based on representing a virtual machine on which a program is executed, while visualizations of PlanAni [Sajaniemi and Kuittinen 2003] are based on a cognitive concept. In addition, some of the previous experiments in program comprehension and debugging with multiple representations involved only precomputed static or semi-dynamic visualizations [Romero et al. 2002]. Therefore, the eventual behavior recorded during comprehension with other tools might be different for any of the involved experience groups.
B EDNARIK , R., AND T UKIAINEN , M. 2005. Effects of display blurring on the behavior of novices and experts during program debugging. In Proceedings of (CHI’05), ACM Press, Portland, OR, USA, Extended abstracts of the ACM Conference on Human Factors in Computing Systems, 1204–1207. B EDNARIK , R., M YLLER , N., S UTINEN , E., AND T UKIAINEN , M. 2005. Effects of experience on gaze behaviour during program animation. In Proceedings of the 17th Annual Psychology of Programming Interest Group Workshop (PPIG’05), 49–61. B EDNARIK , R., M YLLER , N., S UTINEN , E., AND T UKIAINEN , M. 2006. Analyzing individual differences in program compre-
131
N IELSEN , J., C LEMMENSEN , T., AND Y SSING , C. 2002. Getting access to what goes on in peoples heads? reflections on the thinkaloud technique. In Proceedings of The Second Nordic Conference on Human-Computer Interaction (NordiCHI’02), ACM Press, New York, NY, USA, 101–110.
hension with rich data. To appear in Technology, Instruction, Cognition and Learning. B EN -A RI , M. 2001. Program visualization in theory and practice. Informatik/Informatique 2, 8–11. B LACKWELL , A. F. 2002. First steps in programming: A rationale for attention investment models. In HCC ’02: Proceedings of the IEEE 2002 Symposia on Human Centric Computing Languages and Environments (HCC’02), IEEE Computer Society, Washington, DC, USA, 2.
P ETRE , M. 1995. Why looking isn’t always seeing: readership skills and graphical programming. Communications of ACM 38, 6, 33–44. R AYNER , K. 1998. Eye movements in reading and information processing: 20 years of research. Psychological Bulletin 124, 372–422.
B RANCH , J. L. 2000. Investigating the information-seeking processes of adolescents: The value of using think alouds and think afters. Library and Information Science Research 22, 4, 371– 392.
ROMERO , P., L UTZ , R., C OX , R., AND DU B OULAY, B. 2002. Co-ordination of multiple external representations during Java program debugging. In HCC ’02: Proceedings of the IEEE 2002 Symposia on Human Centric Computing Languages and Environments (HCC’02), IEEE Computer Society, Washington, DC, USA, 207.
B ROOKS , R. 1983. Towards a theory of the comprehension of computer programs. International Journal of Man-Machine Studies 18, 543–554.
S AJANIEMI , J., AND K UITTINEN , M. 2003. Program animation based on the roles of variables. In SoftVis ’03: Proceedings of the 2003 ACM symposium on Software visualization, ACM Press, New York, NY, USA, 7–16.
B URKHARDT, J., D E´ TIENNE , F., AND W IEDENBECK , S. 2002. Object-oriented program comprehension: Effect of expertise, task and phase. Empirical Software Engineering 7, 2, 115–156. C ROSBY, M. E., AND S TELOVSKY, J. 1990. How do we read algorithms? A case study. IEEE Computer 23, 1, 24–35.
S OLOWAY, E., L AMPERT, R., L ETOVSKY, S., L ITTMAN , D., AND P INTO , J. 1988. Designing documentation to compensate for delocalized plans. Communications of ACM 31, 11, 1259–1267.
E RICSSON , K. A., AND S IMON , H. A. 1984. Protocol analysis: Verbal reports as data. Braford Books/MIT Press, Cambridge, MA.
H AAK , M., J ONG , M. D., AND S CHELLENS , P. J. 2003. Retrospective vs. concurrent think-aloud protocols: testing the usability of an online library catalogue. Behaviour and Information Technology 22, 5, 339–351.
VAN DEN
G OOD , J., AND B RNA , P. 2004. Program comprehension and authentic measurement: : a scheme for analysing descriptions of programs. International Journal of Human Computer Studies 61, 2, 169–185.
M AYRHAUSER , A., AND VANS , A. M. 1996. Identification of dynamic comprehension processes during large scale maintenance. IEEE Transactions on Software Engineering 22, 6, 424– 437.
VON
JANSEN , A. R., B LACKWELL , A. F., AND M ARRIOTT, K. 2003. A tool for tracking visual attention: The Restricted Focus Viewer. Behavior Research Methods, Instruments, and Computers 35, 1, 57–69. J UST, M. A., AND C ARPENTER , P. A. 1976. Eye fixations and cognitive processes. Cognitive Psychology 8, 441–480. KO , A. J., AND U TTL , B. 2003. Individual differences in program comprehension strategies in unfamiliar programming systems. In IWPC ’03: Proceedings of the 11th IEEE International Workshop on Program Comprehension, IEEE Computer Society, Washington, DC, USA, 175. L ETOVSKY, S. 1986. Cognitive processes in program comprehension. In Papers presented at the first workshop on empirical studies of programmers on Empirical studies of programmers, Ablex Publishing Corp., Norwood, NJ, USA, 58–79. L ITTMAN , D. C., P INTO , J., L ETOVSKY, S., AND S OLOWAY, E. 1986. Mental models and software maintenance. In Papers presented at the first workshop on empirical studies of programmers on Empirical studies of programmers, Ablex Publishing Corp., Norwood, NJ, USA, 80–98. M ORENO , A., M YLLER , N., S UTINEN , E., AND B EN -A RI , M. 2004. Visualizing programs with Jeliot 3. In Proceedings of the Working Conference on Advance Visual Interfaces (AVI 2004), ACM, 373–376. N EVALAINEN , S., AND S AJANIEMI , J. 2005. Short-term effects of graphical versus textual visualisation of variables on program perception. In Proceedings of the 17th Annual Psychology of Programming Interest Group Workshop (PPIG’05), 77–91.
132