This discussion paper is/has been under review for the journal Ocean Science (OS). Please refer to the corresponding final paper in OS if available.
Discussion Paper
Ocean Sci. Discuss., 12, 959–981, 2015 www.ocean-sci-discuss.net/12/959/2015/ doi:10.5194/osd-12-959-2015 © Author(s) 2015. CC Attribution 3.0 License.
| Discussion Paper
An improved method for the determination of dissolved nitric oxide (NO) in seawater samples
OSD 12, 959–981, 2015
An improved method for the determination of dissolved nitric oxide H. E. Lutterbeck and H. W. Bange
Title Page
|
H. E. Lutterbeck and H. W. Bange
Received: 13 April 2015 – Accepted: 27 April 2015 – Published: 3 June 2015 Correspondence to: H. E. Lutterbeck (
[email protected]) Published by Copernicus Publications on behalf of the European Geosciences Union.
Discussion Paper
Department, GEOMAR Helmholtz Centre for Ocean Research Kiel, Kiel, Germany
| Discussion Paper |
959
Abstract
Introduction
Conclusions
References
Tables
Figures
J
I
J
I
Back
Close
Full Screen / Esc Printer-friendly Version Interactive Discussion
5
Discussion Paper
1
|
10
Nitric oxide (NO) is a short-lived intermediate of the oceanic nitrogen cycle, however, due to its high reactivity, measurements of dissolved NO in seawater are rare. Here we present an improved method to determine NO concentrations in discrete seawater samples. The set-up of our system consisted of a chemiluminescence NO analyser connected to a stripping unit. The limit of detection for our method was 5 pmol NO in aqueous solution which translates into 0.25 nmol L−1 when using a 20 mL seawater sample volume. Our method was applied to measure high resolution depth profiles of dissolved NO during a cruise to the eastern tropical South Pacific Ocean. Our method is fast and comparably easy to handle thus it opens the door for deciphering the distribution of NO in the ocean and it facilitates laboratory studies on NO pathways.
Discussion Paper
Abstract
OSD 12, 959–981, 2015
An improved method for the determination of dissolved nitric oxide H. E. Lutterbeck and H. W. Bange
Introduction
Title Page
|
960
|
Discussion Paper
25
|
20
Discussion Paper
15
Nitric oxide (NO) is a short-lived intermediate of various microbial processes of the nitrogen cycle (see e.g. Thamdrup, 2012). Molecular analysis and lab culture experiments showed that various kind of bacteria are able to metabolize NO, e.g. ammoniumoxidizing bacteria (Lipschultz et al., 1981), nitrite-oxidizing bacteria (Freitag and Bock, 1990), methanotrophic bacteria (Yoshinari, 1985) and denitrifying bacteria (Firestone et al., 1979). However, it is still unclear which processes are responsible for the occurrence of NO in natural environments. Although ammonium- and nitrite-oxidizing bacteria can produce NO, there is no evidence for NO as an intermediate during nitrification. A study which compared mathematical models with the results from a laboratory-scale waste water sludge reactor showed that denitrification indeed could be a dominating process of NO release (Kampschreur et al., 2007). This pathway has been investigated in great detail and therefore its enzymatic NO production and the subsequent reduction of NO to nitrogen (N2 ) are well understood (Zumft, 1997). Another process where NO is probably involved as an intermediate is anammox (Strous et al., 2006; Kartal et al.,
Abstract
Introduction
Conclusions
References
Tables
Figures
J
I
J
I
Back
Close
Full Screen / Esc Printer-friendly Version Interactive Discussion
| Discussion Paper |
961
12, 959–981, 2015
An improved method for the determination of dissolved nitric oxide H. E. Lutterbeck and H. W. Bange
Title Page
Discussion Paper
25
OSD
|
20
Discussion Paper
15
|
10
Discussion Paper
5
2011). The latest discovery was the enzymatic dismutation of NO resulting in the microbial production of oxygen (O2 ) used to oxidize methane under anaerobic conditions (Ettwig et al., 2010, 2012). Additionally, NO can be produced in the ocean surface layer − by the photochemical reduction of dissolved nitrite (NO2 ) (Zafiriou and True, 1979; Olasehinde et al., 2010). In summary, there are various potential microbial NO production/consumption pathways in the ocean. Unfortunately, our knowledge about the oceanic NO distribution and the major pathways of NO is very poor. There are only a few published NO concentration measurements available (Bange, 2008) because a reliable and easy to use method to determine dissolved NO at in-situ concentrations in seawater samples is missing. Gaseous and dissolved NO is a very reactive and, thus short-lived molecule because it is a free radical. Its occurrence is predominantly depending on the presence of O2 because it is rapidly oxidized to nitrogen dioxide (NO2 ) (Lewis and Deen, 1994). Therefore, the determination of low concentrations of dissolved NO at in situ conditions is challenging. A summary of the existing methods for the determination of NO is given by Hetrick and Schoenfisch (2009). The published methods for measurement of dissolved NO in seawater are listed in Table 1. The detection limits range from 0.0015 to −1 140 nmol L . (Please note that the fluorometric detection of NO as described by Olase− hinde et al., 2009 is suitable only for formation rates of NO from NO2 .) The sensor of Schreiber et al. (2008) was developed for sediments but works in seawater samples, as well. The chemiluminescence system of Zafiriou and McFarland (1980) consisted of an NO analyser connected to a stripping unit and is, thus, similar to the set-up described here. The method by Zafiriou and McFarland (1980) is the only one so far which was applied on board to measure NO depth profiles during a cruise (Ward and Zafiriou, 1988). However, the required intensive cleaning of the Niskin bottles prior to the CTD/rosette casts together with the fact that each depth was sampled with a separate cast resulted in a time-consuming and unhandy sampling procedure.
Abstract
Introduction
Conclusions
References
Tables
Figures
J
I
J
I
Back
Close
Full Screen / Esc Printer-friendly Version Interactive Discussion
2
Discussion Paper |
962
|
25
12, 959–981, 2015
An improved method for the determination of dissolved nitric oxide H. E. Lutterbeck and H. W. Bange
Title Page
Discussion Paper
20
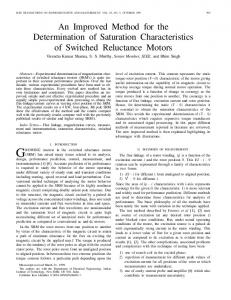
The set-up of our system consisted of a NO analyser connected via a 4-way gas stream selecting valve to a stripping unit and to the gas cylinders for reference gas and carrier gas. A schematic diagram of the system set-up is shown in Fig. 1. The carrier gas (N2 ) and the reference gas (1000 ppb NO in N2 ) were connected to a two channel mass flow controller with mixing chamber (HTK Hamburg GmbH, Hamburg, Germany) to ensure a constant gas flow rate of 1 L min−1 and to enable the calibration of the detector signal (see Sect. 2.4.1). The mass flow controller, in turn, was connected to the gas stream selecting valve. This 4-way valve allowed to switch between two modes of gas flow: Mode A enabled the direct measurement of the reference gas and carrier gas and mode B allowed detection of the gas stream after going through the stripping unit. The sample and stripping vials were connected to the gas line by needles (diameter 1.2 mm) pushed through the respective septa. Two inline filters (Whatman Solvent IFD, 0.2 µm, GE Healthcare UK Limited, Buckinghamshire, England) were installed to remove aerosols from the gas stream. Between the 4-way valve and the NO analyser a needle valve was installed to reduce pressure variations. For a detailed description of the measurement procedure see Sects. 2.2 (samples) and 2.4 (standards). For detection, we used a chemiluminescence NO analyser (model 42i-TL, Thermo Fisher Scientific Inc, Waltham, MA, USA) with a detection range from 0 to 1000 ppb. In the reaction chamber of the analyser, NO reacts with ozone (O3 ) generated by an O3 generator and produces NO2 in an excited state (NO∗2 ). By relaxation to the ground
OSD
|
15
Instrumental set-up
Discussion Paper
10
2.1
|
5
Material and methods
Discussion Paper
Therefore, it was the aim of this study to develop an improved (easy to handle) method for the detection of dissolved NO in discrete seawater samples at in situ concentrations in order to decipher its role in the oceanic nitrogen cycle.
Abstract
Introduction
Conclusions
References
Tables
Figures
J
I
J
I
Back
Close
Full Screen / Esc Printer-friendly Version Interactive Discussion
5
| Discussion Paper |
963
12, 959–981, 2015
An improved method for the determination of dissolved nitric oxide H. E. Lutterbeck and H. W. Bange
Title Page
Discussion Paper
25
OSD
|
20
Sampling took place with a commonly used Conductivity Pressure Depth sensor, equipped with a Niskin bottle rosette (CTD/rosette) and with a pump CTD (pCTD) system (Strady et al., 2008) during the Meteor cruise M93 from 6 February to 11 March 2013 to the Eastern Tropical South Pacific off Peru (Callao, Peru to Panama City, Panama). Seawater samples were taken bubble free in 20 mL brown glass vials, closed with rubber plugs and crimped with aluminium caps. Directly after sampling all samples were stored in a cooling box (∼ 6 ◦ C) until they were measured. From each water depth three to six replicates were taken. From the CTD/rosette all samples were taken as soon as possible, after the CTD was back on the ship’s working deck and were measured within one hour. The samples from the pCTD were taken as soon as the target depth was reached and were measured immediately within a few minutes after sampling. For the measurement, the 4-way valve was switched to mode A to enable the connection of the sample vial by the needles. In the next step the 4-way valve was switched to mode B to reroute the gas flow through the stripping unit. The water of the sample was pushed with the carrier gas into the stripping vial. The stripping vial had a larger volume (50 mL) as the sample vial to allow purging of the sample. The dissolved NO was stripped from the sample by N2 and transported with the carrier gas stream into the analyser. The sample stayed connected stripping unit (mode B) until the detector signal came back to the baseline. Then the 4-way valve was switched to mode A and the next sample was connected.
Discussion Paper
15
Sample handling
|
10
2.2
Discussion Paper
∗
state the NO2 emits a photon. The emitted light passes an optical filter to remove interferences from other compounds and is detected by a photomultiplier. The signal recording was done with the open source software PuTTY 0.62 (http://filehippo.com/ de/download_putty/11216/).
Abstract
Introduction
Conclusions
References
Tables
Figures
J
I
J
I
Back
Close
Full Screen / Esc Printer-friendly Version Interactive Discussion
5
15
Detector calibration
To calibrate the detector signal the carrier gas (N2 ) was blended with the reference gas (1000 ppb NO in N2 ) by the mass flow controller (see above). The resulting NO mixing ratios covered the whole detection range of the NO analyser (0 to 1000 ppb). 2.4.2
Gas standard injection
|
Discrete volumes of reference gas ranging from 0.5 to 10 mL were injected with gas tight syringe (series A-2, Valco Instruments Company Inc., Houston, TX, USA) into the empty stripper. Two different reference gases with concentrations of 1000 ppb NO and 10 ppm NO were used.
|
964
Discussion Paper
20
12, 959–981, 2015
An improved method for the determination of dissolved nitric oxide H. E. Lutterbeck and H. W. Bange
Title Page
Discussion Paper
2.4.1
Calibration
OSD
|
2.4
Discussion Paper
For sample storage experiments we took 18 samples from the pCTD at two stations from the oxygen minimum zone (OMZ) at depths between 60 and 90 m and stored nine ◦ ◦ of them at room temperature (RT, ∼ 24 C) and nine at ∼ 6 C in the dark. For the time series, triplicates per temperature were measured in various time steps. −1 For NO− sodium nitrite (NaNO2 ) 2 addition tests we added 20 µL of a 20 mmol L aqueous solution to about 100 samples taken at different stations and depths; this corresponds to a concentration of 20 µmol L−1 , in addition to the natural concentration already present in the sample. Samples were stored for different time periods, between ◦ ◦ some minutes and some hours in warm (∼ 24 C) and cold (∼ 6 C) environments and then measured like normal samples. Additionally we stored control samples without NO− 2 addition under the same conditions.
|
10
Experiments
Discussion Paper
2.3
Abstract
Introduction
Conclusions
References
Tables
Figures
J
I
J
I
Back
Close
Full Screen / Esc Printer-friendly Version Interactive Discussion
5
965
|
Discussion Paper
25
This calibration method is based on the in situ formation of NO by chemical reduction of − NO− 2 with iodide (I ) in an acidic aqueous medium (Cox, 1980). The preparation of the − −1 NO2 solution started with a stock solution of 1 mol L NaNO2 in MilliQ water followed by a two-step dilution series (100 µL in 100 mL MilliQ water) to get two NO− 2 standards −1 −1 with concentrations of 1 mmol L and 1 µmol L , respectively. They were stored in the dark at RT. The reaction solution is made of two solutions: 11 mL glacial acetic acid were added to 100 mL MilliQ water yielding a 10 % acetic acid (with a concentration of 1.68 mol L−1 ; Kester et al., 1994) and 3 g KI were dissolved in 100 mL MilliQ water to get a 3 % w/v KI solution (Garside, 1982). Prior to a measurement, 1 mL of the KI solution and 1.5 mL 10 % acetic acid were mixed in a 50 mL vial and MilliQ water was added to a final volume of 20 mL. The vial was purged for 20 min with N2 (flow rate 150 mL min−1 ) to remove the O2 and was then
|
20
12, 959–981, 2015
An improved method for the determination of dissolved nitric oxide H. E. Lutterbeck and H. W. Bange
Title Page
Discussion Paper
15
In situ NO formation from NO− reduction 2
OSD
|
2.4.4
Discussion Paper
For preparation of aqueous NO standard solutions a 20 mL brown glass vial filled with 10 mL MilliQ water was purged with N2 for one hour with a flow rate of 100 mL min−1 and then with pure NO or a reference gas (1 % NO in N2 ), with a flow rate of 5 mL min−1 for two hours. Assuming a solubility of 1.94 ± 0.03 mmol L−1 atm−1 at 25 ◦ C for NO (Zacharia and Deen, 2004 and references therein) the final concentrations of the solu−1 −1 tions were 1.94 mmol L and 19.4 µmol L respectively. The standards were stored in the dark at RT. For the actual measurements 20 mL MilliQ water were deoxygenated with N2 for one −1 hour at a flow rate of 150 mL min in a 50 mL vial. Then the vial was connected to the stripping unit followed by an injection of varying volumes (in the range from 1 to 100 µL) of standard through the septum of the vial.
|
10
Aqueous NO standard solutions
Discussion Paper
2.4.3
Abstract
Introduction
Conclusions
References
Tables
Figures
J
I
J
I
Back
Close
Full Screen / Esc Printer-friendly Version Interactive Discussion
2.5
5
Data analysis
10
3.1 3.1.1
Method evaluation Standard measurements
| Discussion Paper
20
|
To assess the performance of our instrumental set-up, we calculated the LOD, LOQ and the SD (average from all measurements over the whole detection range) for the different gaseous and aqueous standards. The results are summarised in Table 2. Please note that the values are given as molar amounts of substance and not as concentrations in order to get volume independent numbers and thus a better comparability between the different kinds of standards described in Sects. 2.4.2–2.4.4. Concentrations for sample measurements are discussed in Sect. 3.1.2. 966
12, 959–981, 2015
An improved method for the determination of dissolved nitric oxide H. E. Lutterbeck and H. W. Bange
Title Page
Discussion Paper
Results and discussion
OSD
|
H stands for the height of the signal and hN is the height of the baseline noise. For the limit of detection (LOD) the value of S/N was set to 3 and for the limit of quantification (LOQ) a value of 10 was used. NO signals below the detection limit were set to zero in further calculations (e.g. averaging of replicates). 3
15
(1)
Discussion Paper
S/N = 2H/hN
|
The recorded NO signals (i.e. peaks) were integrated manually with Origin (OriginLab, Northampton, MA). With the obtained peak areas from the standard measurements a linear calibration equation was calculated to convert the peak areas of sample measurements into concentrations. The signal to noise ratio (S/N) was calculated by an equation of Stauffer (2008):
Discussion Paper
−
connected to the stripping unit. Then the NO2 solution was added via the septum as described above.
Abstract
Introduction
Conclusions
References
Tables
Figures
J
I
J
I
Back
Close
Full Screen / Esc Printer-friendly Version Interactive Discussion
Discussion Paper |
967
|
25
With a water volume of 20 mL the LOD as well as the LOQ for dissolved NO translates into concentrations of 0.25 and 1 nmol L−1 , respectively. By enlarging the sample volume the detection limit can be lowered. However, the peaks will get broader with larger volume thus the detection limit will not decrease in the same amount as the sample volume is increased. We observed, for example, that by increasing the sample volume from 20 to 80 mL the detection limit rose to 10 pmol detectable molar amount of NO but the detectable concentration decreased to 0.125 nmol L−1 .
12, 959–981, 2015
An improved method for the determination of dissolved nitric oxide H. E. Lutterbeck and H. W. Bange
Title Page
Discussion Paper
20
Sample measurements
OSD
|
3.1.2
Discussion Paper
15
|
10
Discussion Paper
5
For aqueous NO standards (see Sect. 2.4.3) the lowest detectable molar amount of NO was 5 pmol with a SD of 25 %. We observed that the aqueous NO solutions did not change within ten months. This indicates that the standard solutions are much longer stable than previously reported (Mesaros et al., 1997; Menon et al., 1990). − For in situ NO formation from NO2 reduction (see Sect. 2.4.4) the LOD was 10 pmol NO and the SD 3 %. The detection limit is higher than for aqueous NO solutions because NO is formed in situ and this results in broader peaks with lower peak − heights. We observed no decrease of the NO2 concentration in the standards during − our measurements and conclude that the NO2 solutions should be stable when kept in the dark. The ratio of peak area to concentration is similar for both the aqueous NO standards and the in situ formation of NO from NO− 2 reduction. Thus both standards can be used for calibration of aqueous samples. Discrete gas standard measurements had a detection limit of 15 pmol NO. By cleaning the gas tight syringes after five measurements with 100 % ethanol the SD could be decreased from 65 to 10 %. We observed no influence of the injected volume between 0.5 and 10 mL on the detected NO. The stability of the used reference gases (one year) was given by the manufacturer.
Abstract
Introduction
Conclusions
References
Tables
Figures
J
I
J
I
Back
Close
Full Screen / Esc Printer-friendly Version Interactive Discussion
3.2.1
5
| Discussion Paper |
968
12, 959–981, 2015
An improved method for the determination of dissolved nitric oxide H. E. Lutterbeck and H. W. Bange
Title Page
Discussion Paper
−
NO can photochemically be produced from dissolved NO2 (Zafiriou and True, 1979; Olasehinde et al., 2010). As NO− 2 can be enhanced in the water column (especially − in OMZs) we performed NO2 addition tests to find out if there is any light induced production of NO caused by our sample handling. Our experiments showed no differences in NO concentrations between samples with −1 and without NO− NaNO2 solution to 2 addition. The addition of 1 mL of a 1 mmol L 20 mL MilliQ water resulted only in a very small NO peak. Thus we conclude that a po− tential in situ production of NO from NO2 does not affect the measurement method described here.
OSD
|
20
Nitrite (NO− ) 2
Discussion Paper
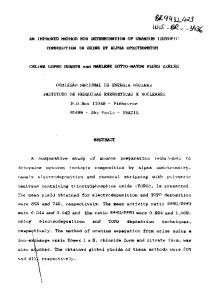
During the cruise M93 we faced a sulfidic event close to the coast of Peru. Therefore, some of the samples contained H2 S which resulted in a strong negative detector signal (Fig. 2). A visible negative response of the NO analyser (i.e. stronger than the baseline noise of the instrument) was determined down to a concentration of about 80 nmol L−1 H2 S, but even lower H2 S concentrations could have an impact on the NO signal such as neutralisation of a positive NO signal. Tests with addition of ZnCl2 (in order to precipitate H2 S as ZnS) showed that the negative peaks of H2 S vanished indeed, but the impact of ZnCl2 addition on the NO concentration in the sample is unknown. It might be possible that NO is removed from the sample by chemical reduction. Some preliminary tests showed that ZnCl2 can also increase the NO concentration, possibly a release from poisoned plankton. 3.2.2
15
Hydrogen sulphide (H2 S)
|
10
Interferences by other components
Discussion Paper
3.2
Abstract
Introduction
Conclusions
References
Tables
Figures
J
I
J
I
Back
Close
Full Screen / Esc Printer-friendly Version Interactive Discussion
5
| Discussion Paper |
969
12, 959–981, 2015
An improved method for the determination of dissolved nitric oxide H. E. Lutterbeck and H. W. Bange
Title Page
Discussion Paper
25
OSD
|
20
Discussion Paper
15
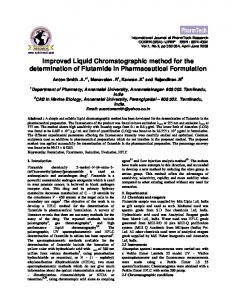
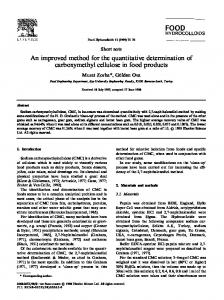
Two factors influenced the NO concentrations in the samples: the storage time (i.e. the time between sampling and the actual measurement of the sample) and the ambient O2 concentrations. This is especially important for samples from the OMZ where slight changes in O2 are expected to have a significant effect on dissolved NO (Lewis and Deen, 1994). The storage experiments showed a decrease in NO concentrations over time with a stronger decline at room temperature compared to storage at ∼ 6 ◦ C (Fig. 3). The decrease of the NO concentrations may be explained by the well-known common effect of bottle consumption caused by pores in the glass vials and in the rubber stoppers. However, a stronger effect on the NO concentration is probably caused by diffusion of O2 into the sample. De Brabandere et al. (2012) showed that O2 contamination can be caused by diffusion of O2 out of the rubber plugs. At room temperature the diffusion of 1 nmol O2 into a water sample takes only a few seconds. As NO is very O2 sensitive (Lewis and Deen, 1994) it can be assumed that this O2 impurity resulted in a decrease of NO in the sample vials. It can also partly explain the enhanced decrease at room temperature compared to storage at ∼ 6 ◦ C. At higher temperatures the input of O2 is faster and thus more NO could be degraded. Another reason for the temperature effect is a potential biological consumption, e.g. by denitrification and anammox, in the samples from the OMZ. As the metabolic activity is higher at room temperature ◦ compared to ∼ 6 C more NO could be used up. A large impact on the NO concentrations in the samples had the choice of the water sampling system (Niskin bottles or pCTD). The scatter plot with our measurements from the Niskin bottles of the CTD/rosette (Fig. 4a) shows that the NO concentrations were mostly near or below the detection limit. Only a few samples showed NO concen−1 trations of up to 2 nmol L . Contrasting to this, samples from the pump CTD (Fig. 4b) showed a broad range of concentrations up to 10 nmol L−1 . This has been confirmed by direct comparison of both CTD systems on two stations (Fig. 4c and d). No change
|
10
Sample handling
Discussion Paper
3.3
Abstract
Introduction
Conclusions
References
Tables
Figures
J
I
J
I
Back
Close
Full Screen / Esc Printer-friendly Version Interactive Discussion
Summary
|
Here we present an improved method to determine dissolved NO in discrete seawater samples. The set-up of our system consisted of a chemiluminescence NO analyser connected to a stripping unit. The lower limit of detection for our method was 5 pmol NO −1 in aqueous solution which corresponds to 0.25 nmol L when using a 20 mL seawater sample volume. Our method was applied to measure high resolution depth profiles of dissolved NO during a cruise to the eastern tropical South Pacific Ocean. One CTD cast (including sampling) can be processed in less than two hours. However, for the
Discussion Paper
970
|
25
12, 959–981, 2015
An improved method for the determination of dissolved nitric oxide H. E. Lutterbeck and H. W. Bange
Title Page
Discussion Paper
4
OSD
|
20
Discussion Paper
15
|
10
Discussion Paper
5
in NO concentrations with depth was evident from CTD/rosette casts whereas from the pCTD plausible shapes of the NO depth profiles were obtained. One reason for the obvious difference between the two CTD systems is most likely the time effect as found in our sample storage experiments which might have occurred in the Niskin bottles as well. The seawater stays between 30 min and several hours in the Niskin bottles during the time of a CTD cast until sampling. During this time an O2 contamination of 1 µmol L−1 can be induced (Alarcón and Ulloa, 2009). This O2 entry into the bottles together with a comparably long CTD cast time may result in a strong decrease of NO already before the samples could be taken. For the pCTD system a dif−1 fusive O2 input to the water while pumped up of only 20 nmol L has been estimated (Canfield et al., 2010) resulting in a low O2 contamination. The short residence time of the seawater in the tubing in combination with a smaller O2 contamination might have led to comparable lower NO degradation and thus in turn to higher detectable NO concentrations in the samples taken from the pCTD. Overall, NO samples are unstable after sampling so they have to be processed very fast. Thus, it is recommended to use a pCTD as sampling system and O2 contamination should be reduce to a minimum (e.g. by using deoxygenated materials). However, it may be possible that NO concentrations are rather underestimated due to sampling time and delay until measurement.
Abstract
Introduction
Conclusions
References
Tables
Figures
J
I
J
I
Back
Close
Full Screen / Esc Printer-friendly Version Interactive Discussion
Discussion Paper
Appendix:
|
10
Discussion Paper
5
sampling we recommend using a pump CTD rather than a conventional CTD/rosette with Niskin bottles. In general, contamination by O2 diffusion into the samples should be minimized by using appropriate materials. Dissolved H2 S interferes strongly with the − NO detection, whereas the in situ production of NO from dissolved NO2 seems to be negligible. − The in situ formation of NO from NO− 2 reduction (with I in acidified aqueous medium) − would also allow applying our set up for the measurements of dissolved NO2 (and nitrate) in seawater samples (Garside, 1982) down to very low concentrations. The method for the determination of dissolved NO as described here is fast and comparably easy to handle thus it opens the door for comprehensive measurements of the distribution of oceanic NO and it facilitates laboratory studies on NO pathways.
OSD 12, 959–981, 2015
An improved method for the determination of dissolved nitric oxide H. E. Lutterbeck and H. W. Bange
Title Page
| |
971
Discussion Paper
25
|
20
Discussion Paper
15
Nitrogen (N2 , 99.999 %), reference gases (1000 ppb NO in N2 , 10 ppm NO in N2 , 1 % NO in N2 ), and nitric oxide (NO, ≥ 99.5 %) were purchased from Air Liquide GmbH (Düsseldorf, Germany). Sodium nitrite (NaNO2 , ≥ 99.0 %, p.a.), zinc chloride (ZnCl2 , ≥ 98.0 %, p.a.) and acetic acide (100 %) were from Merck KGaA (Darmstadt, Germany). And potassium iodide (KI, ≥ 99.5 %, p.a.) was obtained from Carl Roth GmbH (Karlsruhe, Germany). All tubings were from stainless steel or PTFE with a diameter of 1/4 and 1/8 inch. Valves, fittings and needles were also made of stainless steel. Processing a measurement with our system is fast, easy and takes only a few minutes. Up to 20 measurements can be done within one hour. The instrument showed a stable baseline and no drift over time for two years. For measurements in solution and at higher concentration ranges, it is important to include breaks and cleaning of the stripping unit between the measurements to prevent a less sensitive detection limit. The higher the NO concentrations are, the more often breaks and cleaning are needed to keep the baseline stable. The same applies for MilliQ water
Abstract
Introduction
Conclusions
References
Tables
Figures
J
I
J
I
Back
Close
Full Screen / Esc Printer-friendly Version Interactive Discussion
5
Discussion Paper
The article processing charges for this open-access publication were covered by a Research Centre of the Helmholtz Association.
|
10
Acknowledgements. We sincerely thank the chief scientists of cruise M93, Torsten Kanzow und Gaute Lavik, as well as the crew of R/V Meteor for their support at sea. We thank D. Arévalo-Martínez for his help with the sampling during the cruise. The authors thank Carolin Löscher for her helpful comments on an early draft of the manuscript. The financial support of the DFG-funded (Deutsche Forschungsgemeinschaft) Collaborative Research Center 754/Sonderforschungsbereich 754 “Climate-Biogeochemistry Interactions in the Tropical Ocean” (www.sfb754.de) is gratefully acknowledged.
Discussion Paper
and reaction solution for aqueous standard measurements. The two liquids can be reused for several measurements. The number of possible measurements done with the same liquid depend on the concentration. With higher concentrations the liquid should be replaced more often to keep the baseline constant.
OSD 12, 959–981, 2015
An improved method for the determination of dissolved nitric oxide H. E. Lutterbeck and H. W. Bange
Title Page
|
20
|
972
Discussion Paper
Alarcón, G. and Ulloa, O.: Cruise Report, MOOMZ-2, Departamento de Oceanografía, Universidad de Concepción, Chile, 28 pp., 2009. Bange, H. W.: Gaseous nitrogen compounds (NO, N2 O, N2 , NH3 ) in the ocean, in: Nitrogen in the Marine Environment, 2, edited by: Capone, D. G., Bronk, D. A., Mulholland, M. R., and Carpenter, E. J., Elsevier, Amsterdam, Netherlands, 51–94, 2008. Canfield, D. E., Stewart, F. J., Thamdrup, B., De Brabandere, L., Dalsgaard, T., Delong, E. F., Revsbech, N. P., and Ulloa, O.: A cryptic sulfur cycle in oxygen-minimum–zone waters off the Chilean coast, Science, 330, 1375–1378, 2010. Cox, R. D.: Determination of nitrate and nitrite at the parts per billion level by chemiluminescence, Anal. Chem., 52, 332–335, 1980. De Brabandere, L., Thamdrup, B., Revsbech, N. P., and Foadi, R.: A critical assessment of the occurrence and extend of oxygen contamination during anaerobic incubations utilizing commercially available vials, J. Microbiol. Meth., 88, 147–154, 2012.
|
25
References
Discussion Paper
15
Abstract
Introduction
Conclusions
References
Tables
Figures
J
I
J
I
Back
Close
Full Screen / Esc Printer-friendly Version Interactive Discussion
Discussion Paper |
973
|
30
12, 959–981, 2015
An improved method for the determination of dissolved nitric oxide H. E. Lutterbeck and H. W. Bange
Title Page
Discussion Paper
25
OSD
|
20
Discussion Paper
15
|
10
Discussion Paper
5
Ettwig, K. F., Butler, M. K., Le Paslier, D., Pelletier, E., Mangenot, S., Kuypers, M. M. M., Schreiber, F., Dutilh, B. E., Zedelius, J., de Beer, D., Gloerich, J., Wessels, H. J. C. T., van Alen, T., Luesken, F., Wu, M. L., van de Pas-Schoonen, K. T., Op den Camp, H. J. M., Janssen-Megens, E. M., Francoijs, K.-J., Stunnenberg, H., Weissenbach, J., Jetten, M. S. M., and Strous, M.: Nitrite-driven anaerobic methane oxidation by oxygenic bacteria, Nature, 464, 543–548, 2010. Ettwig, K. F., Speth, D. R., Reimann, J., Wu, M. L., Jetten, M. S. M., and Keltjens, J. T.: Bacterial oxygen production in the dark, Front. Microbiol., 3, 273, doi:10.3389/fmicb.2012.00273, 2012. Firestone, M. K., Firestone, R. B., and Tiedje, J. M.: Nitric oxide as an intermediate in denitrification: evidence from nitrogen-13 isotope exchange, Biochem. Bioph. Res. Co., 91, 10–16, 1979. Freitag, A. and Bock, E.: Energy conservation in Nitrobacter, FEMS Microbiol. Lett., 66, 157– 162, 1990. Garside, C.: A chemiluminescent technique for the determination of nanomolar concentrations of nitrate and nitrite in seawater, Mar. Chem., 11, 159–167, 1982. Greenwood, N. N. and Earnshaw, A. (Eds.): Chemistry of the Elements, 2nd edn., Pergamon Press, Oxford, UK, 1600 pp., 1984. Hetrick, E. M. and Schoenfisch, M. H.: Analytical chemistry of nitric oxide, Annu. Rev. Anal. Chem., 2, 409–433, 2009. Kampschreur, M. J., Picioreanu, C., Tan, N., Kleerebezem, R., Jetten, M. S. M., and van Loosdrecht, M. C. M.: Unraveling the source of nitric oxide emission during nitrification, Water Environ. Res., 79, 2499–2509, 2007. Kartal, B., Maalcke, W. J., de Almeida, N. M., Cirpus, I., Gloerich, J., Geert, S. W., den Camp, H., Harhangi, H. R., Janssen-Megens, E. M., Francoijs, K. J., Stunnenberg, H. G., Keltjens, J. T., Jetten, M. S. M., and Strous, M.: Molecular mechanism of anaerobic ammonium oxidation, Nature, 479, 127–130, 2011. Kester, R. A., Wijlhuizen, A. G., Duyts, H., and Laanbroek, H. J.: Chemiluminescence analysis of nitric oxide in small-volume samples by a modified injection method, Biol. Fert. Soils, 18, 260–262, 1994. Lewis, R. S. and Deen, W. M.: Kinetics of the reaction of nitric oxide with oxygen in aqueous solutions, Chem. Res. Toxicol., 7, 568–574, 1994.
Abstract
Introduction
Conclusions
References
Tables
Figures
J
I
J
I
Back
Close
Full Screen / Esc Printer-friendly Version Interactive Discussion
974
|
| Discussion Paper
30
12, 959–981, 2015
An improved method for the determination of dissolved nitric oxide H. E. Lutterbeck and H. W. Bange
Title Page
Discussion Paper
25
OSD
|
20
Discussion Paper
15
|
10
Discussion Paper
5
Lipschultz, F., Zafiriou, O. C., Wofsy, S. C., McElroy, M. B., Valois, F. W., and Watson, S. W.: Production of NO and N2 O by soil nitrifying bacteria, Nature, 294, 641–643, 1981. Menon, N. K., Pataricza, J., Binder, T., and Bing, R. J.: Reduction of biological effluents in purge and trap micro reaction vessels and detection of endothelium-derived nitric oxide (edno) by chemiluminescence, J. Mol. Cell. Cardiol., 123, 389–393, 1991. Mesaros, S., Grunfeld, S., Mesarosova, A., Bustin, D., and Malinski, T.: Determination of nitric oxide saturated (stock) solution by chronoamperometry on a porphyrine microelectrode, Anal. Chim. Acta, 339, 265–270, 1997. Olasehinde, E. F., Takeda, K., and Sakugawa, H.: Development of an analytical method for nitric oxide radical determination in natural waters, Anal. Chem., 81, 6843–6850, 2009. Olasehinde, E. F., Takeda, K., and Sakugawa, H.: Photochemical production and consumption mechanisms of nitric oxide in seawater, Environ. Sci. Technol., 44, 8403–8408, 2010. Schreiber, F., Polerecky, L., and de Beer, D.: Nitric oxide microsensor for high spatial resolution measurements in biofilms and sediments, Anal. Chem., 80, 1152–1158, 2008. Shin, J. H., Privett, B. J., Kita, J. M., Wightman, R. M., and Schoenfisch, M. H.: Fluorinated xerogel-derived microelectrodes for amperometric nitric oxide sensing, Anal. Chem., 80, 6850–6859, 2008. Stauffer, D.: Das Chromatogramm, in: Chromatogramme richtig integrieren und bewerten: Ein Praxishandbuch für die HPLC und GC, edited by: Kromidas, S. and Kuss, H., Wiley-VCH, Weinheim, Germany, 2008. Strady, E., Pohl, C., Yakushev, E. V., Krüger, S., and Hennings, U.: PUMP–CTD-System for trace metal sampling with a high vertical resolution. A test in the Gotland Basin, Baltic Sea, Chemosphere, 70, 1309–1319, 2008. Strous, M., Pelletier, E., Mangenot, S., Rattei, T., Lehner, A., Taylor, M. W., Horn, M., Daims, H., Bartol-Mavel, D., Wincker, P., Barbe, V., Fonknechten, N., Vallenet, D., Segurens, B., Schenowitz-Truong, C., Médigue, C., Collingro, A., Snel, B., Dutilh, B. E., Op den Camp, H. J. M., van der Drift, C., Cirpus, I., van de Pas-Schoonen, K. T., Harhangi, H. R., van Niftrik, L., Schmid, M., Keltjens, J., van de Vossenberg, J., Kartal, B., Meier, H., Frishman, D., Huynen, M. A., Mewes, H.-W., Weissenbach, J., Jetten, M. S. M., Wagner, M., and Le Paslier, D.: Deciphering the evolution and metabolism of an anammox bacterium from a community genome, Nature, 440, 790–794, 2006. Thamdrup, B.: New pathways and processes in the global nitrogen cycle, Annu. Rev. Ecol. Evol. S., 43, 407–428, 2012.
Abstract
Introduction
Conclusions
References
Tables
Figures
J
I
J
I
Back
Close
Full Screen / Esc Printer-friendly Version Interactive Discussion
Discussion Paper
15
|
10
Discussion Paper
5
Ward, B. B. and Zafiriou, O. C.: Nitrification and nitric oxide in the oxygen minimum of the eastern tropical North Pacific, Deep-Sea Res., 35, 1127–1142, 1988. Xing, L., Zhang, Z., Liu, C., Wu, Z., and Lin, C.: Amperometric detection of nitric oxide with microsensor in the medium of seawater and its applications, Sensors, 5, 537–545, 2005. Yoshinari, T.: Nitrite and nitrous oxide production by Methylosinus trichosporium, Can. J. Microbiol., 31, 139–144, 1985. Zacharia, I. G. and Deen, W. M.: Diffusivity and solubility of nitric oxide in water and saline, Ann. Biomed. Eng., 33, 214–22, 2005. Zafiriou, O. C. and McFarland, M.: Determination of trace levels of nitric oxide in aqueous solution, Anal. Chem., 52, 1662–1667, 1980. Zafiriou, O. C. and True, M. B.: Nitrite photolysis in seawater by sunlight, Mar. Chem., 8, 9–32, 1979. Zhang, Z., Xing, L., Jiang, L., Wang, Y., Ren, C., and Cai, W.: The electrochemical detremination of nitric oxide in seawater media with microelectrodes, Sensors, 3, 304–313, 2003. Zumft, W. G.: Cell biology and molecular basis of denitrification, Microbiol. Mol. Biol. R., 61, 533–616, 1997.
OSD 12, 959–981, 2015
An improved method for the determination of dissolved nitric oxide H. E. Lutterbeck and H. W. Bange
Title Page
| Discussion Paper | Discussion Paper |
975
Abstract
Introduction
Conclusions
References
Tables
Figures
J
I
J
I
Back
Close
Full Screen / Esc Printer-friendly Version Interactive Discussion
Discussion Paper |
Reference
Microelectrode Microelectrode Microelectrode Fluorometric Chemiluminescence Chemiluminescence
140 42 30 ∗ 0.0124 0.0015 0.25
Zhang et al. (2003) Xing et al. (2005) Schreiber et al. (2008) Olasehinde et al. (2009) Ward and Zafiriou (1988) this study
LOD for the conversion product from the reaction of NO with the trapping compound.
| Discussion Paper |
976
An improved method for the determination of dissolved nitric oxide H. E. Lutterbeck and H. W. Bange
Title Page
Discussion Paper
LOD [nmol L−1 ]
12, 959–981, 2015
|
∗
Method
Discussion Paper
Table 1. Overview of published methods for NO detection in seawater with the respective limit of detection (LOD) for each method.
OSD
Abstract
Introduction
Conclusions
References
Tables
Figures
J
I
J
I
Back
Close
Full Screen / Esc Printer-friendly Version Interactive Discussion
Discussion Paper |
LOQ [pmol]
SD [%]
Stability time
Aqueous NO standard solution − In situ NO formation from NO2 reduction Reference gas
5 10 15
20 40 30
25 3 10
10 months – one year
| Discussion Paper |
977
An improved method for the determination of dissolved nitric oxide H. E. Lutterbeck and H. W. Bange
Title Page
Discussion Paper
LOD [pmol]
12, 959–981, 2015
|
Standard
Discussion Paper
Table 2. Overview of the limit of detection (LOD), the limit of quantification (LOQ), the SD and the estimated stability time of the applied standards types.
OSD
Abstract
Introduction
Conclusions
References
Tables
Figures
J
I
J
I
Back
Close
Full Screen / Esc Printer-friendly Version Interactive Discussion
Discussion Paper
OSD 12, 959–981, 2015
| Discussion Paper
An improved method for the determination of dissolved nitric oxide H. E. Lutterbeck and H. W. Bange
Title Page
| Discussion Paper Discussion Paper |
978
|
Figure 1. Schematic set-up of the developed measurement system consisting of an NO analyser connected to a stripping unit (blue lines). A: N2 gas cylinder, B: reference gas cylinder, C: mass flow controller, D: 4-way valve (solid lines: mode A, dashed lines: mode B), E: inline filter, F: needle valve, G: sample vial, H: stripping vial filled with water, I: NO analyser, J: vacuum pump with vent.
Abstract
Introduction
Conclusions
References
Tables
Figures
J
I
J
I
Back
Close
Full Screen / Esc Printer-friendly Version Interactive Discussion
Discussion Paper
OSD 12, 959–981, 2015
| Discussion Paper
An improved method for the determination of dissolved nitric oxide H. E. Lutterbeck and H. W. Bange
Title Page
| Discussion Paper | |
979
Discussion Paper
Figure 2. Detector signal for six seawater samples containing H2 S.
Abstract
Introduction
Conclusions
References
Tables
Figures
J
I
J
I
Back
Close
Full Screen / Esc Printer-friendly Version Interactive Discussion
Discussion Paper
OSD 12, 959–981, 2015
| Discussion Paper
An improved method for the determination of dissolved nitric oxide H. E. Lutterbeck and H. W. Bange
Title Page
| Discussion Paper | |
980
Discussion Paper
Figure 3. Degradation curves of three sample storage tests. The samples were kept in the dark at room temperature (∼ 24 ◦ C, red triangles) and at 6 ◦ C (blue squares). The measurements from the regular sampling (black crosses) were used as starting points for the curve fitting of both temperature settings.
Abstract
Introduction
Conclusions
References
Tables
Figures
J
I
J
I
Back
Close
Full Screen / Esc Printer-friendly Version Interactive Discussion
Discussion Paper
OSD 12, 959–981, 2015
| Discussion Paper
An improved method for the determination of dissolved nitric oxide H. E. Lutterbeck and H. W. Bange
Title Page
| Discussion Paper | |
981
Discussion Paper
Figure 4. Comparison of the NO measurements from the CTD/rosette (red) and from the pump CTD (blue). (a, b) All NO measurements during M93 between 0 and 350 m. (c) M93 station 411-6 at 12.377◦ S, 77.388◦ W. (d) M93 station 391-4 at 12.668◦ S, 77.821◦ W, the bottom depth was 1654 m.
Abstract
Introduction
Conclusions
References
Tables
Figures
J
I
J
I
Back
Close
Full Screen / Esc Printer-friendly Version Interactive Discussion