ISPRS Annals of the Photogrammetry, Remote Sensing and Spatial Information Sciences, Volume IV-3, 2018 ISPRS TC III Mid-term Symposium “Developments, Technologies and Applications in Remote Sensing”, 7–10 May, Beijing, China
AN IMPROVED UNSUPERVISED IMAGE SEGMENTATION EVALUATION APPROACH BASED ON UNDER- AND OVER-SEGMENTATION AWARE Tengfei Su 1, * 1
Inner Mongolia Agricultural University, College of Water Conservancy and Civil Engineering, 010018 Inner Mongolia Hohhot, China -
[email protected] Commission ICWG II/III
KEY WORDS: Image Segmentation Evaluation, Unsupervised, Under- and Over-segmentation Aware, Over-Segmentation Error, Under-Segmentation Error, Edge Strength
ABSTRACT: In this paper, an unsupervised evaluation scheme for remote sensing image segmentation is developed. Based on a method called under- and over-segmentation aware (UOA), the new approach is improved by overcoming the defect in the part of estimating oversegmentation error. Two cases of such error-prone defect are listed, and edge strength is employed to devise a solution to this issue. Two subsets of high resolution remote sensing images were used to test the proposed algorithm, and the experimental results indicate its superior performance, which is attributed to its improved OSE detection model.
1. INTRODUCTION Image segmentation has been considered as a key step in objectbased image analysis (OBIA), since it has a significant impact on classification performance (Blaschke et al. 2014; Su and Zhang 2017). Accordingly, many studies attempted to improve the quality of segmentation approaches (Troya-Galvis et al. 2015; Su and Zhang 2017). However, it is not an easy task, not only because in remote sensing images, there are miscellaneous geo-objects of different sizes and various spectral signatures, which complicates the design of segmentation algorithms, but also because it is often a difficult problem to precisely and objectively evaluate the performance of segmentation results. Although there exists a number of segmentation evaluation metrics, they all have their merits and demerits which deserve to be analyzed. The existent segmentation evaluation methods can be broadly categorized into two types: qualitative and quantitative approaches. The former mainly relies on visual inspection, which is simple to perform, but it cannot provide quantitative score and may suffer from subjectivity (Su and Zhang 2017). On the contrary, quantitative methods can produce explicit scoress to reflect the quality of a segmentation result. Thus, quantitative methods are more prevalently used in segmentation-related studies. Generally, quantitative approaches can also be classified as two sub-types: supervised and unsupervised strategies. Their primary difference resides in whether ground truth is adopted. The former needs ground truth to yield evaluation scores, and such methods are frequently employed in related researches, since it can accurately determine which segmentation result is the best by directly comparing the resulted scores. Although supervised approaches are more popular, it is still inappropriate to conclude that unsupervised methods are useless. In fact, in terms of operational application, ground truth is often hard and expensive to obtain, and unsupervised methods are therefore useful to help tune the segmentation parameter(s), such as scale,
which has been considered to be the most influential one in multi-scale segmentation approaches (Johnson and Xie 2011; Yang et al. 2015). During recent years, many studies related to optimal scale estimation by means of unsupervised metrics have been reported. Johnson and Xie (2011) used regional spectral variance and spatial auto-correlation to determine the optimal scale. This method was further improved by Böck et al. (2017), leading to stabilized solution for the estimation of optimal scale. Spectral angle was also utilized (Yang et al. 2014; Yang et al. 2015) to identify the most meaningful scale parameter(s). Moreover, an interesting method called under- and oversegmentation aware (UOA) was proposed by Troya-Galvis et al. (2015), which, in addition to the capacity of estimating optimal scale, was able to explicitly determine whether a segment is over- or under-segmented. This approach is also extendable, since its homogeneity criteria can be adaptively modified according to user's specific needs. However, there is a defect in its design, which may result in over-estimation of oversegmentation error. Accordingly, this work aims to improve this method by correcting this shortcoming. 2. METHOD 2.1 The original UOA Consider a segment Si that may not accurately correspond to a real geo-object in a remotely sensed scene, it can be assumed that such a segment tends to contain under-segmentation error (USE) if its within-segment heterogeneity is very large, conversely, it may have over-segmentation error (OSE) if its intra-segment heterogeneity is very low and most importantly, there exists a neighbouring segment Sj, whose union with Si is also of very low heterogeneity. Based on this assumption, UOA provides the following model to locally evaluate the segmentation error type of a segment Si:
* Corresponding author
This contribution has been peer-reviewed. The double-blind peer-review was conducted on the basis of the full paper. https://doi.org/10.5194/isprs-annals-IV-3-197-2018 | © Authors 2018. CC BY 4.0 License.
197
ISPRS Annals of the Photogrammetry, Remote Sensing and Spatial Information Sciences, Volume IV-3, 2018 ISPRS TC III Mid-term Symposium “Developments, Technologies and Applications in Remote Sensing”, 7–10 May, Beijing, China
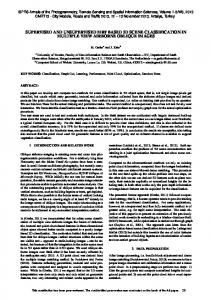
𝐸𝛿 (𝑆𝑖 ) = if 𝐻(𝑆𝑖 ) > 𝛿 −1 � 1 if 𝐻(𝑆𝑖 ) < 𝛿 and ∃ 𝑆𝑗 ∈ 𝑁(𝑆𝑖 ) ∧ 𝐻�𝑆𝑖 ∪ 𝑆𝑗 � < 𝛿 (1) 0 otherwise where Eδ(Si) represents the segmentation error type of segment Si, and it indicates USE, OSE, or not an error when its value is 1, 1, 0, respectively; H(·) is heterogeneity measure that can be adaptively designed; δ symbolizes a heterogeneity threshold, and if H(Si)> δ, Si is considered to be too heterogeneous; N(Si) means a set of segments that are neighbours of Si. It is worth mentioning that there are various ways to design H(·). However, this study focuses on unveiling and correcting the defect of OSE identification detailed in the following subsections, and thus intra-segment spectral variance, which has been tested to be simple but effective (Troya-Galvis et al. 2015), was adopted to model H(·): 1 𝐻(𝑆𝑖 ) = ∑𝐵𝑏 𝜎𝑏 (2) 𝐵 where B represents the number of bands; σb is the spectral standard deviation of bth band of the segment under processing. 2.2 The defect of UOA To clearly explain the UOA defect in its OSE measurement strategy, Fig. 1(a) is firstly used as an illustration, where there are two spectrally similar segments. Suppose that the two segments well represent two real geo-objects. In this situation, the Eδ value of both segments should not be 1. However, if the spectral appearances of S1 and S2 are similar enough, making H(S1∪S2)