Conjoint Effects of R&D on the Financial Performance of Semiconductor Companies: Rule-Based Granular Computing Kao-Yi Shen1, Gwo-Hshiung Tzeng2, Min-Ren Yan3, and Kuo-Ming Chien4 1,3Chinese
Culture University (SCE), Taipei, Taiwan Graduate Institute of Urban Planning, College of Public Affairs, National Taipei University, New Taipei City, Taiwan 4Science and Technology Policy Research and Information Center, Taipei, Taiwan 2
SCIS & ISIS 2014, Dec 3-6, 2014, Kitakyushu, Japan
• Research Background • Research Purpose • Proposed Hybrid Model • Results • Discussions • Conclusion
Outlines
2
• The importance of R&D • MCDM problems • What matters the most in • Ranking or selection the long-run: financial • Improvement planning performance (FP) • Does high R&D investment would yield high FP??
Research Background
3
• Explore the contextual (conjoint) effect of R&D on FP • Identify core criteria • Obtain the contextual implications • How to improve?
• Diagnoses of FP • Prediction • Selection • Improvement planning
• Source factors
Research Purposes
4
Big Data
Data Mining
New Perspective
Core Attributes
Granulized Concepts and Reasoning
5
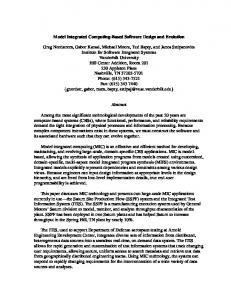
New alternatives for evaluation
Positive Rules
Negative Rules A group of attributes 1) Financial ratios 2) R&D indicators
Formal VIKOR Concept Decision Analysis Model (FCA) FCA reasoning (Stage 2)
DRSA decision rules (Stage 1)
Proposed Two Stage Model
6
Decision Attribute
Multiple conditional attributes
Preferred
Different values of attribute 1 t
DC 1
Different values in attribute n
Classification in DRSA
DC m
7
Evaluate alternatives by DRSA IS to identify performance gaps
Ri
Alternative
Rn Positive Rules (desired DC)
FCA analysis for a performance gap
From DRSA to FCA Analysis
8
Limited resource…
How to make improvements? Priority? Invest on R&D?
Guiding improvements ⇒the next move
9
• Period: 2006-2013 • Source • MOPS: http://emops.twse.com.tw/emops_all.htm • TEJ database • Science and Technology Policy Research and Information Center (Taiwan)
• Conditional Attributes in DRSA • 19 financial indicators (refer to MOPS regular disclosure)
• Decision attribute in DRSA • NetProfit
Data
10
Time windows of this study
11
• Ordinal (Essential idea)
Conceptualized granular computation
• Quartile
• Normal-distribution based
Low
Discretization
Middle
High
12
Aggregated Performance
Final FP
Dimensions Attributes
Capital Structure
a1
Solvency
Operational Efficiency
Profitability
a2
Cash Flow
R&D
a14
(Refer to the definitions of all attributes in Table 1)
Five+One dimensions
13
Table 2 Classification results of the training set Algorithm Discretization
Quartile
1 2 3 4 5 Average SD
76.19% 76.19% 73.33% 75.25% 74.29% 75.05% 1.24%
DRSA Quartile Normal * Patent 75.25% 68.58% 75.25% 71.43% 73.33% 70.31% 73.33% 70.48% 76.19% 73.33% 74.67% 70.83% 1.28% 1.74%
Normal Patent* 67.62% 72.38% 72.38% 69.54% 71.43% 70.67% 2.06%
DISCRI Quartile Normal 66.67% 64.76% 67.62% 68.57% 62.86% 66.10% 2.29%
65.71% 64.76% 66.70% 62.86% 64.76% 64.96% 1.42%
*The attribute Patent was analyzed by adopting the raw figures (i.e., without discretization) for DRSA analyses.
DRSA training result
14
Attributes CORE Debt, LongCapital, Liquidity, Speed, InterestCoverage, AR_turnover, AR_days, TotalAssetTurnover, CashFlow_adq, CashFlow_reinv, Patent REDUCT 1 Debt, LongCapital, Liquidity, Speed, InterestCoverage, AR_turnover, AR_days, Days, TotalAssetTurnover, CashFlow_adq, CashFlow_reinv, Patent REDUCT 2 Debt, LongCapital, Liquidity, Speed, InterestCoverage, AR_turnover, AR_days, Inventory, TotalAssetTurnover, CashFlow_adq, CashFlow_reinv, Patent
Number 11 12 12
(From 16 to 11 attributes: Simplified)
CORE and REDUCTs
15
Rules associated with “NetProfit H”
(Supports)
(InterestCoverage H) & (CashFlow_adq H) & (RD_exp M)
R1 (6)
(Speed H) & (CashFlow H) & (RD_exp M)
R2 (12)
(InterestCoverage H) & (CashFlow_adq M) & (RD_exp H)
R3 (10)
(Speed H) & (InterestCoverage H) & (AR_days M) & (Inventory M)
R4 (8)
Rules associated with “NetProfit L”
(Supports)
(TotalAssetTurnover L) & (CashFlow_adq L)
R5 (13)
(Liquidity L) & (TotalAssetYurnover L) & (Patents L)
R6 (10)
(Debt M) & (Liquidity M) & (InterestCoverage L) & (TotalAssetTurnover L)
R7 (9)
(LongCapital M) & (InterestCoverage L) & (CashFlow L)
R8 (15)
Strong Decision Rules
16
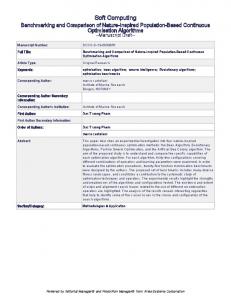
Conceptual Hierarchy Lattice
17
Premises (number of supporting alternatives) CF_H & CF_adq_M (5)==> CF_H & CF_adq_H & RD_exp_H (6)==>
Requirements Speed H InterestCoverage H
Rules R2/R4 R1/R3/R4
IntCov_M & Inventory_M (5)==>
AR_days M
R4
Speed_H & AR_days_M & CF_H (7)==>
Inventory M
R4
CF_adq_H (9)==>
CashFlow H
R2
IntCov_H & AR_days_M & Inventory_M & RD_exp_H (3)==> CashFlow_adq H CF_M (12)==> CashFlow_adq M IntCov_H CF_H CF_adq_H (6)==> RD_exp H Speed_M IntCov_M (4)==>
RD_exp M
R1/R2 R3 R3 R1/R2
Sources for improvements
FCA Implication Rules
18
• DRSA is capable to discern the FP of semiconductor companies • Obtain contextual knowledge regarding the conjoint effect of R&D on FP • • • •
DRSA decision rules (in contexts) CORE attributes FCA conceptual lattice FCA implication rules
Main Findings
19
Attribute Speed
Class (2010 & 2011) M
Required state (in rules) H (in R2)
InterestCoverage
M
H (in R1/R3/R4)
AR_days
H
M (in R4)
Inventory
L
M (in R4)
CashFlow
M
H (in R2)
CashFlow_adq
M
H (in R1)
R&D_exp
H
M (in R1/R2) and
H (in R3)
Satisfy R1
Illustration by using Taiwan Semiconductor (code: 5425)
20
• Main goals achieved • Explore the conjoint effect of R&D on FP • Pattern identification • Retrieved contextual knowledge • Guide improvement planning
• Limitations • Time period • Equal weight assumption of premises in each rule • Priority of performance gaps
• Identify source factors
Conclusion
21
~Thank you~ Presenter: Kao-Yi Shen Ph.D. Email:
[email protected] 22