It is designed for interactive applications and runs efficiently on the GPU. This is achieved ..... Care has to be taken for the two extremities, i.e., when lcurr is equal ...
Eurographics Symposium on Rendering (2007) Jan Kautz and Sumanta Pattanaik (Editors)
An Interactive Perceptual Rendering Pipeline using Contrast and Spatial Masking George Drettakis1 , Nicolas Bonneel1 , Carsten Dachsbacher1 , Sylvain Lefebvre1 , Michael Schwarz2 , Isabelle Viaud-Delmon3 1 REVES/INRIA
Sophia-Antipolis, 2 University of Erlangen, 3 CNRS-UPMC UMR 7593
Abstract We present a new perceptual rendering pipeline which takes into account visual masking due to contrast and spatial frequency. Our framework predicts inter-object, scene-level masking caused by partial occlusion and shadows. It is designed for interactive applications and runs efficiently on the GPU. This is achieved using a layer-based approach together with an efficient GPU-based computation of threshold maps. We build upon this prediction framework to introduce a perceptually-based level of detail control algorithm. We conducted a perceptual user study which indicates that our perceptual pipeline generates results which are consistent with what the user perceives. Our results demonstrate significant quality improvement for scenes with masking due to frequencies and contrast, such as masking due to trees or foliage, or due to high-frequency shadows.
1. Introduction Rendering algorithms have always been high consumers of computational resources. In an ideal world, rendering algorithms should only use more cycles to improve rendering quality, if the improvement can actually be perceived. This is the challenge of perceptually-based rendering, which has been the focus of much research over recent years. While this goal is somewhat self-evident, it has proven hard to actually use perceptual considerations to improve rendering algorithms. There are several reasons for this. First, understanding of the human visual system, and the resulting cognitive processes, is still limited. Second, there are few appropriate mathematical or computational models for those processes which we do actually understand. Third, even for models which do exist, it has proven hard to find efficient algorithmic solutions for interactive rendering. In particular, there exist computational models for contrast and frequency masking, in the form of visual difference predictors or threshold maps [Dal93, Lub95, RPG99]. These models were developed in the electronic imaging, coding or image quality assessment domains. As a consequence, raytracing-based algorithms, which are a direct algorithmic analogue of image sampling, have been able to use these models to a certain extent [BM98, RPG99, Mys98]. For interactive rendering however, use of these models has proven harder. c The Eurographics Association 2007.
To date, most solutions control level of detail for objects in isolation [LH01], or involve pre-computation for texture or mesh level control [DPF03]. In what follows, the term object corresponds typically to a triangle mesh. Contrast and spatial masking in a scene is often due to the interaction of one or a set of objects onto other objects. To our knowledge, no previous method is able to take these scene-level (rather than object-level) masking effects into account. Shadows are also a major source of visual masking; even though this effect has been identified [QM06], we are not aware of an approach which can use this masking effect to improve or control interactive rendering. Also, the cost of perceptual models is relatively high, making them unattractive for interactive rendering. Finally, since perceptual models have been developed in different contexts, it is unclear how well they perform for computer graphics applications, from the standpoint of actually predicting end-user perception of renderings. In this paper, we propose a first solution addressing the restrictions and problems described above. • First, we present a GPU-based perceptual rendering framework. The scene is split into layers, allowing us to take into account inter-object masking. Layer rendering and appropriate combinations all occur on the GPU, and are followed by the efficient computation of a threshold
Drettakis, Bonneel, Dachsbacher et al. / An Interactive Perceptual Rendering Pipeline
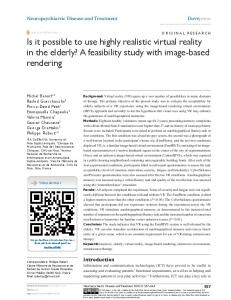
Figure 1: Left to right: The Gargoyle is masked by shadows from the bars in a window above the door; our algorithm chooses LOD l = 5 (low quality) which we show for illustration without shadow (second image). Third image: there is a lower frequency shadow and our algorithm chooses a higher LOD (l = 3), shown without shadow in the fourth image. The far right image shows the geometry of the bars casting the shadow.
map on the graphics processor. This results in interactive prediction of visual masking. • Second, we present a perceptually-driven level of detail (LOD) control algorithm, which uses the layers to choose the appropriate LOD for each object based on predicted contrast and spatial masking (Fig. 1). • Third, we conducted a perceptual user study to validate our approach. The results indicate that our algorithmic choices are consistent with the perceived differences in images. We implemented our approach within an interactive rendering system using discrete LODs. Our results show that for complex scenes, our method chooses LODs in a more appropriate manner compared to standard LOD techniques, resulting in higher quality images for equal computation cost. 2. Related Work
position of the input images, which attempts to model the detection mechanisms as they occur in the visual cortex. We will be using a simplified algorithm, introduced by Ramasubramanian et al. [RPG99] which outputs a threshold map, storing the predicted visibility threshold for each pixel. They perform a spatial decomposition where each level of the resulting contrast pyramid is subjected to CSF weighting and the pixel-wise application of a contrast masking function. The pyramid is collapsed, yielding an elevation factor map which describes the elevation of the visibility threshold due to spatial and contrast masking. Finally, this map is modulated by a TVI function. In computer graphics, these perceptual metrics have been applied to speed up off-line realistic image synthesis systems [BM98, Mys98, RPG99]. This is partly due to their rather high computational costs which only amortize if the rendering process itself is quite expensive. The metrics have further been adapted to incorporate the temporal domain, allowing for additional elevation of visibility thresholds in animations [MTAS01, YPG01]. Apart from image-space rendering systems, perceptual guidance has also been employed for view-independent radiosity solutions. For example, Gibson and Hubbold [GH97] used a simple perception-based metric to drive adaptive patch refinement, reduce the number of rays in occlusion testing and optimize the resulting mesh.
In electronic imaging and to a lesser degree in computer graphics, many methods trying to exploit or model human perception have been proposed. Most of them ultimately seek to determine the threshold at which a luminance or chromatic deviation from a given reference image becomes noticeable. In the case of luminance, the relation is usually described by a threshold-vs-intensity (TVI) function [FPSG96]. Moreover, the spatial frequency content influences the visibility threshold, which increases significantly for high frequencies. The amount of this spatial masking is given by a contrast sensitivity function (CSF). Finally, the strong phenomenon of contrast masking causes the detection threshold for a stimulus to be modified due to the presence of other stimuli of similar frequency and orientation.
One of the most complete models of visual masking was proposed by Ferwerda et al. [FPSG97]. Their model predicts the ability of textures to mask tessellation and flat shading artefacts. Trading accuracy for speed, Walter et al. [WPG02] suggested using JPEG’s luminance quantization matrices to derive the threshold elevation factors for textures.
Daly’s visual differences predictor (VDP) [Dal93] accounts for all of the above mentioned effects. The Sarnoff VDM [Lub95] is another difference detectability estimator of similar complexity and performance which operates solely in the spatial domain. Both Daly’s VDP and the Sarnoff VDM perform a frequency and orientation decom-
The local, object- or primitive-based nature of interactive and real-time rendering, has limited the number of interactive perception-based approaches. Luebke and Hallen [LH01] perform view-dependent simplification where each simplification operation is mapped to a worstcase estimate of induced contrast and spatial frequency. This c The Eurographics Association 2007.
Drettakis, Bonneel, Dachsbacher et al. / An Interactive Perceptual Rendering Pipeline
estimate is then subjected to a simple CSF to determine whether the operation causes a visually detectable change. However, due to missing image-space information, the approach is overly conservative, despite later improvements [WLC∗ 03]. Dumont et al. [DPF03] suggest a decisiontheoretic framework where simple and efficient perceptual metrics are evaluated on-the-fly to drive the selection of uploaded textures’ resolution, aiming for the highest visual quality within a given budget. The approach requires off-line computation of texture masking properties, multiple rendering passes and a frame buffer readback to obtain imagespace information. As a result, the applicability of these perceptual metrics is somewhat limited.
first render a small number of objects at a high LOD and use the threshold maps on the GPU to perform an efficient perceptual comparison to the current LODs. We use occlusion queries to communicate the results of these comparisons to the CPU, since they constitute the most efficient communication mechanism from the GPU to the CPU.
More recently, the programmability and computational power of modern graphics hardware allow the execution and acceleration of more complex perceptual models like the Sarnoff VDM on GPUs [WM04,SS07], facilitating their use in interactive or even real-time settings.
The goal of our perceptual rendering framework is to provide contrast and spatial masking information between objects in a scene. To perform an operation on a given object based on masking, such as controlling its LOD or some other rendering property, we need to compute the influence of the rest of the scene onto this object. We need to exclude this object from consideration, since if we do not, it will mask itself, and it would be hard to appropriately control its own LOD (or any other parameter).
Occlusion culling methods have some similarities with our approach, for example Hardly Visible Sets [ASVNB00] which use a geometric estimation of visibility to control LOD, while more recently occlusion-query based estimation of visibility has been used in conjunction with LODs [GBSF05]. In contrast, we use visual masking due to partial occlusion and shadows; masking is more efficient for the case of partial occlusion, while shadows are not handled at all by occlusion culling. 3. Overview of the Method To effectively integrate a perceptually-based metric of visual frequency and contrast masking into a programmable graphics hardware pipeline we proceed in two stages: a GPUbased perceptual rendering framework, which uses layers and predicts masking between objects, and an perceptuallybased LOD control mechanism. The goal of our perceptual framework is to allow the fast evaluation of contrast and spatial/frequency masking between objects in a scene. To do this, we split the scene into layers, so that the masking due to objects in one layer can be evaluated with respect to objects in all other layers. This is achieved by appropriately combining layers and computing threshold maps for each resulting combination. Each such threshold map can then be used in the second stage to provide perceptual control. One important feature of our framework is that all processing, i.e., layer rendering, combination and threshold map computation, takes place on the GPU, with no need for readback to the CPU. This results in a very efficient approach, well-adapted to the modern graphics pipeline. The second stage is a LOD control algorithm which uses the perceptual framework. For every frame, and for each object in a given layer, we use the result of the perceptual framework to choose an appropriate LOD. To do this, we c The Eurographics Association 2007.
We validate the choices of our perceptual algorithm with a perceptual user study. In particular, the goal of our study is to determine whether decisions made by the LOD control algorithm correspond to what the user perceives. 4. GPU-Based Perceptual Rendering Framework
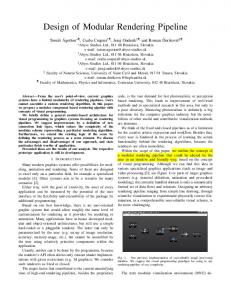
Our solution is to segment the scene into layers. Layers are illustrated in Fig. 2, left. To process a given layer i, we compute the combination Ci of all layers but i (Fig. 2, middle); the threshold map T Mi is then computed on the image of combination Ci (Fig. 2, right). Subsequently, objects contained in layer i can query the perceptual information of the combined layer threshold map T Mi . Our perceptual rendering framework is executed entirely on the GPU, with no readback. It has three main steps: layer rendering, layer combination and threshold map computation, which we describe next. Please see the description of threshold maps in Sect. 2 for a brief explanation of their functionality, and also [RPG99] for details. 4.1. Layer Generation and Rendering Layers are generated at each frame based on the current viewpoint, and are updated every frame. For a given viewpoint, we create a set of separating planes perpendicular to the view direction. These planes are spaced exponentially with distance from the viewer. Objects are then uniquely assigned to layers depending on the position of their centres. The first step of each frame involves rendering the objects of each layer into separate render targets. We also render a separate “background” layer (see Fig. 2). This background/floor object is typically modelled separately from all the objects which constitute the detail of the scene. This is necessary, since if we rendered the objects of each layer without the background, or sliced the background to the limits of each layer, we would have artificial contrast effects which would interfere with our masking computation. We store depth with each layer in the alpha channel since
Drettakis, Bonneel, Dachsbacher et al. / An Interactive Perceptual Rendering Pipeline GPU-based perceptual rendering framework
Layer rendering
Layer 0
Layer 1
Layer Combination (excludes i)
Per Layer Threshold Maps (excludes i)
C1
TM of C1
Figure 3: Left: A shadow “mask” is computed for each layer, and stored separately. This mask is used in the appropriate layer combination (right). C2
TM of C2
. . .
. . .
Layer 2
. . .
Layer n
TM of Cn
Cn
background
We create N − 1 combinations, where each combination Ci uses the layers 1, . . . , i − 1, i + 1, . . . , N containing the objects, and the i-th layer is replaced with the background. Note that we also use the shadow mask during combination. For the example of Fig. 3 (which corresponds to the scene of Fig. 1) the resulting combination is shown on the right.
Final Image
Figure 2: The Perceptual Rendering Framework. On the left we see the individual layers. All layers but i are combined with the background into combinations Ci (middle). A threshold map T Mi is then computed for each combination Ci (right). Lower right: final image shown for reference.
it is required during layer combination (see Sect. 4.2). This is necessary since objects in different layers may overlap in depth. The N images of the layers are stored on the GPU as textures Li for the layers with objects. We also treat shadows, since they can be responsible for a significant part of masking in a scene. We are interested in the masking of a shadow cast in a different layer onto the objects of the current layer i. See for example Fig. 1, in which the bars of the upper floor window (in the first layer) cast a shadow on the Gargoyle object which is in the second layer. Since we do not render the object in this layer, we render a shadow mask in a separate render target, using the multiple render target facility. We show this shadow mask in Fig. 3, left. 4.2. Layer Combination and Threshold Maps The next step is the combinations of layers Ci . This is done by rendering a screen-size quadrilateral with the layers assigned as textures, and combining them using a fragment program. The depth stored in the alpha channel is used for this operation.
Once the combinations have been created, we compute a threshold map [RPG99] using the approach described in [SS07] for each combination. The TVI function and elevation CSF are stored in look-up textures, and we use the mipmapping hardware to efficiently generate the Laplacian pyramids. The threshold map will give us a texture, again on the GPU, containing the threshold in luminance we can tolerate at each pixel before noticing a difference. We thus have a threshold map T Mi corresponding to the combination Ci (see Fig. 2). Note that the computation of the threshold map for combination Ci does not have the exact same meaning as the threshold map for the entire image. The objects in a layer obviously contribute to masking of the overall image, and in our case, other than for shadows, are being ignored. With this approach, it would seem that parts of the scene behind the current object can have an inappropriate influence on masking. However, for the geometry of the scenes we consider, which all have high masking, this influence is minor. In all the examples we tested, this was never problematic. We return to these issues in the discussion in Sect. 8. 4.3. Using the Perceptual Rendering Framework We now have the layers Li , combinations Ci and threshold maps T Mi , all as textures on the graphics card. Our perceptual framework thus allows rendering algorithms to make decisions based on masking, computed for the combinations of layers. A typical usage of this framework will be to perform an additional rendering pass and use this information to control rendering parameters, for example LOD. Despite the apparent complexity of our pipeline, the overhead of our approach remains reasonable. Specifically, the rendering of layers costs essentially as much as rendering c The Eurographics Association 2007.
Drettakis, Bonneel, Dachsbacher et al. / An Interactive Perceptual Rendering Pipeline
lworst = 7
...
lworse = 5
lcurr = 4
lbetter = 3
...
lbest = 1
Figure 4: Levels of the Gargoyle model, illustrating for lcurr = 4, and the values for lworst , lworse , lcurr , lbetter , lbest .
the scene and by combining all layers the final image is obtained. The additional overhead of combination and threshold maps is around 10–15 ms for 5 layers (see Sect. 7). The threshold map T Mi will typically be used when operating on objects of layer i. In the fragment program used to render objects of layer i, we use T Mi as a texture, thus giving us access to masking information at the pixels. For L layers, the total number of rendering passes is L (layer rendering) + L − 1 (combinations) + (L − 1) ∗ 9 (threshold maps). The combination and threshold map passes involve rendering a single quadrilateral.
Before describing the details of our approach, it is worth noting that we experimented with an approach which compares the current level with the next immediate LOD, which is obviously cheaper. The problem is that differences between each two consecutive levels are often similar in magnitude. Thus if we use a threshold approach as we do here, a cascade effect occurs, resulting in an abrupt decrease/increase to the lowest/highest LOD. This is particularly problematic when decreasing levels of detail. Comparing to a reference instead effects a cumulative comparison, thus avoiding this problem.
5.1. Initialization 5. Perceptually-Driven LOD Control Algorithm The ultimate goal of our perceptually-driven LOD control algorithm is to choose, for each frame and for each object, a LOD indistinguishable from the highest LOD, or reference. This is achieved indirectly by deciding, at every frame, whether to decrease, maintain or increase the current LOD. This decision is based on the contrast and spatial masking information provided by our perceptual rendering framework. There are two main stumbling blocks to achieve this goal. First, to decide whether the approximation is suitable, we should ideally compare to a reference high-quality version for each object at each frame, which would be prohibitively expensive. Second, given that our perceptual rendering pipeline runs entirely on the GPU, we need to get the information on LOD choice back to the CPU so a decision can be made to adapt LOD correctly. For the first issue, we start with an initialization step over a few frames, by effectively comparing to the highest quality LOD. In the subsequent frames we use a delayed comparison strategy and the layers to choose an appropriate high quality representation to counter this problem with lower computational overhead. For the second issue, we take advantage of the fact that occlusion queries are the fastest read-back mechanism from the graphics card to the CPU. We use this mechanism as a counter for pixels whose difference from the reference is above threshold. c The Eurographics Association 2007.
For each object in layer i, we first want to initialize the current LOD l. To do this, we process objects per layer. We use the following convention for the numbering of LODs: lworst , lworst − 1, . . . lbest . This convention is shown in Fig. 4, where lcurr = 4 for the Gargoyle model. To evaluate quality we use our perceptual framework, and the information in Li , Ci , and T Mi . We will be rendering objects at a high-quality LOD and comparing with the rendering stored in Ci . Before processing each layer, we render the depth of the entire scene so that the threshold comparisons and depth queries described below only occur on visible pixels. For each object in each layer, we render the object in lbest . In a fragment program we test the difference for each reference (lbest ) pixel with the equivalent pixel using lcurr , stored in Ci . If the difference in luminance is less than the threshold, we discard the pixel. We then count the remaining pixels Ppass , with an occlusion query, and send this information to the CPU. This is shown in Fig. 5. There are three possible decisions: increase, maintain or decrease LOD. We define two threshold values, TL and TU . Intuitively, TU is the maximum number of visibly different pixels we can tolerate before moving to a higher quality LOD, while if we go below TL different pixels, we can decrease the LOD. The exact usage is explained next. We decide to:
Drettakis, Bonneel, Dachsbacher et al. / An Interactive Perceptual Rendering Pipeline Per-Layer Perceptually-based LOD control
Test Rendering for Layer i
TM of Ci Ci
discard
-
TU . This indicates that the number of pixels for which we can perceive the difference between lcurr and lbest is greater than the “upper threshold” TU . Since we predict that the difference to the reference can be seen, we increase the LOD. • Maintain the current LOD if TL < Ppass < TU . This indicates that there may be some perceptible difference between lcurr and lbest , but it is not too large. Thus we decide that it is not worth increasing the LOD, but at the same time, this is not a good candidate to worsen the quality; the LOD is thus maintained. • Decrease the current LOD if Ppass < TL . This means that the difference to the reference is either non-existent (if Ppass = 0) or is very low. We consider this a good candidate for reduction of level of detail; in the next frame the LOD will be worsened. If this new level falls into the maintain category, the decrease in LOD will be maintained. Care has to be taken for the two extremities, i.e., when lcurr is equal to lbest or lworst . In the former case, we invert the sense of the test, and compare with the immediately worse level of detail, to decide whether or not to descend. Similarly, in the latter case, we test with the immediately higher LOD, to determine whether we will increase the LOD. LOD change Decrease Maintain Increase
Test lcurr to lbest lcurr to lbetter lcurr to lbest
Compare To Ref. 2 approx. To Ref.
Visible? N N Y
Table 1: Summary of tests used for LOD control. Decrease and increase involve a comparison to a “reference”, while maintain compares two approximations. Our algorithm predicts the difference to the reference as not visible for the decrease and maintain decisions, it predicts the difference as being visible when deciding to increase.
5.2. LOD Update To avoid the expensive rendering of lbest at each frame, we make two optimizations. First, for each layer we define a
layer-specific highest LOD lHQ which is lbest for layer 1, lbest + 1 (lower quality) for layer 2 etc. Note that layers are updated at every frame so these values adapt to the configuration of the scene. However, if an object in a far layer does reach the original lHQ , we will decrease the value of lHQ (higher quality). The above optimization can be seen as an initialization using a distance-based LOD; in addition, we reduce the LOD chosen due to the fact that we expect our scenes to have a high degree of masking. However, for objects which reach lHQ , we infer that masking is locally less significant, and allow its LOD to become higher quality. Second, we use a time-staggered check for each object. At every given frame, only a small percentage of objects is actually rendered at lHQ , and subsequently tested. To do this, at every frame, we choose a subset S of all objects O where size(S) � size(O). Note that for the depth pass, objects which are not tested in the current frame are rendered at the lowest level of detail, since precise depth is unnecessary. For each layer Li , and each object of O of Li which is in S, we perform the same operation as for the initialization but comparing to lHQ instead of the lbest . The choice to increase, maintain or decrease LOD is thus exactly the same as that for the initialization (Sect. 5.1). 6. Perceptual User Test The core of our new algorithm is the decision to increase, decrease or maintain the current LOD lcurr at a given frame, based on a comparison of the current level lcurr to an appropriate reference lHQ . The threshold map is at the core of our algorithm making this choice; it predicts that for a given image, pixels with luminance difference below threshold will be invisible with a probability of 75%. Our use is indirect, in the sense that we count the pixels for which the difference to the reference is greater than threshold, and then make a decision based on this count. The goal of our perceptual tests is to determine whether our algorithm makes the correct decisions, i.e., when the pipeline predicts a difference to be visible or invisible, the user respectively perceives the difference or not. 6.1. General Methodology The scene used in the test is a golden Gargoyle statue rotating on a pedestal in a museum room (see Fig. 1 and Fig. 6). The object can be masked from shadows cast by the bars of the window above, or the gate with iron bars in the doorway (Fig. 1; see the video for an example with bars). The parameters we can modify for each configuration are the frequency of the masker (bars, shadows), and the viewpoint. Throughout this section, it is important to remember how the LOD control mechanism works. At each frame, the image is rendered with a given viewpoint and masking configuration. For this configuration, the algorithm chooses a LOD c The Eurographics Association 2007.
Drettakis, Bonneel, Dachsbacher et al. / An Interactive Perceptual Rendering Pipeline
lcurr . Note that in what follows, the highest quality LOD used is level l1 and the lowest is l6 . We will test the validity of the decision made by our algorithm to increase, maintain and decrease the LOD. For a given configuration of lcurr , we need to compare to some other configuration, which occurred in a previous frame. From now on, we use the superscript to indicate the lcurr value under consideration. For example, all test images for the case lcurr = 4 are indicated as l54 , l44 , l34 , l14 (see also Fig. 6). We use a bold subscript for easier identification of the level being displayed. For example, l54 , is the image obtained if level 5 is used for display, whereas our algorithm has selected level 4 as current. Note that the li notation usually refers to the actual LOD, rather than a specific image.
l54
l14
l44
l34
l34
l14
Based on Table 1, we summarize the specific tests performed for the different values of lcurr in Table 2. Please refer to these two tables to follow the discussion below. lcurr l33 l44 l55 l66
Decrease (I) l23 /l13 l34 /l14 l45 /l15 l56 /l16
Maintain (I) l33 /l23 l44 /l34 l55 /l45 l66 /l56
Increase (V) l43 /l13 l54 /l14 l65 /l15 l76 /l16
Table 2: Summary of the comparisons made to validate the decisions of our algorithm.
Consider the case of lcurr = 4 (see 2nd row of Table 2). For the case of increasing the LOD, recall that the number of pixels of the image l54 (lower quality) which are different from l14 is greater than TU . The algorithm then decided that it is necessary to increase the level of detail to l4 . To test the validity of this decision we ask the user whether they can see the difference between l54 (lower quality) and l14 . If the difference is visible, we consider that our algorithm made the correct choice, since our goal is to avoid visible differences from the reference. A pair of images shown in the experiment for this test is shown in Fig. 6 (top row). † For the case of maintaining the LOD, the number of pixels Ppass of l4 which are different from l1 is greater than the TL , and lower than TU . To validate this decision, we ask the user whether the difference between l44 and l34 (better quality) is visible. We consider that the correct decision has been made if the difference is invisible. Note that in this case we perform an indirect validation of our pipeline. While for increase and decrease we evaluate the visibility of the actual test performed (i.e., the current approximation with the reference), for “maintain”, we compare two approximations as an
† In print, the images are too small. Please zoom the electronic version so that you have 512×512 images for each case; all parameters were calibrated for a 20" screen at 1600×1200 resolution. c The Eurographics Association 2007.
Figure 6: Pairs of images used to validate decisions for lcurr = 4. Top row: decision to increase: compare l54 to l14 . Middle row: decision to maintain: compare l44 to l34 . Lower row: decision to decrease: compare l34 to l14 .
indirect validation of the decision. A pair of images shown in the experiment for this test is shown in Fig. 6 (middle row). Finally, our method decided to decrease the LOD to l4 when the difference of l34 (higher quality) with l14 is lower than TL . We directly validate this decision by asking whether the user can see the difference between l34 and l14 . If the difference is invisible we consider the decision to be correct, since using l3 would be wasteful. A pair of images shown in the experiment for this test is shown in Fig. 6 (last row). We loosely base our experiment on the protocol defined in the ITU-R BT.500.11 standard [ITU02]. We are doing two types of tests, as defined in that standard: comparison to reference for the increase/decrease cases, and a quality comparison between two approximations for the maintenance of the current level. The ITU standard suggests using the doublestimulus continuous quality scale (DCSQS) for comparisons
Drettakis, Bonneel, Dachsbacher et al. / An Interactive Perceptual Rendering Pipeline
lcurr l3 l4 l5 l6
Figure 7: Left: A screenshot of the experiment showing a comparison of two levels and the request for a decision. Right: One of the users performing the experiment.
decrease 78.4% 78.4% 72.7% 32.9%
maintain 80.6% 84,0% 31.8% 61.3%
increase 32.9% 76.1% 80.6% 71.5%
Table 3: Success rate for the experimental evaluation of our LOD control algorithm. The table shows the percentage of success for our prediction of visibility of the change in LOD, according to our experimental protocol.
to reference and the simultaneous double stimulus for continuous (SDSCE) evaluation method for the comparison of two approximations. We have chosen to use the DCSQS methodology, since our experience shows that the hardest test is that where the difference in stimuli has been predicted to be visible, which is the case when comparing an approximation to the reference. In addition, two out of three tests are comparisons to reference (see Table 1); We thus prefer to adopt the recommendation for the comparison to a reference. 6.2. Experimental Procedure The subject sits in front of a 20" LCD monitor at a distance of 50 cm; the resolution of the monitor is 1600×1200. The stimuli are presented on a black background in the centre of the screen in a 512×512 window. We generate a set of pairs of sequences, with the object rendered at two different levels of detail. The user is then asked to determine whether the difference between the two sequences is visible. Each sequence shows the Gargoyle rotating for 6 s, and is shown twice, with a 1 s grey interval between them. The user can vote as soon as the second 6 s period starts; after this, grey images are displayed until the user makes a selection. Please see the accompanying video for a small example session of the experiment. We perform one test to assess all three decisions, with four different levels for lcurr . We thus generate 12 configurations of camera viewpoint and masker frequency (see Tab. 2). The masker is either a shadow or a gate in front of the object. For each configuration, lcurr is the current level chosen by the algorithm. We then generate 4 sequences using lcurr , lworse , lbetter and lbest . We show an example of such a pair, as seen on the screen, with the experiment interface in Fig. 7. The subject is informed of the content to be seen. She is told that two sequences will be presented, with a small grey sequence between, and that she will be asked to vote whether the difference is visible or not. The subject is additionally instructed that there is no correct answer, and to answer as quickly as possible. The subject is first shown all levels of detail of the Gargoyle. The experiment then starts with a
Figure 8: Graph of results of the perceptual user test. training session, in which several “obvious” cases are presented. These are used to verify that the subject is not giving random answers. The pairs are randomized and repeated twice with the gate and twice with shadows for each condition, and on each side of the screen inverted randomly. A total of 96 trials are presented to the user, resulting in an average duration of the experiment of about 25 minutes. We record the test and the answer, coded as true or false, and the response time. 6.3. Analysis and Results We ran the experiment on 11 subjects, all with normal or corrected to normal vision. The subjects were all members of our labs (3 female, 8 male), most of them naive about the goal of the experiment. The data are analysed in terms of correspondence with the decision of the algorithm. We show the average success rate for each one of the tests in Table 3. We analysed our results using statistical tests, to determine the overall robustness of our approach, and to determine which factors influenced the subjects decisions. We are particularly interested in determining potential factors leading to incorrect decisions, i.e., the cases in which the algorithms does not predict what the user perceives. Analysis of variance for repeated measures (ANOVA), with Scheffé post-hoc tests, was used to compare the scores across the different conditions. We performed an ANOVA with decisions, i.e., decrease, maintain and increase (3), levels of details (4) and scenes, i.e., shadows or a gate (2), as within-subjects factors on similarity with algorithm scores. The results showed a main effect of LOD (F(3, 129) = 14.32, p < 0.000001), as well as an interaction between c The Eurographics Association 2007.
Drettakis, Bonneel, Dachsbacher et al. / An Interactive Perceptual Rendering Pipeline
the factors decisions and LODs (F(6, 258) = 23.32, p < 0.0000001). There was no main effect of the factor scene, nor any interaction involving it, showing that shadows or gate present the same decision problems for the algorithm. Scheffé post-hoc tests were used to identify exactly which LOD differed from any of the other LOD according to the decision. In the decrease decision, the scores for lcurr = 6 are different from all the scores of the other levels in this decision (l3 : p < 0.0001; l4 : p < 0.0001; l5 : p < 0.002). This is to be expected, since the test with LOD 6 is not in agreement with the subject’s perception (only 33% success rate). While the comparison with lbest is predicted by the algorithm to be invisible, the subjects perceive it most of the time. In the maintain decision, the test for LOD 5 is significantly different from the tests where lcurr is 4 (p < 0.00001) and 3 (p < 0.000001). In this test, the comparison between l55 and l45 is predicted to be invisible. However, it is perceived by the subject in almost 70% of the cases. Looking at Table 2, we can see that both the decrease decision for LOD 6 and the maintain decision for LOD 5 involve a comparison of level 5 (even though the images are different). For decrease at LOD 6 we compare l56 to l16 and for maintain at LOD 5, we compare l55 to l45 . This is due to the “perceptual non-uniformity” of our LOD set; the difference of l5 from l4 is much easier to detect overall (see Fig. 4). This indicates the need for a better LOD construction algorithm which would be “perceptually uniform”. Finally, post-hoc tests show that in the increase decision, the test for l3 is significantly different from the test involving the other LODs, indicating that this test is not completely in agreement with the subject’s perception (l4 : p < 0.001; l5 : p < 0.0001; l6 : p < 0.01). The algorithm predicts the difference between l43 and l13 to be visible; however, this difference is harder to perceive than the difference for the lower quality LODs, and hence the user test shows a lower success rate. This result is less problematic, since it simply means that the algorithm will simply be conservative, since a higher LOD than necessary will be used. Overall the algorithm performs well with an average success rate of 65.5%. This performance is satisfactory, given that we use the threshold map, which reports a 75% probability that the difference will be visible. If we ignore the cases related to level 5, which is problematic for the reasons indicated above, we have a success rate of 71%. We think that this level of performance is a very encouraging indicator of the validity of our approach.
7. Implementation and Results Implementation. We have implemented our pipeline in the Ogre3D rendering engine [Ogr], using HLSL for the shaders. The implementation follows the description provided above; specific render targets are defined for each step c The Eurographics Association 2007.
Figure 9: General views of the three complex test scenes: Treasure, Forest and House. Model Ornament Column Bars Gargoyle Poseidon Pigasos Lionhead Raptor
l0 l1 l2 l3 House and Treasure scenes 200K 25K 8K 5K 39K 23K 7K 3K 1K 5K 10K 30K 300K 50K 5K 500 200K 100K 50K 10K 130K 50K 10K 1K 200K 100K 50K 20K Forest scene 300K 100K 25K 10K
l4
l5
1K 2K
3K
1K
5K
1K
1K
500
Table 4: LODs and polygon counts for the examples. such as layer rendering, combinations, threshold map computation and the LOD control pass. Ogre3D has several levels of abstraction in its rendering architecture, which make our pipeline suboptimal. We believe that a native DirectX or OpenGL implementation would perform better. Results. We have tested our pipeline on four scenes. The first is the Museum scene illustrated previously. In the video we show how the LODs are changed depending on the frequency of the gate bars or the shadows (Fig. 1). We also tested on three larger scenes. For all tests reported here, and for the accompanying video, we use 5 layers and a delay in lHQ testing which is 4 frames multiplied by the layer number. Thus objects in layer 2, for example, will be tested every eighth frame. We use 512×512 resolution with TU = 450 and TL = 170. The first scene is a Treasure Chamber (Fig. 9, left), and we have both occlusion and shadow masking. The second scene (Fig. 9, middle) is a building with an ornate facade, loosely based on the Rococo style. Elements such as statues, wall ornaments, columns, balcony bars, the gargoyles, etc. are complex models with varying LODs for both. For the former, masking is provided by the gates and shadows, while for the latter masking is provided by the partial occlusion caused by the trees in front of the building and shadows from the trees. Table 4 lists the details of these models for each scene. The two rightmost images of Fig. 10 and Fig. 12 illustrate the levels of detail chosen by our algorithm compared to the distance-based approach for the same configuration. We can see that the distance-based approach maintains the partially visible, but close-by, objects at high levels of detail while our
Drettakis, Bonneel, Dachsbacher et al. / An Interactive Perceptual Rendering Pipeline
approach maintains objects which do not affect the visual result at a lower level. The third scene is a forest-like environment (Fig. 9, right). In this scene, the dinosaurs have 6 levels of detail (see Table 4). Trees are a billboard-cloud representations with a low polygon count, but do not have levels of detail. In Fig. 12 (mid-right), we show the result of our algorithm. As we can see, the far dinosaur is maintained at a high level. The trees hide a number of dinosaurs which have an average visibility of 15% (i.e., the percentage of pixels actually rendered compared to those rendered if the object is displayed in isolation with the same camera parameters). On the far right, we see the choice of the standard distance-based Ogre3D algorithm, where the distance bias has been adjusted to give approximately the same frame rate as our approach. In terms of statistics for the approach, we have measured the average LOD used across an interactive session of this scene. We have also measured the frequency of the LOD used as lHQ . This is shown in Fig. 11; in red we have the lHQ and in blue the levels used for display. Table 5 shows the statistics. LOD
0
1
Ctrl Rndr
16325 7623
3477 4991
Ctrl Rndr
5249 6954
1763 3140
Ctrl Rndr
44 306
431 39
2
3 Treasure 2596 12374 70067 1285 House 526 1141 27091 3260 Forest 1 6424 56 145
4
5
Total
3219 53371
1512 21395
39503 158732
1 360
60 5038
8740 45843
85 69932
6985 70478
Table 5: Number of renderings overall for each LOD in the two test scenes over fixed paths (252, 295 and 186 frames respectively; see video for sequences). “Ctrl” is the number of renderings of lHQ in the LOD control pass, while “Rndr” are those used for display. Total shows total number of renderings and the percentage of Ctrl vs. Rndr. The total number of lHQ rendering operations is much lower (10–20%) than the total number of times the objects are displayed. We can also see that objects are rendered at very low level of detail most of the time. We have also analysed the time used by our algorithm for each step. The results are shown in Table 6. All timings
Scene Treasure House Forest
tot. (FPS) 40.3 (24.8) 31.5 (31.7) 52.4 (19.0)
L 11.3 8.5 10.2
C 1.4 2.0 1.7
TM 9.7 13.0 16.5
D 6.4 6.8 5.2
LC 11.6 1.2 18.8
Table 6: Running times for each stage. L: rendering of the layers, C: combinations, TM: threshold map computation, D: depth pass and LC: LOD control pass (rasterization and occlusion query). All times in milliseconds.
are on a dual-processor Xeon at 3 GHz with an NVIDIA GeForce 8800GTX graphics card. The cost of rendering the scene with the levels of detail chosen by our perceptual pipeline is around 10 ms for all scenes. For the Forest and Treasure scene, the dominant cost (46% and 68% respectively) is in the depth pass and the LOD control, i.e., the rendering of objects in lHQ . For the House scene, this cost is lower (25%). However, the gain in quality compared to an equivalent expense distance-based LOD is clear. The cost of the threshold map should be constant; however, the Ogre3D implementation adds a scene-graph traversal overhead for each pass, explaining the difference in speed. We believe that an optimized version should reduce the cost of the threshold map to about 6 ms for all scenes.
8. Discussion and Issues Despite these encouraging results, there are a number of open issues, which we consider to be exciting avenues for future work. Currently our method has a relatively high fixed cost. It would be interesting to develop a method which estimates the point at which it is no longer worth using the perceptual pipeline and then switch to standard distance-based LOD. Periodic tests with the perceptual pipeline could be performed to determine when it is necessary to switch back to using our method, but attention would have to be paid to avoid “stagger” effects. Our approach does display some popping effects, which is the case for all discrete LOD methods. We could apply standard blending approaches used for previous discrete LOD methods. Also, in the images shown here we do not perform antialiasing. It would be interesting to investigate this in a more general manner, in particular taking into account the LODs chosen based on image filtering. The choice of layers can have a significant influence on the result; more involved layer-generation method may give better results. The remaining open issues are perceptual. The first relates to the thresholds used for LOD control. We currently fix the values of TU and TL manually, for a given output resolution. For all complex scenes we used 512×512 output resolution, and values of TU = 450 and TL = 170. We find it encouraging that we did not have to modify these values to obtain the results shown here. However, perceptual tests could be conducted to see the influence of these parameters, and determine an optimal way of choosing them. The second issue is the fact that the “threshold map” we use does not take the current layer into account, thus the overall masking of the final image is not truly captured. Again, perceptual tests are required to determine whether this approximation does influence the performance of our approach. Finally, the perceptual test should be performed on more diverse scenes to confirm our findings. c The Eurographics Association 2007.
Drettakis, Bonneel, Dachsbacher et al. / An Interactive Perceptual Rendering Pipeline
Figure 10: From left to right: Treasure scene using our algorithm; next, the same scene using distance-based LOD. Notice the difference in quality of the large Poseidon statues in the back. Leftmost two images: The levels of detail chosen by each approach for our method and distance based LOD respectively; LODs coded as shown in the colour bar. (The system is calibrated for 512×512 resolution images on a 20" screen; please zoom for best results). 9. Conclusions We have presented a novel GPU-based perceptual rendering framework, which is based on the segmentation of the scene into layers and the use of threshold map computation on the GPU. The framework is used by a perceptually-driven LOD control algorithm, which uses layers and occlusion queries for fast GPU to CPU communication. LOD control is based on an indirect perceptual evaluation of visible differences compared to an appropriate reference, based on threshold maps. We performed a perceptual user study, which shows that our new perceptual rendering algorithm has satisfactory performance when compared to the image differences actually perceived by the user.
be the case that the instability of LOD control caused by self-masking is minor, and thus the benefit from layers no longer justifies their overhead, resulting in a much faster and higher quality algorithm. Although supplemental perceptual validation would be required, we believe that the main ideas developed hold for a single layer. We could also include spatio-temporal information [YPG01] to improve the perceptual metric. Other possible directions include investigating extensions of our approach to other masking phenomena, due for example to reflections and refractions, atmospheric phenomena etc. We will also be investigating the use of the pipeline to control continuous LOD approaches on-line, or to generate perceptually uniform discrete levels of detail.
400,0
100,0 80000
90,0 70000
LODs rendered Control LODs
60000
350,0
Control LODs LODs rendered
70,0
250,0
200,0
50,0
40000
Acknowledgments
300,0
Control LODs
60,0
50000
LODs rendered
80,0
40,0
150,0
30000
30,0 100,0
20000
20,0 10000
50,0
10,0
0,0
0,0
0 1
2
3
4
5
6
Treasure Scene
7
1
2
3
4
5
House Scene
6
7
1
2
3
4
5
6
Forest Scene
Figure 11: In blue the average number of renderings for the objects over an interactive session for each LOD (horizontal axis). In red the statistics for lHQ .
To our knowledge, our method is the first approach which can interactively identify inter-object visual masking due to partial occlusion and shadows, and can be used to improve an interactive rendering pipeline. In addition, we do not know of previous work on interactive perceptual rendering which reported validation with perceptual user tests. We are convinced that such perceptually based approaches have high potential to optimize rendering algorithms, allowing the domain to get closer to the goal of “only render at as high a quality as perceptually necessary”. In future work, we will consider using the same algorithm with a single layer only. For complex environments, it may c The Eurographics Association 2007.
This research was funded by the EU FET Open project IST014891-2 CROSSMOD (http://www.crossmod.org). C. Dachsbacher received a Marie-Curie Fellowship “ScalableGlobIllum” (MEIF-CT-2006-041306). We thank Autodesk for the donation of Maya. Thanks go to D. Geldreich, N. Tsingos, M. Asselot, J. Etienne and J. Chawla who participated in earlier attempts on this topic. Finally, we thank the reviewers for their insightful comments and suggestions. References [ASVNB00] A NDÚJAR C., S AONA -V ÁZQUEZ C., NAVAZO I., B RUNET P.: Integrating occlusion culling and levels of detail through hardly-visible sets. Computer Graphics Forum 19, 3 (August 2000), 499–506. [BM98] B OLIN M. R., M EYER G. W.: A perceptually based adaptive sampling algorithm. In Proc. of ACM SIGGRAPH 98 (July 1998), pp. 299–309. [Dal93] DALY S. J.: The visible differences predictor: An algorithm for the assessment of image fidelity. In Digital Images and Human Vision, Watson A. B., (Ed.). MIT Press, 1993, ch. 14, pp. 179–206.
Drettakis, Bonneel, Dachsbacher et al. / An Interactive Perceptual Rendering Pipeline
Figure 12: From left to right: House with our approach, followed by distance-based LOD at equivalent frame rate. Notice the difference in quality of statues inside the door. Next, the Forest scene with our approach, followed by the equivalent frame rate distance-based rendering. Notice difference in quality of the raptor in the back.
[DPF03] D UMONT R., P ELLACINI F., F ERWERDA J. A.: Perceptually-driven decision theory for interactive realistic rendering. ACM Trans. on Graphics 22, 2 (Apr. 2003), 152–181. [FPSG96] F ERWERDA J. A., PATTANAIK S. N., S HIRLEY P., G REENBERG D. P.: A model of visual adaptation for realistic image synthesis. In Proc. of ACM SIGGRAPH 96 (Aug. 1996), pp. 249–258. [FPSG97] F ERWERDA J. A., PATTANAIK S. N., S HIRLEY P., G REENBERG D. P.: A model of visual masking for computer graphics. In Proc. of ACM SIGGRAPH 97 (Aug. 1997), pp. 143–152. [GBSF05] G RUNDHOEFER A., B ROMBACH B., S CHEIBE R., F ROEHLICH B.: Level of detail based occlusion culling for dynamic scenes. In GRAPHITE ’05 (New York, NY, USA, 2005), ACM Press, pp. 37–45. [GH97] G IBSON S., H UBBOLD R. J.: Perceptually-driven radiosity. Computer Graphics Forum 16, 2 (1997), 129– 141. [ITU02] ITU: Methodology for the subjective assessment of the quality of television pictures. ITU-R Recommendation BT.500-11 (2002). [LH01] L UEBKE D., H ALLEN B.: Perceptually driven simplification for interactive rendering. In Proc. of EG Workshop on Rendering 2001 (June 2001), pp. 223–234. [Lub95] L UBIN J.: A visual discrimination model for imaging system design and evaluation. In Vision Models for Target Detection and Recognition, Peli E., (Ed.). World Scientific Publishing, 1995, pp. 245–283. [MTAS01] M YSZKOWSKI K., TAWARA T., A KAMINE H., S EIDEL H.-P.: Perception-guided global illumination solution for animation rendering. In Proc. of ACM SIGGRAPH 2001 (Aug. 2001), pp. 221–230.
[Ogr] OGRE 3D: Open source graphics engine. http:// www.ogre3d.org/. [QM06] Q U L., M EYER G. W.: Perceptually driven interactive geometry remeshing. In Proc. of ACM SIGGRAPH 2006 Symposium on Interactive 3D Graphics and Games (Mar. 2006), pp. 199–206. [RPG99] R AMASUBRAMANIAN M., PATTANAIK S. N., G REENBERG D. P.: A perceptually based physical error metric for realistic image synthesis. In Proc. of ACM SIGGRAPH 99 (Aug. 1999), pp. 73–82. [SS07] S CHWARZ M., S TAMMINGER M.: Fast perception-based color image difference estimation. In ACM SIGGRAPH 2007 Symposium on Interactive 3D Graphics and Games Posters Program (May 2007). [WLC∗ 03] W ILLIAMS N., L UEBKE D., C OHEN J. D., K ELLEY M., S CHUBERT B.: Perceptually guided simplification of lit, textured meshes. In Proc. of ACM SIGGRAPH 2003 Symposium on Interactive 3D Graphics and Games (Apr. 2003), pp. 113–121. [WM04] W INDSHEIMER J. E., M EYER G. W.: Implementation of a visual difference metric using commodity graphics hardware. In Proc. of SPIE (June 2004), vol. 5292 (Human Vision and Elec. Imaging IX), pp. 150– 161. [WPG02] WALTER B., PATTANAIK S. N., G REENBERG D. P.: Using perceptual texture masking for efficient image synthesis. Computer Graphics Forum 21, 3 (Sept. 2002), 393–399. [YPG01] Y EE H., PATTANAIK S., G REENBERG D. P.: Spatiotemporal sensitivity and visual attention for efficient rendering of dynamic environments. ACM Trans. on Graphics 20, 1 (Jan. 2001), 39–65.
[Mys98] M YSZKOWSKI K.: The Visible Differences Predictor: applications to global illumination problems. In Proc. of EG Workshop on Rendering 1998 (June 1998), pp. 223–236. c The Eurographics Association 2007.