was motivated by the need to bring the current Zimbabwean mathematics ..... which includes a study of the historical development of the function concept, some.
AN INVESTIGATION INTO THE DEVELOPMENT OF THE FUNCTION CONCEPT THROUGH A PROBLEMCENTRED APPROACH BY FORM 1 PUPILS IN ZIMBABWE by
RUDO KWARI submitted in fulfillment of the requirements for the degree of
MASTERS OF EDUCATION With specialization in
MATHEMATICS EDUCATION at the
UNIVERSITY OF SOUTH AFRICA
SUPERVISOR: PROF DCJ WESSELS FEBRUARY 2007
Student number:
3194-645-3
I declare that
AN INVESTIGATION INTO THE DEVELOPMENT OF THE FUNCTION CONCEPT THROUGH A PROBLEM-CENTRED APPROACH BY FORM 1 PUPILS IN ZIMBABWE is my own work and that all the sources that I have used or quoted have been indicated and acknowledged by means of complete references.
__________________________
__________________
Rudo Kwari
Date
ii
SUMMARY In the school mathematics curriculum functions play a pivotal role in accessing and mastering algebra and the whole of mathematics. The study investigated the extent to which pupils with little experience in algebra would develop the function concept and was motivated by the need to bring the current Zimbabwean mathematics curriculum in line with reform ideas that introduce functions early in the secondary school curriculum. An instrument developed from literature review was used to assess the extent to which the Form1/Grade 8 pupils developed the concept. The teaching experiment covered a total of 26 lessons, a period of about eight weeks spread over two terms starting in the second term of the Zimbabwean school calendar. The problem-centred teaching approach based on the socio-constructivist view of learning formed the background to facilitate pupils’ individual and social construction of knowledge. Data was collected from the pupils’ written work, audio taped discussions and interviews with selected pupils. The extent to which each pupil of the seven pupils developed the aspects of function, change, relationship, rule, representation and strategies, was assessed. The stages of development and thinking levels of functional reasoning at the beginning of the experiment, then during the learning phase and finally at the end of the experiment, were compared. The results showed that functions can be introduced at Form 1 and pupils progressed in the understanding of most of the aspects of a function. Key words: Function concept, functional reasoning, pre-algebra, change, relationship, rule, representation, strategy, language, problem-centred context.
iii
OPSOMMING Funksies speel ‘n sentrale rol in die toegang tot en bemeestering van skool algebra en wiskunde in die geheel. Die studie is ondersoek tot watter mate leerders met min ondervinding in algebra die funksie-konsep beheers. Die motivering was gedryf deur die behoefte om die huidige Zimbabwiese wiskunde kurrikulum in lyn te bring met hervormingsidees om funksies vroeg in die junior sekondêre skool aan te bied. ‘n Instrument is vanuit die literatuurondersoek ontwikkel waarmee aangedui is tot watter mate die Vorm 1/Graad 8 leerders die funksie-konsep ontwikkel het. In die onderrigeksperiment is 26 lesse oor ‘n tydperk van agt weke aangebied. Dit was versprei oor die tweede
en
derde
kwartale
van
die
Zimbabwiese
skooljaar
begin.
Die
probleemgesentreerde onderrigbenadering wat gebaseer is op die sosio-konstruktivistiese benadering van leer, is gebruik om die konstruksie van kennis deur individue en groepe te fasiliteer. Data van die projek bestaan uit leerders se geskrewe werk, asook klankopnames van besprekings en onderhoude met sekere leerders. Die mate waarin elk van die sewe leerders die onderskeie aspekte van ‘n funksie, naamlik verandering, relasies, reëls, voorstelling en strategieë bemeester het, is vergelyk. Resultate wys dat funksies op Vorm 1 vlak aangebied kan word en dat leerders progressiewe vordering gemaak het in die aanleer van die meeste van die aspekte van ‘n funksie.
Sleutelterme: Funksie-konsep, funksionele beredenering, pre-algebra, verandering, relasies, reels, voorstelling, strategie, taal, probleemgesentreerde konteks.
iv
ACKNOWLEDGEMENTS I wish to thank the following people and institutions for their support: •
My supervisor, Prof Dirk Wessels for his unwavering support and encouragement; for the professional and academic guidance in developing, writing, proof reading and putting together the dissertation ; providing much needed resources; for sourcing the financial support.
•
Dr. Helena Wessels for welcoming me into their home and her warm hospitality.
•
The National Research Foundation for all the financial support.
•
My sister and her husband, Bester and Tennyson Chimbo, their children Simbarashe, Tariro and Mutsa for accommodating me in their home, providing much needed moral and material support.
•
My nephew, Trevor Patsanza for transcribing most of my data.
•
My friend, Dr. Pauline Vos, for the laptop and literature.
•
My husband, Francis Borgia Kwari, for his love, support and encouragement; for proof reading my work and making constructive criticisms and looking after the home during my absence.
•
My children, Kudakwashe, Shingirayi and Tazvipedza for their encouragement.
•
My friend, Tony Makina for all the academic support.
•
Mutare Teachers’ College administration for allowing time off for consultations and to submit.
•
Dr.DM Mtetwa and the Zimbabwe SAARMSTE Chapter for helping me develop skills in research.
•
Mr. Kasambira, my workmate in the Computer Studies Department for manning the department during my absence.
v
The financial assistance of the National Research Foundation (NRF) of South Africa (GUN Numbers 2050502 and 2053491) and the role of the Spatial Orientation and Spatial Insight Research Group (SOSI) at Unisa is hereby acknowledged. Any opinions, findings and conclusions or recommendations are those of the author and do not necessarily reflect the views of the supporting organizations.
vi
CHAPTER ONE INTRODUCTION AND OVERVIEW 1.1 1.2 1.3 1.4 1.5 1.6 1.7 1.8 1.9 1.10
INTRODUCTION BACKGROUND AND MOTIVATION PROBLEM STATEMENT AIMS METHODOLOGY SIGNIFICANCE OF THE STUDY LIMITATIONS DELIMITATION DEFINITION OF KEY TERMS LAYOUT OF THE DISSERTATION
1 1 5 5 6 6 7 8 8 9
CHAPTER TWO A CONTEXTUAL ANALYSIS OF THE MATHEMATICAL FUNCTION 2.1 2.2
INTRODUCTION THE DEVELOPMENT OF THE MATHEMATICAL FUNCTION 2.2.1 The evolution of the notion of the mathematical function 2.2.2 The constitutive elements of the function concept
2.2.2.1 2.2.2.2 2.2.2.3
World of changes World of relationships Rules or laws or patterns that define the relationships
2.2.3 Views on conceptions and stages/levels of development of the function concept 2.3 APPROACHES TO FUNCTIONS IN THE SECONDARY SCHOOL CURRICULUM 2.3.1 Introducing functions at the pre-algebra stage 2.3.2 The role of meaningful contexts 2.3.2.1 2.3.2.2 2.3.2.3 2.3.2.4
2.3.3
The pattern approach The input–output approach The word problem approach The role of multiple representations
Teaching functions through the problem-centred approach
10 11 11 14 15 16 18 20 26 27 28 30 31 32 34 36
vii
2.4
CONCLUSION
37
CHAPTER THREE RESEARCH METHODOLOGY AND DESIGN 3.1 3.2 3.3 3.3.1 3.3.2 3.4 3.4.1 3.4.2 3.4.3 3.4.3.1 3.4.3.2 3.4.3.3
3.5 3.6 3.6.1 3.6.2 3.7 3.8 3.9
INTRODUCTION THE RESEARCH DESIGN THE POPULATION AND SAMPLE The population The sample DATA COLLECTION AND RECORDING The teaching programme The lessons Instruments Test 1 Learning Tasks Assessment Tasks
DATA CAPTURE AND RECORDING DATA ANALYSIS AND PRESENTATION Data analysis instruments Data Presentation PILOT STUDY TEST FOR VALIDITY AND RELIABILITY OF INSTRUMENTS CONCLUSION
39 39 40 40 40 41 41 42 44 44 44 46 47 47 48 51 53 53 54
CHAPTER FOUR DATA ANALYSIS, REPRESENTATION AND INTERPRETATION 4.1 4.2
INTRODUCTION DATA ANALYSIS, PRESENTATION AND INTERPRETATION 4.2.1 Data sources 4.2.2 Analysis
4.2.2.1 Analysis of the level of development of the aspects of the function concept at various stages during the experiment 4.2.2.2 Language development
55 55 55 57 58 69 viii
4.2.2.3 Sample of pupils’ responses on selected tasks
4.2.3 Conclusion
74 81
CHAPTER FIVE SUMMARY, FINDINGS AND RECOMMENDATIONS 5.1 5.2 5.2.1 5.2.2 5.3
SUMMARY AND FINDINGS RECOMMENDATIONS Teaching Further research CONCLUSION
Reference
83 85 85 86 86 88
Appendices Appendix I: Teaching programme Appendix II: Tasks Appendix III: Assessment schemes Appendix IV Episodes from the audio-taped data Appendix V: Sample of the analysis of pupils’ responses
97 99 119 123 127
ix
List of Figures Fig 2.1 Fig 4.1 Fig 4.2 Fig 4.3 Fig 4.4 Fig 4.5 Fig 4.6 Fig 4.7 Fig 4.8 Fig 4.9 Fig 4.10 Fig 4.11 Fig 4.12 Fig 4.13 Fig 4.14
Working with functions in ‘functional situations’ 29 Pupil 021’s solution 58 Pupil 008’s solution 59 Pupil 023’s solution 59 The development of the aspect change (C) for each of the seven pupils at different stages in the teaching experiment 61 The development of the aspect relationship (R) for each of the seven pupils at different stages in the teaching experiment 63 The development of the aspect rule/symbol (F) for each of the seven pupils at different stages in the teaching experiment 64 The development of the aspect representation (P) for each of the seven pupils at different stages in the teaching experiment 66 The development of the aspect strategy (S) for each of the seven pupils at different stages in the teaching experiment 68 Pupil 011’s solution on Task 5, Activity 5 75 Pupil 023’s solution on Task 5, Activity 5 76 Pupil 017’s solution on Task 5, Activity 5 77 Pupil 011’s solution on Task 5, Activity 4 78 Pupil 003’s solution on Test 2, q5, Activity 5 79 Pupil 021’s solution on Test 3 80
List of Tables Table 2.1 Table 2.2 Table 2.3 Table 3.1 Table 3.2 Table 3.3
Table 3.4
Table 4.1 Table 4.2 Table 4.3
The nature of geometric change and its attributes The constitutive elements of the function concept that should be developed Students’ stages/levels of development of the function concept at Form 1 The refined hypothetical stages of development of the function concept at Form 1level Sample solutions for Test 1 Q.8 (Appendix II) The levels of development of each of the seven pupils in the aspect change in various contexts at the three stages of the teaching experiment (Example) A summary of the seven pupils’ extent of development of each of the aspects of the function concept at different stages in the teaching experiment (Example) Additional levels of development used in the analysis of data The development of the aspect change (C) for each of the seven pupils at different stages in the teaching experiment The development of the aspect relationship (R) for each of the seven pupils at different stages in the teaching experiment
15 19 25 49 50
52
52 60 61 62
x
Table 4.4 Table 4.5 Table 4.6 Table 4.7
The development of the aspect rule (F) for each of the seven pupils at different stages in the teaching experiment The development of the aspect representation (P) for each of the seven pupils at different stages in the teaching experiment The development of the aspect strategy (S) for each of the seven pupils at different stages in the teaching experiment Language development in word problems
64 66 67 73
xi
CHAPTER ONE INTRODUCTION AND OVERVIEW 1.1
INTRODUCTION
This chapter briefly explains the general position of functions in school algebra with particular reference to the Zimbabwean secondary school mathematics curriculum. It highlights the current position of the function concept in the mathematics curriculum and why the author feels that the crucial role of functions in the development of mathematical knowledge and pedagogy suggested by literature is not being fully exploited in the Zimbabwe secondary school mathematics curriculum. The scope of the study and the projected constraints will also be highlighted.
1.2
BACKGROUND AND MOTIVATION
The Zimbabwean education system starts with a seven year long primary school course, in which the beginning or lowest grade is Grade 1 and the last year is Grade 7. The secondary school course is six years long. The first year is referred to as Form 1 and the last is Form 6 capped with the pre-University entry examinations. In the Zimbabwe school mathematics curriculum algebra is first introduced at Form 1. At Grade 7 in the primary school tables and graphs are introduced and continued in the secondary school. However these are not explicitly taught as constituent concepts to functions. Functions are introduced at Form 3. This study is driven by a belief expressed in (Kalchman 2001: 1) that the function concept is “pivotal, central and the synthesis of many topics students traditionally learn in isolation in elementary school”. Functions are important in the development of mathematical knowledge and knowledge in other subject areas in the school curriculum.
The early introduction of the concept of function is in line with current views and reforms in mathematics education in which most mathematical disciplines are based. According to reform ideas in (NCTM 2000) functions, variable and patterns should be introduced in the lower Forms at secondary school for students to start developing a better idea of algebra. One of the great mathematicians of modern times, Felix Klein (Sheehy 1996) is known to have strongly supported the idea of introducing functions early in the secondary school curriculum as a basis for the development of mathematics. Klein quoted in (McComas 2000: 716) advocated the introduction of the notion of a function “not as a new abstract discipline but as an organic part of the total instruction, starting slowly…with simple and concrete examples”. In a number of textbooks the function concept is normally introduced as a pre-calculus topic taught in higher forms. From an analysis of one of the textbooks, (Channon, Macleish Smith, Head and Macrae 1991, Book 2: Ch. 7 & Ch. 8), used in Zimbabwe secondary schools the notion of a function can be assumed to be first experienced as the co-variation between quantities in Form 2 when distance-time graphs, direct and inverse proportions are introduced. Later, at Form 3 and Form 4, functions are studied under graphs. The emphasis is on notation and the understanding of the connection between the various ways of representing functions; that includes tables, graphs and equations by drawing graphs of given equations. Making tables of (numerical) values usually facilitates the transition from equations to graphs. Pupils further study the way slope or gradient, intercept and co-ordinate pairs are related in graphs and equations. This is confirmed in the Zimbabwe O-level mathematics syllabus by the following content objective under ‘Graphs and Variation’ in which: All pupils should be able to construct tables of values, draw and interpret given functions which include graphs of the form y = mx + c, y = ax2 + bx + c and y = axn where n = -2, -1, 0, 1, 2 and 3 and simple sums of these; and use the f(x) notation (Zimbabwe O-Level Syllabus 1991: 6).
This statement emphasises an algebraic definition of a function in the form of an equation. The role of a table seems to be more of a means to draw a graph given the equation of a function and not so much as an alternative representation of a function. In Channon et al (1991, Book 3 Ch. 16: 144), the f(x)-notation is introduced as an alternative way of defining the equation of the graphs of the functions, that is, the 2
representation of the equation of the linear graph y = mx + c is f(x) = mx + c. (Freudenthal 1973) says this syllabus approach, in which the function concept’s early conceptions are connected to its graphical illustration, making the two nearly synonymous, creates a problem difficult to correct in later levels. One of the problems is the abstractness of the notation f(x) that learners struggle to interpret. They have to give it a new meaning from the usual product of two variables f and x. The other problem in this approach is that students see the three representations, equation, table and graph in that order (as means of getting the other in a linear fashion). Later when functions are introduced at Form 5 the table does not feature much as a representation of functions but is replaced by ordered pairs and arrow diagrams. The connection between this previous knowledge of functions and what is done at A-level (Form 5 and 6, pre-college and university levels) is very little. The general practice is that functions start at A-level to prepare students to do calculus and further studies in mathematics. The concept is generally presented in a structural way on the assumption that students at A-level are capable of grasping abstract ideas. Unfortunately students have continued to struggle with this concept that has been described as “epistemological obstacles” (Sierpinska 1992: 2558). According to Sfard (1992: 59) the development of the function concept is first operational then structural. An operational conception views a function as an algorithm for computing one magnitude by means of another. A structural conception views a function as a correspondence between two sets (Kieran 1990: 109). The structural definition uses symbols and functions are presented as objects, like numbers, on which they are expected to carry out various operations. Handling a situation like: if f(x) = 2x+3 find f(2x) makes very little sense for an average ability Form 3 student. Many students at A-level also struggle with such ideas and generally experience difficulty in understanding the structural definition of the function concept. Students usually fail to use it to develop fundamental ideas that are critical for further study and application in mathematics and other subjects (Confrey & Smith 1995; Sierpinska 1992).
3
Ideally the introductory stages of the function concept should be broader through exploring as many real life situations or contexts as possible in which functions occur. Kalchman (2001: 7) gives two of the many positive effects of introducing functions as early as elementary school as: First, it may stave off some of the more common difficulties students experience with functions… Second, it may allow for conceptual foundation for understanding functions to be laid in children’s school mathematics…Earlier experiences using appropriate curriculum would also allow enough time for the key concepts to be laid across grade levels as new ideas are introduced and for students to consolidate and make connections along central ideas.
Thus functions should not wait to be introduced when the students have done some formal algebra but, instead, should facilitate the acquisition of the algebraic concepts. The connections between functions and the real world are absent when the algebraic definition is used to introduce functions or is introduced early in the school curriculum. These connections can be facilitated by reversing the order and approaching functions from the real world and emphasising the geometric definition as used in Newton and Leibniz times (Kleiner 1989). In some of today’s mathematics classrooms the introduction of dynamic technologies, such as the graphical calculators and computers, has opened many possibilities to develop the notion of a function with no or very little algebra background as expected in the traditional curricula. Some researches have explored the introduction of algebraic concepts through a “functional approach” (Kieran, Boileau & Garançon 1996: 257) in technologically supported environments. These technologies show that it is possible to simultaneously represent a situation in tabular, graphical and algebraic forms making the learning and application of functions meaningful. Unfortunately technology is still a dream in most of the Zimbabwe’s secondary school mathematics classrooms. However, in the absence of these technologies the idea still needs to be explored. There seem to be very little research on reforming the mathematics curriculum in Zimbabwe in the area of functions. This study is intended to contribute to the possibility of introducing the function concept early in secondary school. Although many of the mathematics classrooms are bare, with no textbooks, no mathematical instruments, let alone
4
calculators and computers, reform in these classrooms is still needed in one way or another if mathematics is to be accessible to all students.
1.3
PROBLEM STATEMENT
The idea of introducing the function concept in early forms, as part of the acquisition of algebraic concepts alongside understanding of patterns, has been proposed in the NCTM Standards (2000). In South Africa such ideas have been incorporated in the new mathematics curriculum (DoE, 2002). The Nziramasanga Report (1999) on Education in Zimbabwe recommended a mathematics curriculum that emphasises problem solving, communication and mathematical reasoning skills as a way of improving the quality of mathematics education. A closer look at the current Zimbabwe O-level Mathematics Syllabus (1991) shows that there is an opportunity and need to introduce functions as early as Form 1 in line with recommendations for reform of the mathematics education expressed in the America’s NCTM (2000), South Africa’s DoE (2002) and the Zimbabwe Nziramasanga Report (1999). Critical to the study are answers to the following question: To what extent can Form 1 pupils, with very little or no prior experience with algebra (operating in the pre-algebra stage) develop the notion of a function?
1.4
AIMS
The purpose of this study was to investigate Form 1 pupils’ development of the function concept at a stage when learners are beginning formal instruction in algebra (i.e. during the pre-algebra stage) and establish the extent to which this concept develops. Specifically the study investigated the depth and breadth to which the Form 1 pupils develop the function concept during these early stages. In this regard the study investigated: (a) What aspects of the function concept do the students develop at this level? (b) To what extent do they develop these aspects? (c) What kind of functional reasoning strategies do they use at this stage?
5
The researcher is aware of the role of mathematical language and non-mathematical terminology of functions in researching the stated problem. However in this study the focus was on the stated sub-questions. The language aspect is referred to and discussed when it is necessary and appropriate.
1.5
METHODOLOGY
In order to answer the above questions three activities were carried out: (a) A literature study of research on functions was done to identify the aspects of the mathematical function that can be developed in the pre-algebra stage in order to come up with the content to teach and an instrument to assess the pupils’ development of functions at Form 1 level. This was done through studying literature on the historical and on the psychological development of the function concept. (b) A teaching experiment was conducted with a group of Form 1 pupils in a secondary school in Zimbabwe. The teaching experiment involved introducing the function concept to the group of Form 1 pupils through the use of problems. The lessons were task based and the data was collected mainly from the pupils’ individual paper and pen written work. (c) An instrument to assess the development of function concept, specifically at Form 1 level, was developed from the literature study. The instrument was used to answer the research question.
1.6
SIGNIFICANCE OF THE STUDY
This study serves to provide a basis for the introduction of the function concept in the early Forms at secondary school. Such introduction would provide a way of making functions contribute significantly to mathematical knowledge and pedagogy. The researcher felt that the study would also shed light on the possibility of adopting reform 6
ideas being tried elsewhere into the Zimbabwean context. Teaching functions through a problem-centred approach is assumed to help make the learners to be actively involved in the acquisition of the concept. A study carried out in Zimbabwe revealed that teachers generally accept the theory that pupils must be actively involved in their acquisition of mathematical knowledge but very few teachers seemed to know how to do it (Kwari, Mtetwa, Chipangura, Makamure, 2002). Experiences from this study should help shed light in that area. More than anything this study should provide the possibility of putting innovative ideas into practice and inform a curriculum that introduces the function concept in early Forms in Zimbabwe.
1.7
LIMITATIONS
Haimes (1996: 582) carried out a study on teacher cognition and actions in the implementation of an intended curriculum. The results showed that teacher’s actions did not reflect their intentions and the teaching philosophy implied in the curriculum. “The impact of the curriculum on the actions of the teacher was found to be minimal in this study” (Ibid. 601). There are many reasons why this can happen. •
In the current study the researcher was also the teacher who will implement the proposed curriculum that she has not experienced herself. The absence of a hands-on experience in the use of a problem-centred approach and the lack of a content to teach functions in early Forms in the Zimbabwe mathematics school curriculum are factors likely to impact negatively on the results.
•
The researcher-teacher was also a learner in the teaching experiment trying to adjust her understanding of functions and the way she was taught and has been teaching the concept.
•
The learners were operating in pre-dominantly teacher-centred learning environments and took time to respond to the problem-centred approach that was used in the research.
7
•
A study like this is best carried out using a developmental approach or a spiral model that allows for the construction and adequate testing of the curriculum material during their use.
•
The setting in which the study was carried out and timing (when the study was carried out) were constraints.
•
The tasks that are used for teaching needed proper validation and reliability testing. This was not done adequately mainly due to the problem of access to schools. The timetables were already congested to allow an outsider to have appropriate and adequate time to pilot the study as well as carry it out. A teaching experiment requires the researcher to have “normal” lessons with the pupils and this was not possible with a topic that was not in the teaching programme or mathematics syllabus at the lower secondary school.
1.8
DELIMITATION
The results of this study are useful in providing preliminary ideas for designing a curriculum programme for a larger study. The results cannot be generalised for the school in which the study was carried out in Zimbabwe because of both the size and composition of the sample. Nonetheless it should be useful in providing an insight in the possibilities of introducing the concept in the pre-algebra stages.
1.9
DEFINITION OF KEY TERMS •
Development – a process of acquiring the concept.
•
Function - a quantity that depends on others such that if the latter are changed the former under go changes themselves.
•
Functional situation – a situation that can be modelled by a function.
8
•
Functional reasoning – thinking that reflects use of function attributes. For example, ‘for each additional triangle built to the existing shape two more matchsticks are used” reflects a dependence relationship.
•
Aspect of function - a concept that constitutes the definition of function such as change, relationship, output.
•
Context - a situation that the learner can relate to easily, which can be a real life situation, a game, a diagram, picture, a word problem, a pattern (drawn or physically presented). It is the source of the concept.
•
Pre-algebra – “a collection of knowledge, skills and dispositions prerequisite for understanding algebraic concepts” (Lodholz 1999: 52).
•
Pupil – (In Zimbabwe) the term normally used to refer to learners in the primary and lower secondary school.
•
Learner, student and pupil are used interchangeably in this study.
1.10 LAYOUT OF THE DISSERTATION The overall layout of this study is as follows: In Chapter 2, the theoretical framework, which includes a study of the historical development of the function concept, some related research on how functions develop as a mathematical construct, views on innovative approaches to introducing functions and strategies for assessing its development will be described and discussed. In Chapter 3 the research design, the data collection, data presentation and data analysis procedures will be described. In Chapter 4, the collected data was processed and analysed for the extent to which the pupils in the study had develop the function concept. Finally in Chapter 5, the findings of the study will
be
summarized;
conclusions
and
recommendations
will
be
provided.
9
CHAPTER TWO LITERATURE REVIEW
2.1
INTRODUCTION
In Chapter One the reasons why functions should be included early in the secondary school mathematics curriculum were discussed. However there are important issues to be explored in order to come up with a suitable programme for introducing functions at Form 1 level. Some of the critical questions that Chapter Two will address are: What aspects of functions can be taught and to what extent? What approaches should be used to introduce the function concept in a meaningful way? The theoretical frame work of this study will be built from the premise that: 1. The notion of functions evolved from dependence relationships of real life phenomena to an abstract correspondence that is usually best describe in symbolic terms (Shuard & Neill 1977; Kleiner 1989; Ponte 1992; Sfard 1991; Sheehy 1996; Sierpinska 1992). 2. The development of the function concept is a convergent of many critical aspects (Davidson 1987; Sierpinska 1992). 3. The early conceptions of functions are operational and the development of the concept passes through identifiable stages or thought levels (Sfard 1991, 1992; Thomas (1975; Orton cited in Land 1990; Land 1990; DeMarois & Tall 1996; Kalchman & Case 2000; Kalchman 2001; Dubinsky & Harel 1992; Schwingendof, Hawks & Beineke 1992). 4. The concept function can be developed in a natural way building from the learner’s intuitive notions of the concept (Freudenthal 1973) and
through
meaningful approaches (Confrey & Smith 1991; Kalchman 2001; Van de Walle 2004; Cooney; Brown; Dossey; Schrage,& Wittmann 1996) in dynamic environments (Schwartz & Yerushalmy 1992, Heid 1996).
10
2.2
THE DEVELOPMENT OF THE MATHEMATICAL FUNCTION
2.2.1 The evolution of the notion of the mathematical function Developments in algebra and geometry that took place over the centuries had a great influence on the current definition of a function and the way functions are taught. The 17th century emergence of modern mathematical science and the invention of analytic geometry changed the view of a function from a static discrete view to a dynamic continuous view. Algebra was blended with geometry resulting in the introduction of variables and the relationship between variables by means of equations. Leibniz first introduced the word function in 1692 “to designate a geometric object associated with a curve… for example, a tangent is a function of a curve” (Kleiner 1989: 283). Over the years the word function has evolved in meaning. “as society, technologies, and interests of mathematicians changed” (Sheehy 1996: 8). More significantly is the change from a dependence relation between quantities expressed as an equation or formula to a rule of association between elements of two sets. The current meaning of function is hardly linked to its geometric definition (Freudenthal 1973). Mesa (2004: 257) summarises the development of the function concept as an evolution from “being a numerical entity…to becoming an equation…to an arbitrary correspondence between numerical intervals…and finally to become a correspondence between any pair of not necessarily numerical sets”. Initially functions were understood as dependence relationships among real-world quantities but later the focus changed to an arbitrary correspondence between two sets and this is the dominantly held view to date. According to Kleiner (1989: 282), during the period 1450–1650 the evolution of mathematical and scientific ideas gave rise to the current definition of the function concept. These events included: •
The development of algebra from rhetoric to symbolic, which influenced ways of representation;
•
The evolution of geometry from Euclidean to analytic, emphasizing graphical aspects of functions; 11
•
The blending of algebra and geometry, introducing variables and constant parameters;
•
The evolution of the set theory.
These events led to the conception of functions to evolve from: •
A real life phenomenon experienced through the study of, for example motion, to an arbitrary concept.
•
A dependence relationship between variables to a correspondence between arbitrary sets.
•
Being treated procedurally to being treated structurally.
•
A geometric representation to a symbolic representation.
The current definition of a function came about as a result of an attempt to find a general term to represent quantities dependent on other quantities in formulas and equations (Kleiner 1989). This resulted in algebraic definitions expressed as equations or formula. One such definition came from Bernoulli in 1718 (quoted in Shuard & Neill 1977: 18) and reads: A quantity composed in any manner of a variable and any constants.
In 1748 Euler’s came up with a definition that he later improved on in 1755. This definition of the function emphasised a dependence relationship between quantities. The definition read: If … some quantity depend on others in such a way that if the latter are changed the former under go changes themselves then the former quantities are called functions of the latter quantities (Kleiner 1989: 284).
The entire approach to functions during this time was algebraic with stress on algorithmic dependence between variables and the use of equations or formula as representations.
Further developments in mathematics facilitated the emergence of definitions that sort to widen the scope of the meaning of a function. In 1829 Dirichlet in (Sheehy 1996: 2, Kleiner 1989: 291) offered a definition that was to see a great emphasis in the correspondence relationship between variable quantities.
12
y is a function of a variable x, defined on the interval a < x < b, if to every value of the variable x in this interval there corresponds a definite value of the variable y. Also, it is irrelevant in what way this correspondence is established.
In this definition the conditions for a relationship between variables x and y are defined and the emphasis shifts from a co-variation relationship expressed in Euler’s definition to a correspondence relationship. The implied domain for x in the definition is a subset of the real numbers. However the rule of correspondence is silent in this definition; the nature of relationship is not defined. Thus this definition by Dirichlet allowed for all sorts of relationships to be functions and hence was not really accepted. The emergency of the set theory and abstract algebra resulted in a set-theoretic definition that Bourbaki formulated in 1939. In this definition the notion of a function was described as a mapping between arbitrary sets and reads: Let E and F be two sets, which may or may not be distinct. A relation between a variable element x of E and a variable element y of F is called a functional relation in y, for all x ∈ E, there exists a unique y ∈ F which is the given relation with x. We give the name of a function to the operation which in this way associates with every element x ∈E the element y ∈ F which is in the given relation with x; y is said to be the value of the function at the element x, and the function is said to be determined by the given functional relation. Two equivalent functional relations determine the same function. (Kleiner 1989: 299)
Bourbaki’s definition has remained dominant in mathematics and has influenced the teaching and learning of functions at secondary school. In this definition the rule of correspondence is the function. Today the mathematical function is understood in many different ways; a dependence relationship, a rule of correspondence, a formula, an expression or equation that connects two or more quantities and so on. In Bourbaki’s definition sets and relations have to be taught first. This has resulted in a theoretical approach to functions that students have found difficult to apply. The psychological emergence of algebraic concepts in learners seems to follow their historical evolution and must be treated as such. The lesson to be learnt from this historical development is that functions were first conceived operationally as relationships between variable magnitudes and the informal operational definitions such as Dirichlet’s are sufficient at secondary school (Sierpinska 1992).
13
2.2.2 The constitutive elements of the function concept The definition of a function has been described both operationally and structurally in the previous section. In the definitions the three constituent parts of the mathematical function coming out are the variable magnitudes, one depending or determined by the other and a rule that connects these variables. Anderson (1978: 23) refers to these metaphorically as the "raw material, a rule or process, … and an end product". Sierpinska (1992: 30) described the constitutive parts of a function as “worlds” emphasing that the study of functions should focus on: •
WORLD OF CHANGES or CHANGING OBJECTS. In the definition of function the two variables, usually referred to by X and Y, represent these changing objects.
•
WORLD OF RELATIONSHIPS…or WORLD OF PROCESSES, denoted by f in most definitions that transform objects into other objects.
•
WORLD OF RULES, PATTERNS, LAWS that define the relationships.
“Understanding functions” means knowledge of the above worlds. The teaching and learning of functions should involve the acquisition of these sub-concepts. The development of the function concept is a process that goes through stages and takes time. It involves an integration of a network of sub-concepts that must be acquired first. What are these sub-concepts? Sierpinska (1992: 57) suggested some conditions that should be considered in the teaching of functions. These include the need for students to: ¾ Be interested in explaining changes, finding regularities among changes; ¾ notice changes and relationships between them as something problematic, worth studying; ¾ be motivated to study functions in a meaningful way by making them see that mathematics is involved with practical problems; ¾ “…become interested in variability and search for regularities before examples of well-behaved mathematical functions and definitions are introduced in the classroom”. According to Dossey; Giordano; McCrone & Weir (2002: 161), to study functions, “initially students should analyze changes and describe them. Later as they advance, the focus shifts to identifying functions that represent 14
specified patterns”.
2.2.2.1
World of changes
The initial understanding of functions can focus on identifying change and what changes. Change can be described as a transformation. This includes displacement, appearance and orientation. Seeing change involves observing both the qualitative and quantitative attributes. Table 2.1 gives some examples of geometric change: TABLE 2.1: The nature of geometric change and its attributes. What changes Appearance (e.g. similarity and enlargement) Orientation (e.g. rotation and reflection) Displacement (e.g. translations)
Qualitative attributes Colour, shape, size
Quantitative attributes Estimate and/ or actual proportions
Position, direction
Actual reference points and amount of turn Estimate and/ or actual measurements with respect to some reference point
Distance (far, near, close)
Sierpinska (1992) emphasised that, in the study of functions, students should observe change, both what is changing and how. In the teaching of functions X and Y usually denote the changing quantities or magnitudes. A deeper and meaningful understanding of functions requires that the students move from conceiving X and Y as known and unknown to variables and constants. Later, in order to define a function students must be made aware of the asymmetry property of X and Y, that is which variable uniquely describes the other, the independent and dependent variables. Change can be viewed numerically as changing magnitudes in number operations and geometrically the transformations enlargement, translation, rotation and reflection. Operations on numbers, such as adding the pair (6; 3) to get 9, which are taught early in primary school mathematics are not usually understood or presented as functions. These pre-algebra encounters are later abstracted into complex functions e.g. (x, y) = 9. The idea of change can be introduced at an early stage through the study of many examples of variable quantities such as area, motion, growth. Students first recognise qualitative and/
15
or quantitative change within a variable. Later they observe change between variables and begin to connect these changes and look for relationships.
2.2.2.2
World of relationships
Cooney et al (1996) and Sierpinska (1992) have suggested that functions should be introduced as models of relationships using real life situations and as tools for representing one system in another system. According to (Sierpinska 1992: 32) this is how functions have evolved when, historically, they came into being “as tools of description and prediction’. Functions can be models of patterns, real life situations (usually contrived into word problems in school textbooks). Functions as tools are usually demonstrated through the use of function machines, flow diagrams and “Guess My Rule” games in mathematics classrooms. A relationship, according to Mason et al (2005: 143), is a statement that describes how two or more objects are connected or related. It is a particular association between either, (a) concepts, (b) a concept and a specific, (c) a specific and a concept and (d) specifics that can be discovered using reasoning or experimentation (Cangelosi 1996: 98). Relationships can be expressed in many ways, using lists, tables, arrow diagrams, graphs, and symbolical statements. Functional relationships are dependent relationships or rules of correspondence. Students experience the function concept whenever they consider how change in one variable can cause or have a corresponding effect on another. The idea of a function can be developed as a co-variation relationship between variable quantities and/or a rule of correspondence or association between members of two sets (Confrey & Smith 1991; 1994; 1995; Van de Walle 2004). Students first observe recursive or iterative relationships before they see what could be identified as functional relationships. In a recursive relationship the change between magnitudes is described from step to step while a functional relationship defines the change between the dependent variable and the independent variable by a rule that connects these variables. For example in the sequence of whole numbers 1, 3, 5, 7, 9…identifying that the difference between consecutive terms is 2 or obtaining the next
16
term by adding 2 to the previous term are recursive processes. Thus the next term in the sequence is the image of the previous one (under function f). For instance in the sequence above, 3 is the image of 1 and 5 is the image of 3 and so on, under the function add 2. In the co-variation relationship “as one quantity changes in a predictable or recognizable pattern, the other also changes, typically in a differing pattern. Thus, if one can describe how x1 changes to x2 and how y1 changes to y2 then one has described a functional relationship between x and y” (Borba & Confrey 1996: 323; Confrey & Smith 1994: 135). The co-variation approach has been very successful in studies where computer programs and graphical calculators have been used to show the visual aspects in the covariation, particularly the rate of change. The co-variation approach in a paper and pencil environment can also be effective through the use of manipulatives that help the learner visualise the co-variation between the dependent and independent variables. More complex functional relationships are expressed using a rule of correspondence or association (Confrey & Smith 1991). This is a step beyond the co-variation relationship. For example the next term in the sequence 1, 3, 5, 7,… can be obtained by noticing relationships between n, the position of the term in the sequence, and the value of the nth term (nth term = 2n+1). The sequence can also be understood as fixed points on a graph usually represented by a set of ordered pairs: (x; f(x)). In this case (1; 3), (2; 5), (3; 7) describe distances from 0 of the fixed points. Usually such relationships enable one to describe a rule to find a value y or (f(x)) given a particular value for x. Confrey and Smith (1991; 1995: 78) encourage the development of functions through both the covariation and correspondence approaches but with emphasis on the former in the introductory stages. The later is criticised for being abstract and “places a heavy emphasis on stating the rule explicitly (usually algebraically) and on a directionality from x to f(x)”. There are many good examples of relationships in everyday situations and the teaching of functions should focus on studying change and relationships in contexts that are meaningful and interesting to students (Van de Walle 2004). In both the primary and secondary school mathematics curriculum students study measurement of area, volume
17
and perimeter. The formulae for calculating these measurements are good examples of relationships between variable quantities. Sierspinska (1992) has criticised the teaching of relationships between variable magnitudes as mere illustrations of mathematical functions.
2.2.2.3
Rules or laws or patterns that define the relationships
One conception of a function widely used is that it is a rule “that uniquely defines how the first or independent variable affects the second or dependent variable (Van de Walle 2004: 436). The difference between the rule and relationship is subtle because the rules, patterns and laws are simply well defined relationships (Sierpinska 1992). Relationships can be expressed verbally or using diagrams, table, graph or in symbols. A rule can be a verbal statement, a formula or an equation. It is possible for one to detect a relationship but fail to explicitly state the rule. In the sequence 3; 5; 7; one can relate the 1st term with 3, 2nd with 5, 3rd with 7 and so on but fail to describe how the pairs are related. Finding rules, patterns and laws can be used as an entry point to the development of the function concept. For example the following simple problem can generate a lot of ideas on the function concept. Farai earns a living by selling bananas. How much does Farai earn each day? The idea of change can be developed by studying the variables number of bananas sold and money earned and the dependence relationship between the variables. The rule can be described as the method of calculating money earned (process) or it can be understood as the money earned (object). In stating a rule the learners usually demonstrate their knowledge of change and relationship. Similarly relationships can be implied in rules and rules in representations. In other words the development of the aspects is hierarchical. Table 2.2 below is a summarised view of the aspects described above, which are the constitutive elements of the function concept. At Form 1 level teaching of functions should focus on introducing these aspects. Gradually these aspects are integrated into a definition of a function. According to DeMarois et al (1996) the development of the function concept is very complex. The aspects, change, relationships and rules are not exhaustive or mutually exclusive and independent. They are not discrete pockets of
18
knowledge. For example the idea of changing objects does not necessarily develop separately from the idea of relationships. Ideally as the learners observe the change in the independent variable they should be able to observe how that change affects the dependent variable in order to establish a functional relationship. Rate of change describes a dependency relationship between variable magnitudes and is a very vital concept in the development of functions (Confrey 1994: 137). TABLE 2.2 shows the constitutive elements or aspects of the function concept that should be developed. Element/ Aspect Change and what changes
Relationships
Rules
Representation
Language /Notation
Attributes Appearance (shape, colour, size, regularity) Orientation (position, direction) Displacement (position, distance) Move from known and unknown to variables and constants Recursive/ iterative (sees change from one step to the next within a variable for example t + a is the image of tn under the operation add a) Dependence (sees change between variables) and these include: • Co-variation (coordinates change/ movement operationally from ym to ym+1 with change/ movement from xm to xm+1 ) • Correspondence (builds rules to determine a unique y-value from any given x-value) Recursive/ iterative (symbolically understood as tn+1 = tn + a ) Functional dependence • Co-variation (symbolically given by f(xn+1) = f(xn) + c) and • Correspondence (symbolically given by f (x) = ax + b) N.B. ‘n’ in the equations represents the number of terms in a sequence. Context (physical /picture/ diagram) Verbal (words) Numeric (list, arrow diagram, table, ordered pair) Geometric/Graph (block, Cartesian) Symbolic (expression, formula, equation) Special words, or expressions, symbols (use of terms e.g. input / output, depends on/ that depends)
Another very important aspect in the development of the function concept is the strategies that the learner uses to solve problems involving functional situations. The strategies range from use of guesswork to applying formulae. These strategies can also be expressed through representations and rules. A problem presented through a pattern can
19
be represented in a table and the relationship between the variables in the table can be verbalised. In such cases the learners is said to be using and connecting different representations.
2.2.3 Views on conceptions and stages/levels of development of the function concept Concepts can be identified on the basis of a definition from which examples and nonexamples can be figured out. Cangelosi (1996: 80) describes a concept as “a category people mentally construct by creating a class of specifics possessing a common set of characteristics; in other words, a concept is an abstraction”. Thus starting by giving a definition of a concept does not guarantee that students will grasp the concept. The student must construct the concept and according to Vinner (1992: 196) to understand concept definitions one may need to develop concept images first: Knowledge when constructed in somebody's mind at least in its primary stages, its building blocks are not definitions, axioms and proofs. Hence, appropriate pedagogies, before suggesting definitions to the students, suggest examples, manipulating and other experiential opportunities… A concept definition does not guarantee understanding of the concept.
Pupils can be given the definition of a function but for them to make this definition their own they need first to develop and integrate concept images. The development of the function concept takes place in two directions as the horizontal growth (growth in the breadth of students’ concept image) and vertical growth (growth in the depth of the students’ formal understanding (DeMarois & Tall 1996; Schwingendorf, Hawks & Beineke 1992). The horizontal growth is the acquisition of the constitutive elements of the function concept that integrate to form a definition. The vertical growth is the progressively increasing depth in understanding the concept, “higher levels of cognitive abstractions” (DeMarois et al 1996: 297). The learner passes through stages or levels of cognitive understanding of each aspect described in Table 2.1. Studies have been carried out to identify and describe these stages.
20
Dubinsky and Harel (1992: 85) described four conceptions of a function: pre-function, action (pre-process), process and object that a learner can acquire as: •
Prefunction (pre-concept stage)
The subject really does not display very much of a function concept. Whatever the term means to such a subject, this meaning is not very useful in performing the tasks that are called for in the mathematical activities related to functions
•
Action (pre-process):
(It) is a repeatable mental or physical manipulation of objects. Such a conception of function involves, for example, the ability to plug numbers into algebraic expressions and calculate. It is static in that the subject will tend to think about it one step at a time (e.g., one evaluation of an expression).
•
Process:
The subject is able to think about the transformation as a complete activity beginning with objects of some kind, doing something to these objects, and obtaining new objects as a result of what was done.
•
Object:
A function is conceived as an object, if it is possible to perform actions on it, in general actions that transforms it.
This gives the overall picture of the development of the function concept. Ideally learners should move through these conceptions to have a real understanding of functions. Therefore it is necessary to facilitate students’ progression through the different levels of conceptions to enable them to operate at the highest level, the structural level. The average Form 1 students can be assumed to be operating at the pre-function level. This does not mean the students have not experienced functions; they have but have not treated them as such. Simple proportion is a topic done in the primary school that is an example of a linear function. When students use simple proportion in problems they are merely carrying out actions and proportion is just a process or strategy to get the correct answer. At Form 1 level proportion is the pre-knowledge that can be used as the stepping stone to defining functions. However students’ understanding of proportion at this stage is of equal ratios and this can be an obstacle in the development of the function concept. If a pair of values in a table are in the ratio 1:2, students tend to assume that all the other values will have that relationship yet this is not the case in linear relationships of the form y = ax + b. This situation provides an opportunity to explore properties for functional relationships.
21
Similarly a number of researchers, who include Orton cited in Land (1990), Thomas (1975), Land (1990), and Kalchman (2001), have investigated the development of the function concept and come up with their own stages of development. The description of these stages in the development of functions assumes a background in algebra and cannot be applied wholesome to the introduction of the concept in the pre-algebra phase. With the exception of Kalchman’s study, the analysis of these stages is based on the traditional curriculum in which students are introduced to the function concept after they have acquired basic algebraic concepts. Thus it may be difficult to apply the stages to the contemporary situation, which advocates for the introduction of functions as a prealgebra concept. Only the first levels in most of these studies can be considered suitable for a course that introduces functions in the pre-algebra phase. Thomas’ study (1975: 146) initially identified five stages in the development of the function concept but later summarized them into three namely (1) concept identification, (2) process and (3) operations on functions. The stage, concept identification is a combination of the first and second stages. Concept identification refers to the ability to discriminate instances and non-instances of functions and to formulate a correct criterion for making such discriminations.
In the first stage the student is expected to be able to find images in a mapping of whole numbers to whole numbers using simple arithmetic and linear algebra forms of a rule for the mapping. Students can also identify the object assigned to an element by a mapping as the image of that element by some appropriate terminology. In the next stage the student is expected to able to determine instances and non instances of functions. The development is quite logical, with the first stage being the main focus at Form 1 level, when functions are introduced using the content used in Thomas’ study. Orton in Land (1990: 87) describes the first of four stages as: Stage 1: The thinking of the pupil is essentially intuitive or concrete in nature. The pupil carry out processes associated with the function concept when they are essentially arithmetic in character or when the numbers of one set are assigned to those of another by means of a line or graph. The pupil interprets a rule such as x → 2x + 4 as a sequence of operations to be performed on some specific
22
number. But the concept of a function as a special kind of relation has not been mastered, and the extension of representation to the new and less familiar forms such as ordered pair graph is limited.
Land (1990: 89) used Thomas and Orton ideas to derive similar stages in the development of the function concept. She also incorporated ideas from Van Hieles stages of geometrical development. The first stage in Land is given as: Level 0: Pre-descriptive - the learning of the content of the concept. Recognising functions in different situations and identifying a particular type of function in a variety of situations. Meaning of graph or table is not understood in terms of functions. Objects at this level are numbers and spatial objects. Given some values in a table the student can discern a pattern and add more values or find those that are missing but still have not yet mastered a function as a certain kind of relation.
Kalchman’s (2001: 11) age related levels of development of the function accommodate the development of sub-concepts that progressively build the concept. The following is a summary of the first two levels that can be adapted to assess the development of the function concept in the pre-algebra stage: Level 1 (9-11 years of age), pupils experience the function concept as patterns of numbers in operations and spatially in qualitative terms. That is …they can iteratively compute within a string of positive whole numbers…given a string of positive numbers such as 0, 2, 4, 6, 8…students are able to add 2 to each successive number and consequently extend the pattern. The initial spatial schema is one where the children use two orthogonal reference axes representing quantities as bars on a graph. The bars on the graph are read as discrete quantities from the vertical axis (y-axis), and as qualitative and discrete categories from the horizontal axis (x-axis).
Level 2 (11 - 13 years of age), …the two initial schemas are elaborated and mapped onto each other, …students iteratively apply a single operation on rather than within, a string of positively ascending whole numbers to generate a second string of numbers…(They) construct an algebraic expression for this repeated operation by generalizing the pattern… In the spatial schema…categories along the horizontal axis become first quantitative intervals and then continuous quantities and thus can be used to represent quantitative rather than qualitative data. Any pair of values is now understood to be representable in this (Cartesian) space, and the pattern that these points yield is representable by joining the points and looking at the shape of the line that results. Students see pattern changes in the graph and are able to compare that pattern (for example its steepness or staring point to another….
Level 1 described in Kalchman’s (2001) study can be hypothesised as a possible entry point in the initial stages of the learning of the concept at Form 1 level and represent 23
students’ intuitive notions. Instruction then moves the students to level 2 when they begin to learn the content of functions. The fact that they are age related makes the levels more appealing to a study in which the grade level, to some extent, matches the age group of the students in the current study, that is, between 13-14 years. The above information on the different function conceptions and stages of development is vital in developing an instrument for assessing the development of functions at Form 1 level. Table 2.3 (see next page) is developed from Table 2.2 and the ideas above to come up with hypothetical levels of development of the function concept that can be attained at Form 1. These will become more refined as the curriculum is implemented, evaluated and improved. The approach here borrows ideas from “developmental research, which consists of curriculum development and educational research in which instructional activities will be used as a means to elaborate and test an instructional theory” (Gravemeijer 1998: 277).
24
TABLE 2.3: Students’ stages/levels of development of function concept at Form 1level.
Aspect Change (C) variables and transformation
Relationships
Stages of Development Level-1 Numerical schema Spatial schema • Recognizes • Recognizes both change in one qualitative and axis. (compares quantitative change size or height of • Variables are bar) unknown quantities
• Iterative/ recursive relates values within a variable or data columns
• Read bars as discrete quantities from the vertical axis
Level-2 Numerical schema Spatial schema • Recognizes • Qualitative and qualitative and quantitative change quantitative change. is recognized. • Categories in the • Can distinguish horizontal axis are between constants first quantitative and variables intervals then continuous quantities - Pair of values • Dependence plotted on the relates values Cartesian space. between variables - Join these points or data columns
• Prediction of nth based on the relationship between the two previous bars Rules
Representation s
Language
Iteratively apply a single operation on a string of numbers to generate a second string of numbers
Can compute within a string of positive whole numbers. Iterative/ recursive Verbal Lists Tables
Bar graphs
No special words identified relating to functions. Use words like change, big, small, increase, decrease. Words like input and output understood as opposites representing specifics.
Arrow diagram symbolic expressions
Cartesian graph • Plot points • Join the plotted points • See pattern of change in the graph
Use of words such as depends, input, output, varies, etc. are used to refer to generality.
At the pre-algebra stage the aim is to formalize the intuitive notions of a function the students bring from elementary school. Freudenthal (1973: 374) emphasizes the need for students to use “intuitive illustrations of functions” before they are made to “invent and formulate what a function is”. What is critical at the pre-algebra stage is the kind of thinking strategies the learners use and develop when they are working with problems
25
that involve functional situations. The image of a function they begin to develop in the pre-algebra stage will depend a lot on the content they are taught? In the traditional curriculum the students would use the definition of a function to identify examples and non-examples of functions. This is the stage described by Thomas (1975: 146) as “concept identification”. In contemporary curricula, the early experiences of the function concept are recommended to be through the application of function properties in problem solving rather than the learning of the definition. Level 1 could be considered as the entry point into the function concept for the average Form 1 pupil judging from the work done in the primary school mathematics curriculum. What they learn at Form 1 should then push them up to level 2.
2.3
APPROACHES TO FUNCTIONS IN THE SECONDARY SCHOOL CURRICULUM
According to (Kalchman 2001) functions play an important role in the development of mathematical knowledge and mathematical pedagogy. The late introduction of functions in the school mathematics has not raised the status of the concept as a unifying concept in the development of mathematical ideas. This is one of the reasons the concept should be introduced earlier than currently happening in most school curricula. There has been a growing interest to introduce functions at an early stage in students’ development and this can be started in the pre-algebra stage. The current position where the function is introduced in higher grades at the secondary school has its roots in the historical development of the concept. In traditional school curricula the topic on functions has to wait until the necessary developments have taken place in algebra and geometry. In Sheehy (1996) an analysis of a small sample of textbooks used in schools over the past hundred years showed that the function is introduced after topics in algebra and geometry have been introduced. Since textbooks influence classroom teaching it can be concluded that this is what is happening in the mathematics classrooms. Functions are introduced formally at Form 3 level.
26
2.3.1
Introducing functions at the pre-algebra stage
This study hypothesises that it is possible to introduce the function concept to Form 1 pupils in the pre-algebra stage at secondary school. Here pre-algebra means the learners have not acquired algebraic concepts such as the use of letters to express generality; it is the entry into algebraic thinking from arithmetic thinking. The historical analysis shows that the function concept evolved as algebra evolved (Sfard 1991, 1992) hence functions in the school curriculum can be developed as algebra develops. History of the concept also shows that the conception of functions as representing relationships between changing magnitudes using numerical and diagrammatic representations existed well before the symbolic definitions were introduced. Linchevski (1995: 114) suggested the introduction of a pre-algebra phase, before the introduction of algebra, whose role would be to “develop the more primitive, concrete pre-concepts that are necessary for the development of the higher, more abstract concepts”. Success in algebra requires, as its prerequisites, understanding the technical language of algebra, concept of variable, concepts of relations and functions (Lodholz 1999; Bell, 1995). Primary school mathematics is usually predominantly arithmetic hence the pre-algebra activities can also facilitate the transition from arithmetic to algebra. This early form of algebra deals mainly with numbers, but asks different questions about these numbers. In other words the students are given problems of an arithmetic nature but that require them to use algebraic thinking. The pre-algebra phase allows students to construct their knowledge of functions from arithmetic using concrete situations. Kieran and Chalouh (1999: 59) refer to this as “building meaning for the symbols and operations of algebra in terms of their knowledge of arithmetic”. In pre-algebra students have opportunities to explore key ideas about functions without getting bogged down with the manipulation of “meaningless symbols by following rules by rote” (Kieran & Chalouh 1999: 60). Willoughby (1999) suggests the use of magic-number machines to develop the concept of a function with First and Second Grades in America.
27
2.3.2
The role of meaningful contexts
An innovative curriculum such as the one described here requires innovative approaches. Most current studies on functions propose the use of contextual problems and other activities that allow the students to actively construct their own mathematical knowledge. The application and development of the function concept become integrated in such approaches. In order for the function concept to fulfill its role as a central idea in the learning and teaching of mathematics it must be developed meaningfully and students must be interested in what they are learning. Students need to be given an opportunity to develop experiences in dealing, mathematically, with the many situations in which functions occur before being given the formal definition of the concept. According to (Van de Walle 2004) the many sources of functions include studying various types of patterns, functions from real life phenomena, and function machines. These can be illustrated using concrete objects, diagrams, physical examples and solving word problems. This varied experience of teaching functions from many sources is assumed to contribute towards the development and understanding of the function concept that will help students to formulate a definition later. In their research Confrey and Smith (1995; 16) observed that the use of contextual problems to introduce functions often makes creating tables of data points of entry for students. The process of entering data is often intertwined with the construction of the variable and basic to this process is the examination and systematization of the data values …students building their image of a function as the coordination of two data columns. That is, not only could they describe a pattern of the values within a single column, but they could coordinate the values in two different columns in order to answer questions concerning a situation. At times, they could insert values in between the given data values engaging in interpolation.
The results from studies carried out by Kalchman and Case (2000), Kalchman (2001) using ‘walkathon context’ the entry point at Grade 6 showed that students could come up with was some form of algebraic rule that was then used to create a table of values. The research that was done by Confrey and Smith (1991, 1994, 1995) used contextual problems to introduce functions in dynamic environments using computer software. The
28
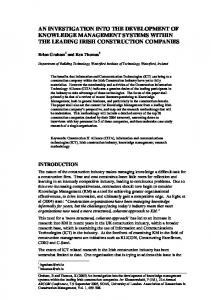
results were very successful. The NCTM (1989, 2000) and Monk quoted in Confrey and Smith (1995: 78) propose an emphasis in working with functions in ‘functional situations’ an approach that also allows different students’ approaches to become apparent. The different contexts illustrated in Figure 1 below provide rich learning experiences. Those suggested in the literature reviewed included patterns, contextual problems (includes real life situations and contrived word problems), and function machine (Van de Walle 2004; Cooney et al 1996; Kalchman & Case 2000; Tall, McGowen & DeMarois 2000). From each context the various aspects of the function concept can be developed and from these a network of schemas will provide the basis for defining the function concept. For example students can start with growing patterns, geometric or numeric, to extend and/or predict the nth term. These activities require the student to identify variables, relationship and rules.
Sources of functions
Patterns
Aspect of function
Variables
Definition
Pictures / diagrams Tables
Word problems
Function machine
Representations
Relationships
words
Function concept
Symbolic equations
Rules
graphs
FIG 2.1
29
2.3.2.1.
The pattern approach
Patterns, like functions, are central to mathematics knowledge and pedagogy. They can help students to observe changes, especially what changes and how; that is: •
Identify functional relationships between variables.
•
Obtain a rule or formula, algebraic expression or equation to describe the relationships.
•
Make predictions using a rule or formula. (Van de Walle 2004: 441; Serra 1997: 43).
An approach to the development of the function concept that includes a study of patterns requires the pupils to understand the idea of a pattern first. Patterns are inherent in most of the topics covered in the primary school mathematics syllabus. However for that knowledge to be useful to the learners in the development of the mathematical function it must be explicitly acquired, that is patterns must be taught in the primary school syllabus, which is not the case in the current Zimbabwe primary school curriculum. Noss, Healy and Hoyles (1999: 204) warn that “the route from perceiving ‘patterns’ to constructing algebraic representations is rather complex and fraught with potential problems for students”. They have cited the problem that students can apply a correct method to any number of specific cases but often cannot articulate a general pattern or relationship in natural language particularly in a paper- and -pencil learning environment. Some of the reasons they have attributed to this are: o Disconnections between actions, the result or output of actions and their descriptions. Attention is usually focused on the numerical attributes of the output. o Paper-and-pencil settings are static and hence offer few ways to gain insight into the student’s approach; They observed that, “when the activity becomes one of empirical pattern spotting, students formulate cases in any way they please. This formulation may be systematic, it may even be mathematical, but equally it may not be… ” (Noss et al 1999: 206). Another problem that could arise from the pattern approach is that most mathematical patterns generate numbers and this may lead to one of the epistemological obstacles 30
described by Sierpinska (1992) that functions are sequences yet sequences are only a special type of function. The strongest attribute of the pattern approach is that it offers a visual representation of the function concept if appropriate tasks and presentation is used. Learners can build patterns from physical materials, which, to a certain extent, combined with paper-and-pencil activities such as drawing a table of the numerical values from the pattern, can reduce the static nature of the approach. The solutions offered to minimize these problems are working in computer environments if they are available.
2.3.2.2
The input – output approach
The input – output approach is usually regarded as a process conception of the function notion. Through this approach, functions can be regarded as a manipulation or operation on one number to obtain another. It is closely linked to the Dirichlet’s definition of a function and emphasizes both the co-variation and correspondence relationships. The approach develops the aspect rule. The idea of input – output is found in the “Function Machine” analogy (Tall et al 2000: 255 – 261) and the “Guess My Rule” games. These describe a metaphorical approach to the introduction of the function concept. Mathematical metaphors "enable development of tools for thought and opportunities for constructing personal knowledge"(Pimm, 1987: 93). Metaphorical descriptions enable us to address phenomena that are otherwise difficult to describe such as the nature of a function. Tall et al (2000: 255) recommend the “use of function machine as a cognitive root to the development of the function concept”. The various representations, verbal, tabular, arrow diagram can be easily connected through this approach Most of these researches were carried out in computer and graphical calculator environments to introduce dynamic experiences in dealing with functions. In paper and pen environments such ideas will have to be adapted. Introducing functions using the function machine induces the idea of transforming (process) an input and returning a corresponding output. It is more dynamic than introducing functions through sets in terms of the domain, range and a rule relating each element in the first set with a unique element in the second set. These approaches, in which the function is used to guess the internal formula expressing a rule, have their shortcomings. They give rise to what
31
(Sierpinska 1992; Tall 1992) have described as the epistemological obstacle that all functions are given by formula; hence the need for a variety of approaches in the introduction of functions.
2.3.2.3
The word problem approach
Some researchers such as Davindeko (1997); Yerushalmy (2000, 2001), Cooney et al. (1996: 221) have experimented on the development of the function concept by starting with “an authentic situation” and “the modeling of real life situations”. The effectiveness of the use of innovative curricular approaches is also demonstrated by studies carried out on the development of the function concept at various grade levels using the “Walkathon context” (Kalchman & Fuson 2000; Kalchman & Case 2000: 241; Kalchman 2001). Van de Walle (2004: 440), working with ideas from NCTM (2000) reform curricula, provides a number of ways of “developing functions in the classroom” by beginning with meaningful contexts and using multiple representations. The use of word problems provides activities that relate to what the students experience in their daily lives. Word problems provide the opportunity to use functions as models of real world situations and these models can be represented in many forms. The word problems used in many mathematics classrooms are usually contrived problems (Cangelosi 1996) derived from some real life situations. This is because the computations involved in solving some of the real life problems can be cumbersome for pupils who have no access to calculators and/or mathematical computer programs. This will create obstacles that prevent learners to focus on the aim of word problem, which is to explore functions. Word problems have the potential to allow learners to move through different representations, from words to diagrams or tables, graphs to symbolical representations. The symbolic model makes it easy to access many characteristics of a problem but this is not easy to attain particularly in the lower secondary school. The other representations of models of problem situations, the verbal description, tables, graphs, have been found to be easier for the learners to relate with and to understand.
32
The major obstacle in this approach is the problem of language. In Zimbabwe mathematics is taught in a second language, English. In the classroom, language is needed for communication, to process ideas, to “diagnose and assess students’ understanding by listening to their oral communication and by reading their mathematical writings” (Thompson & Rubenstein 2000: 568). The textbooks and most other available materials for teaching and learning mathematics are written in English. Everyday experiences for the students are usually expressed in the vernacular languages. For most of the pupils English is used mostly in school and not in the home. Thus the problem of language in the learning of mathematics is likely to affect negatively the development of the function concept particularly in the interpretation of the word problems. Some of the issues related to problem solving and language include: •
The wording of the problems that appears to influence students' representations and therefore their solutions.
•
The special character of word problem text leads to an interpretation that differs from the interpretation of the same items in a narrative sequence or discourse.
•
The way relations between the given and the unknown quantities are expressed.
•
The order of items of information.
•
The degree of attraction of some expressions or words or the use of key words.
•
The complexity of the syntax and vocabulary.
This is why various contexts and representations should be used to minimise the problems of language. Central to the above approaches is the idea of functions being models of real life phenomena. The traditional approach of teaching functions starts with a definition followed by a lot of examples of functions. The knowledge of functions would then be applied to solving problems. Here it is through solving problems that the concept evolves. Freudenthal (1973: 374) argues that: …we can imagine them and speak about slot machines and work in many ways with a function concept that springs most directly from reality, without saying what a function and a mapping is and this "can" and is even a "must". After a pupil has met with thousands of functions, has composed and invented them, it is a paradigm of mathematical activity to have him invent and formulate what a function is.
33
Looking at the historical development of the function concept it was the need to solve practical problems that saw the evolution of the notion of a function as a way of modeling problems mathematically. If functions are approached this way they can be used to make connections between mathematics and the real world phenomena. Dossey, Giordano, McCrone, and Weir (2002: 173) consider functions to be the “key to student understanding of algebra and modelling”. They exist naturally in everyday situations and provide the connections between mathematics and the real world. According to Cooney, Brown, Dossey, Schrage and Wittmann (1996: 56): The origins of the function concept is in the study of natural phenomena…mathematical functions play an increasingly significant role in the study of the biological sciences, human and social sciences, business, communications, engineering and technology…The learning of mathematics can be greatly facilitated by enabling students to see functions, and mathematics more generally as connected to issues related to real-world phenomena and not to see mathematics as a subject separated from human activity.
Cooney et. al (1996) and Freudenthal (1973) believe that most functions that are studied as prototypes of families of functions can be introduced before theories that define them are studied. Pupils can experience sine and cosine functions, exponential functions etc. before the study of trigonometry and logarithmic functions respectively. The current approach to functions, in which the introduction emphasises the symbolic representation, does not reveal the natural occurrence of functions in the real world situations making the development of the concept artificial and difficult for most students. Functions are met much earlier in the primary school mathematics curriculum through the study of other concepts such as simple proportion, rate of change, formulae. This background knowledge can be used as the pre-knowledge in the introduction of the function concept at lower secondary school.
2.3.2.4
The role of multiple representations
If functions are approached as models of real life situations the first stage in the modelling process is representation. Representation (of relationships between variables) allows the translation of the real world situation into the mathematical world (Yerushalmy & Shternberg 2001). According to Schultz and Waters (2000), representations have many important roles in the teaching and learning of mathematics.
34
In the development of the function concept representation have a two-pronged role: (1) as different ways of expressing a function and (2) as a way of expressing the reasoning strategies student employ in the development of the function concept. They help students to organize, create, record, understand and communicate mathematical ideas. They are useful in modelling and interpreting physical, social, and mathematical phenomena. They enhance problem-solving abilities and provide windows to students thinking as they work. The representations of functions can be a context (physical objects, picture, diagram), verbal (words), numerical (list, table), geometric (graphs) and symbolic (equation, formula). In teaching functions the learners should be encouraged to represent function in many ways. They should develop knowledge and understanding of each representation and also connect the various representations. The use of multiple representations does not only help to develop generalised procedures but each representation has “its own insights into functions” (Confrey & Smith 1991: 3). Each representation helps to bring out certain characteristics of functions and is a means of expressing or communicating functional relationships. Some learners prefer to feel or experience the situation, others to visual information and yet others understand the situation better if it is symbolically presented. All learners will benefit from being given the representations in parallel forms (Mason 2005) to help them to see the connections. Coulombe and Berenson (2001) suggest that representations be taught as tools for learning. Each form of representation provides a different way of expressing a functional relationship. The different ways of presenting functions do not necessarily emerge at the same time in the learner’s understanding. The use of physical objects to represent a functional situation is at a lower level of abstraction than using a table. The use of graphs as representation of mathematical ideas demonstrates a higher level than the table. Within each type of representation learners go through different levels of understanding, from block graphs to Cartesian graphs, letters as place holders or abbreviations to letters understood as variables (Anderson 1978; Kuchemann in Hart 1981; Shuard & Neill 1977; Kerslake in Hart 1981). The development of the function concept emphasises the need for learners to
35
be able to move from knowledge of letters as representing known and unknown to letters representing variables and constants (Sierpinska 1992). The latter may not be accomplished at Form 1 level. Knowledge of graphs involves being able to draw, read and interpret the graphs as well as moving from a procedural understanding of these processes to a conceptual understanding. Words are a powerful way of expressing and representing functions. The first notation of functions is words used to describe functional situations such as depend on in ‘the telephone charge depends on the length of the call’. Later these words are replaced by symbolic language and this requires knowledge of algebra. Mason et al (2005: 23) described algebra as a “language of expressing generality”. Verbal descriptions are likely to dominate in the early stages of the development of the function concept.
2.3.3
Teaching functions through the problem-centred approach
Research shows that students can begin to learn about functions starting with problembased tasks before a formal definition of functions is given. The method allows for the pre-knowledge of the learners to be the basis of the development of functions. According to Gravemeijer, van den Heuvel and Streefland (1990: 19) problem solving becomes "problem-centred, that is, rather than using it as a mathematical tool, the problem is the proper aim". The problem-centred approach gives students an opportunity to learn. Students will develop perspectives of mathematics as a human construction instead of handed down knowledge. Through the process of solving problems students will start developing mathematical ideas. In Murray, Oliver and Human (2000: 30) the problemcentred model for learning and teaching mathematics is described as: Learning occurs when students grapple with problems for which they have no routine methods. Problems therefore come before the teaching of the solution method. The teacher should not interfere with the students while they are trying to solve the problem, but students are encouraged to compare their methods, with each other, discuss the problem, etc.
As indicated by Freudenthal (1973) students should be able to illustrate their intuitive thinking about functions and use that as a background to the development of functions and an opportunity to construct the mathematics themselves. 36
The kind of learning described by Murray et al (2000) depends a lot on the nature of classroom tasks that the students do. Hiebert, Carpenter, Fennema, Fuson, Wearne, Murray, Oliver, and Human (1996: 12) described the “critical features of classrooms” that can allow a problem-centred approach help students understand mathematics. The classroom tasks that students do must be problematic to the students and within their reach. They must be accessible to all students and should leave a residue of mathematical value. The teacher selects tasks that are reasonably familiar to students, shares information with the students, guides and directs the classroom culture. In the classroom culture ideas and methods of every student are valued; mistakes are considered as learning sites. Every student must be heard and every student must contribute. The classrooms need mathematical tools as learning supports. Students must construct meaning for the tools and the tools must be used for a purpose such as recording, communicating and thinking about mathematics.
2.4
CONCLUSION
The literature reviewed supports the early introduction of the function concept in the school curriculum. The historical evolution of functions indicates that the idea of a function can be introduced through a need to describe changes that are observed in real life situations. Over the years these origins of functions have been gradually under played. When functions were introduced to the school curriculum it was the final structural definition that determined when and how functions are taught. Students have had problems understanding functions. One of the causes of the problems coming from literature is the loss of real meaning and application of functions. Functions are an everyday phenomena and the teaching, at least in the introductory stages, should emphasize operations or procedures and not the structural aspects. According to (Sierpinska 1992, Cooney et al 1996) functions can be introduced as mathematical models of the real world situations. The introduction can be more effectively done
37
through the notion of dependence (co-variation) approach (Freudenthal 1773; Cooney et al 1996; Borba & Confrey 1996; Confrey & Smith 1994, 1991). Van Ameron (2003: 71) says, “competence in algebraic reasoning and symbolizing are separate issues” and should not be used to delay the teaching of functions. Functional reasoning can be developed before algebraic concepts are formally introduced hence functions can be introduced in the pre-algebra stage. In the early stages students should be initially confronted with purely functional situations, where they must establish functional relationships independently of any equation solving (Kieran et al 1996). The approaches used to introduce the concept must be carefully selected to lay a strong foundation for further development. The use of rich contexts and multiple presentations can make the early introduction of the function concept interesting and meaningful for the learners.
38
CHAPTER THREE RESEARCH METHODOLOGY AND DESIGN
3.1
INTRODUCTION
The main purpose of this study was to introduce of the function concept at Form 1 level in the Zimbabwe secondary school mathematics curriculum,. The experiment involved designing learning tasks on the function concept and carrying them out with a group of students who were being introduced to algebra. This chapter describes the research design, the population and sample that were involved in the teaching experiment, the method that was used to develop the function concept and how data was collected, recorded and analysed.
3.2
THE RESEARCH DESIGN
The study involved conducting a teaching experiment with a group of Form 1 pupils from a local secondary school in Mutare urban. According to Steffe, Thompson and Von Glasersfeld in Kelly and Lesh (2000: 267); Teaching
experiments
afford
researchers
firsthand
students'
mathematical
learning
and
reasoning…Students' mathematics is indicated by what they say and do as they engage in mathematical activity, and a basic goal of research in a teaching experiment is to construct models of students' mathematics…The teaching experiment is an exploratory tool, derived from Piaget's clinical interview and aimed at exploring students' mathematics…
In this study the teaching experiment was chosen for two reasons. First, the researcher wanted to have firsthand experience of introducing the function concept to a Form 1 class. The teaching experiment would afford the researcher to learn more about functions and how pupils developed the concept in the early years of secondary school. Secondly, in order to clearly conceptualise the theory developing in the literature reviewed, one
39
needs to implement the ideas to get more information on the experiences and the nature of the outcome of the proposed curriculum innovation. The study involved a qualitative analysis of the function aspects the students developed and the reasoning strategies they used in the teaching experiment. The main source of data for assessing the development of the function concept and the strategies the pupils were using was the pupils’ written work. This source was backed up by tape recordings of group discussions captured when pupils were working in groups on different tasks. Interviews were also conducted with some of the pupils.
3.3
THE POPULATION AND SAMPLE
3.3.1 The population The population from which the sample was drawn was a class of Form 1 pupils attending an urban co-educational day school in Zimbabwe. The school is situated in a low-density suburb that enrolls from both the low and high-density suburbs of Mutare. The lowdensity area houses mainly middle to high income groups while the high-density area offers accommodation mainly to people in the low-income groups. However, most of the pupils attending the school from the high-density area could be from the low to middleincome groups who are attracted by the relatively low fees at the school. The coeducational day school has streams from Form 1 to Form 6. The school enrolls five classes of Form 1s with up to fifty pupils in each class. The ratio of girls to boys is about 1:1. The Form 1 classes are not streamed and can be assumed to be of mixed ability.
3.3.2 The sample A convenient sample was used in the study. These were students available to participate in the teaching experiment. The only days the researcher had access to the pupils was on Mondays, Wednesdays and Fridays. These are the days that the school had sporting activities and clubs. Pupils who were heavily involved in sport and club activities were not included in the population of the Form 1s from which the sample was drawn. Hence, to ensure maximum regular attendance of lessons during the teaching experiment, a
40
convenient sample of six boys and four girls was drawn from a Form 1B class. Their ages ranged between thirteen and fourteen years. These pupils were selected from those who had indicated that they were not actively involved in sports and had written Test 1. Twenty-four out of forty-five pupils wrote Test 1 that assessed the pupils’ level of functional reasoning at the beginning of the experiment. From the Test 1 pupils who exhibited some functional reasoning and explained their solutions clearly were selected. The explanations helped to provide information about the pupil’s level of functional reasoning.
3.4
DATA COLLECTION AND RECORDING
This section describes the teaching programme, teaching method and the instruments that were used to collect data. In the teaching experiment the researcher is also the teacher.
3.4.1 The teaching programme Initially the teaching experiment was designed to run for ten weeks during the first school term when the pupils were beginning their secondary school. This was changed to begin in the second term because during the first term all secondary schools in Zimbabwe are involved in sports in preparation for various competitions. These include house competitions in which almost all the pupils participate. This means most of the outside lesson time is reserved for sports preparations and practice. The teaching experiment took place during the second term when schools have ball games and fewer pupils are involved in competitive sport. However the school holds mid–year examinations during this period hence it was not possible to fit the teaching programme in one term. In the end the teaching experiment ran for nine weeks spread through two school terms, terms two and three. The teaching experiment involved designing a teaching programme (see Appendix I) in which one and quarter hour lessons were conducted on average three times a week. The school runs one session a day from Monday to Friday throughout the school year and a session runs from 07:30 – 15:30. The Form 1 classes are allocated six lessons a 41
week on the timetable and a lesson is 35 minutes long. A topic is usually planned to be completed in one or two weeks. Long topics are broken down into subtopics. The Form 1 mathematics syllabus at the school is based on the main textbook, “New General Mathematics 1 by Channon, McLeish Smith, Head and Macrae”. By end of the first term the pupils had been introduced to symbolic expressions. The pupils that were involved in the study were taught during one study period and two sport/club periods each week. The study and club periods were timetabled in the afternoon from 14:10 – 15:30. The lessons were conducted in the pupils’ base room, the classroom from which they attended most of their usual lessons. There is a shortage of classrooms and it was difficult to secure a free room to carryout the experiment. When it rained or when the weather was unfavourable for outdoor activities, the teaching experiment class had to be cancelled to allow the rest of the class to use their base room. This happened quite often and sometimes no lessons would be held for a whole week. This resulted in the teaching experiment covering a period of three months, from beginning of July to end of October. In July only 8 lessons were conducted during the first two weeks of the month because pupils had to write their school terminal examinations during the last weeks of the term. During August and the first week of September the pupils were on school holidays. The teaching experiment resumed in the second week of September to end of October. A further 18 lessons were conducted making 26 lessons conducted during the duration of the teaching experiment. Some of these lessons were used for writing tests. The interviews with some of the pupils had to be conducted during the lessons too. The pupils’ interest in the teaching experiment grew with time. They called the teaching experiment a mathematics club; perhaps it is because the lessons took place during the club and sporting activities time.
3.4.2 The lessons In this study the development of the function concept was based on the following assumptions: ¾ Acquisition of the function concept refers to the learners’ application of
42
functional reasoning in problem solving. The learner cannot or need not define a function at this level. ¾ Development means transforming functional reasoning strategies into more efficient forms. For example from describing a rule recursively to describing it co-variationally or from representing a rule verbally to expressing it symbolically. ¾ Development of function aspects (change, relationships, rule, representation and language) can be achieved through doing tasks that require the use of functional reasoning. ¾ Acquisitions of function aspects are hierarchical and interrelated. This means ability to describe a rule implies recognition of change and relationships. ¾ The strategies learners use to solve problems reflect their stage of development of the function concept. ¾ Performance on tasks relate to the learner’s functional reasoning and abilities as defined in identified stages of development of the function concept in Table 2.3 (Chapter Two). ¾ Responses on the tasks can be classified according to the identified stages of development of the function concept. The role of the researcher in this experiment was to design and provide the appropriate learning tasks and experiences. In each lesson the researcher started by giving the pupils a task to do. The pupils were given time to work on the tasks individually or in groups of four. When some of the pupils dropped out of the teaching experiment the numbers per group dropped to two. No criterion was used to allocate the pupils into groups. Initially pupils chose whom to work with until gradually the groups became more permanent. At first the girls opted to work alone and the boys alone but later the groups became mixed. The two girls who remained in the study preferred to work together most of the time. After spending time on a task a whole “class” discussion would follow in which group and/or individual solutions were presented and discussed. Most of the class discussions were audiotaped.
43
3.4.3 Instruments Development is a transformation hence it was necessary to assess where the pupils were starting from in their functional reasoning. A Test 1 was used for that. After the Test 1 the pupils worked on tasks that would help them transform the knowledge of functions they had into more efficient forms. At the end of the experiment the pupils were assessed for the extent to which their initial knowledge on functions had developed.
3.4.3.1
Test 1
A Test 1 was administered to the group (see Appendix II). The Test 1 was used to establish the pupils’ existing knowledge of functions. It was necessary to determine the pupils’ entry point and how they would present their work, for example explanations to their solutions. How explicit would the explanations be in order to assess the pupils’ current knowledge of functions and later their progress during the teaching experiment. In Zimbabwe, the language of instruction in mathematics is officially English and all textbooks and other learning materials are prepared in English. The pupils in the experiment were taught in English, which is a second language. Teachers sometimes revert to the pupils’ first language in order to clarify a point and students do the same. In the experiment English was used as a language of instruction. There was room for the pupils to use Shona, the language all the pupils used at home, whenever they needed to. Cooney et al (1996: 38) stress the importance of creating activities that build on what the students know when teaching functions. The teacher should know what the students are thinking and how they are thinking about the mathematics being studied. The items in the Test 1 included the aspects change, relationships, rule and representations. Most of the items in the test were based on the primary school mathematics Grade 7 textbooks. Grade 7 is the graduating grade from primary to secondary school. The items included word problems, patterns, “Guess My Rule” game, tables of value, ready-reckoner graphs. The items on patterns and “Guess My Rule” game were included to find out how much knowledge the pupils had on patterns and how they would respond to these unfamiliar situations. Patterns in this study are considered to be central in the development of the
44
function concept. Pupils will look for patterns to analyse change, to establish relationships and to find rules.
3.4.3.2
Learning Tasks
The objectives of the tasks were to enable the pupils: •
Identify and describe change.
•
Identify and describe relationships.
•
Use a variety of representations verbal, arrow diagrams, tables, graphs and symbols.
•
Move between these representations.
•
Find and state rules to express relationships.
•
Use appropriate language to express functional relationships.
The tasks were mostly paper and pencil activities prepared on worksheets. Pupils were also provided with other learning materials such as toothpicks, card polygons, and geoboards to build shapes. The learning tasks involved patterns, function machines or input-output diagrams and word problems (See Appendix II). The tasks on patterns were introduced first. According to Van de Walle (2004) and Dossey et. al. (2002), pattern analysis helps students learn to describe, abstract and generalize relationships. Further, Van de Walle (2004) recommends the use of growing patterns as an entry point to the idea of a function. In the Zimbabwean school mathematics syllabuses, both primary and secondary, the idea of pattern is not explicitly specified as a topic to be taught as done in some reform curriculum such as the NCTM Curriculum and Standards 2000 and South Africa’s Revised National Curriculum Statement 2002. A lot of pattern identification, description and extensions dominated early lessons to give the pupils in the study the preknowledge they needed to use patterns in learning about functions. In this study the initial development of the notion of a function was based on dependence and the idea that a function is a rule that uniquely defines how the first or independent variable affects the second or dependent variable. To get the rule it is assumed the pupils would need to able to observe and describe change and relationships. The task would ask the pupil to find a rule or method; in the process of doing that change, relationships, use a
45
variety of representation would be explored and the language of functions developed. The aspects therefore were not necessarily taught separately, on a hierarchical scale, but were expected to emerge in the process of solving a problem. Some parallel development was assumed. In the early lessons pupils were directed and encouraged to use different representations for example verbal description, physical objects (manipulative) or pictorial drawings and tables. Later the tasks did not specify the representations to use but expected the pupils to use and move between the different representations. The table would be used for example to record data obtained as pupils built a string of tiles. The results in the table would be analysed for patterns in order to come up with a rule to find the perimeter of any string of tiles made from, for example, any number (N) squares or hexagons (e.g. Task 5-Activity 4 in Appendix II). Pupils worked on the tasks individually or in groups of two or three depending on the number of pupils present during a lesson. Most of the individual tasks were followed by group discussions. There were also whole group discussions in which all the pupils and the researcher came together and discussed the task solutions. This was done to: •
Make the pupils compare their solutions and strategies; test their conjectures, negotiate meanings and reach a consensus on the most appropriate solution(s).
•
Provide the teacher/researcher with an opportunity to analyse the pupils’ reasoning strategies and the direction in which the function concept was developing.
•
Help the teacher/researcher to channel the direction of the development of the concept.
3.4.3.3
Assessment Tasks
Data to assess the pupils’ development of the function concept was generated from both the learning tasks and assessment tasks. The difference between the two modes of assessment was the nature of tasks and when they were done. The assessment exercises from learning tasks were given at the end of using a particular context. For example after
46
using patterns to explore functional reasoning the pupils would do an individual task on patterns that the teacher would use to get feedback and assess progress. The three assessment tasks covered the various contexts used and were given towards the end of the experiment and written under test conditions. Test 2 had a wider coverage of the aspects change, relationship, rule and representation while Test 3 focused more on the pupils’ ability to work in and with different representations. The teacher/researcher interviewed two pupils as a follow up to the assessment tasks to probe further the pupils’ responses and to seek clarification on how they were thinking. No particular questions or format (interview schedule) were used in the interviews. Responses to the assessment tasks were used to assess the learners for aspects of function they had developed and the level to which they had developed.
3.5
DATA CAPTURE AND RECORDING
During the teaching experiment pupils were provided with writing paper to record their responses. Most of the group and class discussions were captured on audiotape. At the beginning of the teaching experiment pupils were assigned code numbers that they had to use to identify themselves each time they made contributions. This would help to identify the pupils in the tape recordings and later in the transcription of data. The interviews were carried out during lessons as pupils worked on the tasks. The tape-recorded data was transcribed word for word.
3.6
DATA ANALYSIS AND PRESENTATION
The teaching experiment is mainly a qualitative analysis of pupils’ extent in the development of the aspects of function change, relationship, rule, representation, strategies and language use. In this study the focus was on one to one relationships. The main source of data was the pupils’ responses to the tasks. The tasks were not set at
47
specific levels but were selected in such a way that the learner’s response would reflect the level of their function development. For example Test 1 Q2: Suppose I agree to pay you Z$200 for every hour you work. Give a method that we could use to calculate your pay after you finish the work.
There are several possible responses to this item: 1.
I need to know the hours worked to find the answer.
2.
I multiply Z$200 by 8 hours.
3.
I multiply Z$200 by the number of hours I work.
4.
Let x be the hours I work. Then Z$200x is my pay.
Here ‘method’ in the task suggests a process or an operation that generalizes the given situation. The pupils need to realize that hours worked is a variable and the pay depends on the hours worked. Although response (1) suggests an understanding of dependence between pay and hours worked it does not adequately address the question hence it will be graded at L0 in terms of functional development. Response (2) is an improvement of (1) and rated at L1. Response (3) is an improvement of (2) and rated at L2. Response (4) is an improvement of (3) in terms of representation would be rated at L3. However response (1) would score for an indication of identifying relationships (dependence) if the question asked “How much would I be paid?” The same item(s) could be analysed for change (identification of variables and constants).
3.6.1 Data analysis instruments The responses of each of the seven pupils on each task were analysed and classified into the relevant levels of function development. The instrument that was used to assess the level of the responses is presented in Table 3.1, which is a refinement of Tables 2.2 and 2.3 in Chapter Two. Some aspects may not be accurately placed in levels of development. For example under representation, the use of lists and tables is not at the same level of complexity as Cartesian graphs and the use of symbolic expression. However at Form 1 level the meaning of tables, graphs and symbolic expressions is not yet understood as representing functions. In this study the focus was more in the use of the various representations than understanding their meaning.
48
TABLE 3.1: The refined hypothetical stages of development of the function concept at Form 1 level. Aspect Change
Level 1 - indicators • Recognizes both qualitative and quantitative change • Variables are unknown quantities Relates change within a variable: recursive/ iterative.
Level 2 - indicators • Identifies both qualitative and quantitative change • Can distinguish between the constant and the variable C1 quantities C2 Relationship Relates change between variables - dependence: R1 • Co-variation • Correspondence R2 Rule • Computes iteratively between strings of positive whole • Computes within a string of positive numbers in data columns –Co-variation [f(x n+1) = f(xn)+a)] whole numbers. Recursive/ Iterative (tn+1 = tn+a) • Iteratively apply a combination of operations on a string of • Iteratively apply a single operation on a numbers to generate a second string of numbers string of numbers to generate a second Correspondence [y = ax + b]. string of numbers. Proportion (equality of two ratios is F2 generalized) [y = ax] F1 Representation Use: Use: • lists, tables, ordered pairs • Context - physical objects, picture, diagram to - to represent pairs values represent and /or solve a functional - to discern a pattern and describe a relationship and/ or rule situation • Cartesian plane • Verbal expressions - plot pairs of values - to represent a rule or describe a - join the points strategy, - put input (independent value) on horizontal axis and output (dependent value) on vertical axis. • Block graph - categories on horizontal axis are understood as continuous - reads bars as discrete quantities from quantities. the vertical axis. - see patterns of qualitative change • symbolic expressions P1 - to represent relationships and/ or rule - letter stand for abbreviations or unknown number or quantity. P2 Language Use: Use: • Words used e.g. big, small, input, output • Words such as change, depend, input, output and vary with a with no special meaning from their special (collective) meaning. everyday context. • Letters and other symbols stand for • Letters and symbols variables abbreviations, placeholders and unknown. L2 L1 Strategies • Look for regularities (explore patterns and generalize). • Context - build or continue a pattern to find missing values. • Ratio approach – equality of ratios is generalized from many examples. • Ratio approach – generalizes from one step/ situation only. • Functional approach – attempts to relate the input to the output by: • Additive /recursive approach – - Making a table, discern a pattern, add more values and find recognizes that a quantity increases by those that are missing. some amount from step to step. S1 - Drawing a graph (use to find solutions) - Using algebra (make equations and solve) S2
49
Response analysis tables (APPENDIX III) were constructed for each task item and used to assess the level of a pupil’s response. Table 3.2 is an example of an analysis of pupils’ responses. TABLE 3.2 Sample solutions for the Test 1 Q.8. (Appendix II) Response
Aspect
For me to get the answer I calculated the number of cans required for 50 rows then multiplied by 2
Change
Test 1 Level C2
Relationship
R1
Rule
F2
Representation
P1
Recognises change in the number of rows and number of cans. Assumes a proportional dependence relationship. Operates on number of rows to get the required number of cans. Solution is verbally expressed
Language
L1
No special words
Strategy
S1
Ratio
Here she ended up at 5 row. And if you see carefully they are adding two rows to get the number of cans. So you say 99 + 100 = 199
Change
C2
Relationship Rule
R2 F2
Representation Language Strategy
P1 L1 S2
I multiplied 5 by 100th row because it has got 5 row I got 200 cans by each row is adding up to two to find for the next row. For us to find the 100th row we multiply 100 by 2
No sense
L0
Change Relationship Rule Representation Language Strategy
C1 R0 F0 P1 L1 S1
Recognizes change in the number of rows and number of cans. Relates row number to number of cans. Operates on number of rows to get the required number of cans - functional. Solution is verbally expressed No special words Operates on the input to get the output – functional No indication of developed aspects in this solution. Identifies change partially No sense Wrong application of proportion Solution is verbally expressed No special words Ratio
th
Comments
Although every aspect is analysed in the table, this was not the case with most of the tasks. It was difficult to come up with a task that would clearly address all aspects specifically. There were many overlaps and the dominant aspect(s) was assessed. In a task that required finding a rule, the analysis would focus mainly on that aspect. The codes, C1, C2, R1, R2, and so on, were used in the analysis of the actual pupils’ responses to help in identifying both the aspect and the level of development. Although the analysis was mainly qualitative, the solutions to the tasks were also quantified to obtain a graphical representation of the development. The responses were rated in terms
50
of levels, from 0 for a no sense response or a response that was judged to be below Level 1, to 1 for a response at Level 1 and 2 for a response at Level 2. To avoid totally obscuring the “actual” level of development in an aspect by combining ratings for different items, addressing different aspects additional information on performance in the tasks is provided through excerpts of some of the pupils’ responses. See Appendix V. Representation, apart from providing the learners’ level of conception of functions, also partially provides information on the language development. For example using a table to provide a solution to Test 4, Q3: Tapfuma works part-time during the holidays selling newspapers. He receives Z$10 000,00 as basic salary per week, plus Z$400,00 for each newspaper sold. How much can he earn a week?
No. of newspapers Money earned
1 10 400
2 10 800
3 11 200
4 11 600
5 12 000
6 12 400
The tabulated response is limited to specific values while a verbal response, such as “He can earn $10 000 + 400 x newspaper he had sold” gives the general picture, the whole domain of possible number of newspapers. The verbal response reflects a higher level of understanding of a functional situation. Unfortunately this is not clearly distinguished in Table 3.1. As representations, the verbal statement has been classified lower than the tabular representation but as a language, the verbal expression has a deeper meaning or expresses a more complex solution. To overcome this problem such solutions were assessed for the level of development of the aspect change. The table was classified as C1, number of newspapers sold understood as unknown and the verbal expression as C2, number of newspaper sold understood as a variable.
3.6.2 Data presentation The extent of development of the function concept that was analysed for each of the seven pupils in the study was presented in tables (see Appendix V). The experiment was divided into three stages. These were Test 1, the Learning Phase and the Assessment. Data was collected at each stage and analysed for each pupil’s level of development in
51
each of the aspect change, relationship, rule, representation and language. Three contexts were used in the design of the tasks, namely patterns, word problems and function machine (input - output contexts). Data was analysed for each aspect in each context at each stage for each of the seven pupils. Table 3.3 provides an example of a presentation of pupil’s extent of development of the aspect change at each stage in the experiment. It includes development in the different contexts that were used, patterns, word problems and function machines. TABLE 3.3: The levels of development of each of the seven pupils in the aspect change in various contexts at the three stages of the teaching experiment. PUPIL Context (Task item) Aspect - change
TEST 1 Pattern WP
FM
LEARNING PHASE Pattern WP FM
ASSESSMENT TASKS Pattern WP FM
COMMENT Development progress
003 008 011 017 021 022 023
A similar table to the above was used for each aspect. The results were then summarised to assess the level of development of each aspect at each stage irrespective of the context used. Table 3.4 represents that summary. TABLE 3.4: A summary of the seven pupils’ extent of development of each of the aspects of the function concept at different stages in the teaching experiment. STAGE Pupil ASPECTS
TEST 1 0 0 3
0 0 8
0 1 1
0 1 7
LEARNING PHASE 0 2 1
0 2 2
0 0 2 0 3 3
0 0 8
0 1 1
0 1 7
0 2 1
0 2 2
ASSESSMENT 0 0 2 0 3 3
0 0 8
0 1 1
0 1 7
0 2 1
COM MENT 0 2 2
Change Relationships Rule Representation Strategy Language
52
0 2 3
In Test 1 to Test 4 several items were set. The qualitative analysis of the nature of responses in these items was quantified to get a score for each of the seven pupils. In other words A-level 1 scored 1 and A-level 2 response scored 2. This quantitative analysis helped to present the development graphically using bar graphs.
3.7
PILOT STUDY
The pilot study used six pupils coming from the same backgrounds and primary schools as the pupils in the study in order to improve the language of the tasks to help the pupils understand what was required. However the instruments used for the data collection and data analysis were not pilot tested owing to the non availability of the students.
3.8
TEST FOR VALIDITY AND RELIABILITY OF MEASURING INSTRUMENTS
The critical questions that required validating were: Do the learning tasks develop the function concept? Are all the aspects to be developed covered in the tasks? Does the assessment instrument provide adequate and accurate information on the development of the function concept? Do the assessment tasks measure the aspects that were assumed central to the development of function concept? No statistical tests and analysis were used hence the content validity remains a factor that can affect the results of this study. The researcher relied on the sources from which the tasks were obtained and the data analysis instrument was derived. The learning tasks were adapted from sources that promote the teaching of functions in Form 1 level. The data analysis instrument was developed from Kalchman’s research (2001) carried out with students between the ages of (9 – 19) years. In this research, quoted in this chapter, the levels of development of the function concept according to age groups were identified. The levels identified for two age groups, (9-11) years and (11-13.5) years were 53
adapted for the current study. It was assumed that these are suitable to the pupils in the study because they learn in a rather disadvantaged environment in terms of resources and the differences in the mathematics curriculum.
3.9
CONCLUSION
The study explored the development of the function concept at Form 1level. This implies that the teaching approach and the instruments continued to be developed and improved in the process of the study. The results of the study provide answers to what happened as well as what improvements should be made to come up with a successful curriculum. The study is developmental.
54
CHAPTER FOUR DATA ANALYSIS, PRESENTATION AND INTERPRETATION
4.1
INTRODUCTION
The purpose of this study was to investigate Form 1 pupils' development of the function concept in order to determine: The extent to which the group of Form 1 pupils in a Zimbabwe secondary school developed the function concept. This entailed an assessment of the extent (in terms of level of development) to which the pupils’ developed the aspects function, change, relationship, rule and representation during the teaching experiment. How far beyond the initial knowledge of functions and how much into the next level was each pupil moved as a result of the teaching experiment? The teaching experiment also provided an opportunity to assess some of the constraints of introducing the function concept at the pre-algebra stage and these will be highlighted.
4.2
DATA ANALYSIS, PRESENTATION AND INTERPRETATION
4.2.1 Data sources Four students (two girls and two boys) dropped out of the teaching experiment in the early stages for unexplained reasons. Of the eight who had remained, one had a rather erratic attendance while the other seven continued to attend the lessons regularly. The one with an erratic attendance was excluded in the data analysis. The written work responses and the data captured in the audiotape were used to assess the pupils’ development of aspects, change, relationship, rule and representation of the function concept. The data
55
collected from pupil’s written work and audiotape transcriptions of contributions captured as they worked in groups or in whole class discussions was analysed for development in the various aspects of the function concept. Some pupils tended to dominate in these discussions but all participated enough for meaningful data to be captured. The main focus of the tasks was to find a rule or method that could be used to find solutions to problems set in various situations, for example, how to find the nth term in a pattern. Pupils were asked to give reasons or to explain how they got their solutions as a way of finding out their strategies. The various aspects of the function concept were either specifically addressed in some parts of the task or implied through the response to the task. According to Dubinsky and Harel (1992: 91) the nature of conception of a function that the subjects have is “not contained in the situation but rather in the subject’s relationship to the situation”. In the same manner the aspects of function that each individual pupil developed depended a lot on how the student responded to the task. In this experiment the nature of the task was very crucial in providing the opportunity for the pupils to acquire the aspects of function that have been hypothesized possible to develop at the pre-algebra stage. There are many variables e.g. the syntax, the context and the content of the tasks that seemed to affect the pupils’ responses to the tasks. Some pupils would work with a task and be able to recognize and describe change, identify relationships and find a rule to describe them. Other pupils would use the same task but would not go beyond recognizing change. In order to describe a rule pupils needed to go beyond observing relationships in changes to “identification of regularities in relationships between changes” (Sierpinska 1992: 31). Hence the ability to describe a rule was assumed to indicate ability to recognize change and relationships. For example, in the Test 1 q 2: Suppose I agree to pay you $400 for every hour you work. Give a method that we could use to calculate your pay after you finish the work.
A function solution would be a table or graph or an algebraic equation expressing variability, relationship, rule and representation (between the hours worked and pay) all in one. However this requires further probing because hours worked could be a specific amount, fixed in the student’s mind and not necessarily a variable. The probing was
56
expected to be through pupils’ explanation of their solutions, which was not often done in the paper and pencil solutions.
4.2.2 Analysis The data collected from Test 1, the Learning tasks and Tests 2, 3 and 4 was analysed (see Table 3.2) for each pupil’s development of each aspect of function, i.e. change (symbol C), relationship (symbol R), rule (symbol F), representation (symbol P) and strategy (symbol S). The assessment of language was based on the audiotape discussions, selected tasks and commented on for each pupil. The written language was assumed to be covered under the aspect representation. The results were analysed for the extent, in terms of levels, to which each of the pupil’s initial knowledge of functions (what they already knew or could do) developed. Test 1 was used to assess the pupils’ initial knowledge of functions. The items representing each of the three contexts: patterns, word problems and function machine, were used in the analysis. For example Test 1, q8. Task 5, Activities 4, 5 and Test 2 q1-3, were used to assess the development through patterns (symbol P) of the aspects of function. The same was done with the other contexts, word problems (symbol WP) and function machine (symbol FM). Effort was made to use the same tasks to analyse and assess the development of the aspects in each context at each stage. For example q8 was used to assess the aspects change, relationship, rule, representation and strategy under patterns in Test 1. This was done because the development of each aspect is not mutually exclusive but is influenced by the others.
57
4.2.2.1
Analysis of the level of development of the aspects of the
function concept at various stages during the experiment. The following are examples of three pupils’ solutions to Test 2 q4. The question required the pupils to complete the flow diagram and explain their method (APPENDIX III). The solutions illustrate different levels of development of the aspect strategy. FIG. 4.1 Pupil 021’s solution
The solution shows the pupil only used one pair of values to determine the rule that he could use to complete the diagram. This solution is classified at F1+ and S1+. The pupil establishes a dependence relationship between a pair of values (an input and an output). The blank boxes could have been a result of the pupil experiencing a conflict in the method and the given outputs, awareness of the need to apply the same rule to all the inputs to get the corresponding outputs. This is a development from A-level in which different operators are applied as was the case with pupil 017 who had +4 for the first pair and +7 for the next pair. Pupil 021 must have realized that +4 only apply to the first pair and stops. This reflects the beginning of the development of the fundamental idea of a function as a rule that uniquely defines how the independent variable affects the dependent variable (Van de Walle 2004). Pupil 008’s solution is classified at F2- and S2-. The wrong output suggests the use of the recursive approach. The two methods were not reconciled. However, the pupil shows both horizontal growth in presenting the rule verbally first then symbolically and vertical
58
growth in the use of multiple representations. She has grown into level 2 but must strengthen that by being consistent. FIG. 4.2 Pupil 008’s solution
Fig. 4.3 below shows a pupil classified as F2, S2. His representation of the solution is Alevel higher than 008 because of the use of the variable input in expressing the rule. It is an indication of developing a language of functions and is classified at level 2, L2. FIG. 4.3 Pupil 023’s solution
59
When the analysis of an aspect was done from more than one item a representative level was approximated. For example, F2, F1, F2 would be approximated to F2- and F1, F2, F1 would be approximated to F1+. The summary in the last column of each table is based on the estimates of the levels at each stage. For example the 2, 2, 2 for 003 are based on the levels under each stage Test 1, Learning phase and Tests 2, 3, 4. It became quite evident in the data analysis that there are different levels of understanding a concept, for example a table of values. This was mentioned in Chapter 3 that there are levels of development within each aspect. The application of the instrument described in Chapter three requires introducing other levels within level 1 and level 2. These were summarized as follows: TABLE 4.1: Additional levels of development used in the analysis of data LEVEL 1
LEVEL 2
1-
1
1+
2-
2
1
2
3
4
5
Numerical values were assigned to the levels in the tables in order to come up with graphical representations of the development. The analysed data is summarized and presented in Tables 4.2 to 4.6. The results in the tables are supported by excerpts of some of the pupils’ responses in each stage and from the three contexts, patterns, word problems and function machine. Table 4.4 represents responses of the seven pupils on various tasks in the experiment and how these were analysed and classified into levels for the aspect rule (F). The data presented in the tables show the development of each aspect within a context at different stages in the teaching experiment and between different contexts.
60
TABLE 4.2: The development of the aspect change (C) for each of the seven pupils at different stages in the teaching experiment
PUPIL Context (Task item) Aspect change 003 008 011 017 021 022 023
TEST 1 P WP q.8 q.2& 3
FM q.5
C1 C2 C1 C1 C1 C1 C1
C2 C1+ C2 C1 C1 C1 C2
C2C1+ C2C2C2 C2C2
LEARNING PHASE P WP FM T5 – T8 T7 Act. 4, q1-2 5
TESTS 2, 3, 4 P WP T1 T1 q.1-3, q5, T3 (c)
FM T1 q4, T2 1(a), (b)
Development progress
C2 C2 C2 C2C2C2 C2
C2C2C2 C2 C2 C2C1
C2 C2C2C1 C1 C2C2-
2-, 2-, 2-, 1, 1+, 1+, 2-,
C2 C2C2C1 C2abs.
C2-
C2 C2 C2 C2 abs. abs. C2
C2 C1C1 C2 C1C2C2-
SUMMARY
2, 2-, 2, 1+, 2-, 2-, 2-,
2 1+ 221 21+
FIG. 4.4: The development of the aspect change (C) for each of the seven pupils at different stages in the teaching experiment DEVELOPMENT OF ASPECT CHANGE 6
5
LEVEL
4
3
2
1
0 003
008
011
017
021
022
023
PUPIL TEST 1
LEARNING PHASE
TEST 2, 3, 4
61
The summary results in Table 4.2 and the graph in Fig. 4.4 show some fluctuation between levels in the development of the aspect change in four of the seven pupils. The other three show development upwards from their initial levels. Pupil 003 was already close to level 2 at the beginning of the experiment. The downward growth in 011, 021, and 023 could be attributed to a number of factors, one of them maybe the selection of tasks and the use of only the written work to assess development in most of the tasks. Interviews were done with a few. What the pupils put down may not have represented all that they had in their minds. Pupils also had problems at times putting their idea across in English.
TABLE 4.3: The development of the aspect relationship (symbol R) for each of the seven pupils at different stages in the teaching experiment PUPIL Context (Task item) Aspect relationship 003 008 011 017 021 022 023
TEST 1 P WP q.8 q.2 &3
FM q.5
R1 R1 R1 R1 R1 R1 R1
R1 R1 R1R1R1 R0 R1
R2 R1R1+ R1 R1+ R1R2-
LEARNING PHASE P WP FM T5 – T8 T7C Act. q1-2 (iii), 4, 5 7D- q2
TESTS 2, 3, 4 P WP T1 T1 q1- 3 q5- 6 T3 (c)
FM T1 q4, T2
Development progress
R2 R1 R2 R1 R1 R2 R2-
R1+ R1 R2R1 R2R2R1
R2 R1 R2 R1R1R2 R2
1+, 1-, 1+, 1-, 1+, 1-, 1+,
R2 R2R2R1 R2abs. R2-
R2 R2R2R2abs. R2R2
R2 R1 R2R2R1R1 R2-
SUMMARY
2, 22-, 1 2-, 21+, 1+ 2-, 1+ 2-, 22-, 2-
The development in the aspect relationship from the initial levels is quite significant in all the pupils. Fig. 4.4 presents a clear picture of the development. There is a sharp rise in the learning phase indicating the effects of the teaching programme. The written work show dominance in seeing and describing recursive relationships to functional relationships. That is pupils could identify both relationships within and relationships between variables (see examples of solution to Task 5-Activity5 in the excerpts). In these excerpts pupils use both the recursive methods and the functional method to find rules.
62
FIG. 4.5: The development of the aspect relationships (symbol R) for each of the seven pupils at different stages in the teaching experiment.
DEVELOPMENT OF THE ASPECT RELATIONSHIP
6 5
LEVEL
4 3 2 1 0 003
008
011 TEST 1
017 LEARNING PHASE PUPIL
021
022
023
TEST 2, 3, 4
In Test 1 the results show that the recursive relationship dominated in the pattern context, while in the word problem tasks two pupils could describe relationships between variables, co-variation or joint relationships. In the function machine the “Guess My Rule” problem was used. This was presented both verbally and numerically in a table. Five of the seven pupils observed a recursive relationship in the given outputs and used that to complete the table. They do not, at this stage, see the dependence relationship between the input and the output that the game is promoting. In the learning phase the results show that the pupils are beginning to identify and use both the recursive and the dependence relationships although the latter still depended on the context and the task. They continue to operate the same way in Tests 2, 3, and 4. They continued to describe recursive relationships more, particularly when the situation was represented by a table. Pupils were still not very motivated to look for dependence relationships, which required them to analyse changes more closely. They could notice what changes but could not
63
connect the changes and establish relationship between variables. Six of the seven pupils show an upward development with four of these moving close to level 2. TABLE 4.4: The development of the aspect rule (symbol F) for each of the seven pupils at different stages in the teaching experiment. PUPIL Context (Task item)
TEST 1 P WP q.8 q.2 &3
FM q.5
003 008 011 017 021 022 023
F0 F1 F1 F0 F1 F1 F1
F2 F1 F1 F1 F1 F0 F0
F2 F1F1 F1 F1 F1F2
LEARNING PHASE P WP FM T5 – T8 T7C Act. 4, q1-2 (iii), 5 7D- q2 F2 F2 F2F1 F1 F2F2 F1 F1 F1 F1 F1F1 F2 abs. F2 F1 F1F2 F2 F1-
TESTS 2, 3, 4 P WP T1 q1- T1, 3 T3
FM T1 q4, T2
F2 F2F2 F1 F2 abs. F2
F2 F2F1 F2F2F2F2-
F2 F1F2 F1abs. F1 F2-
SUMMARY Development progress 1+, 2, 2 1, 1+, 21, 1, 2 1, 1, 1+ 1, 221-, 1+, 1+ 1, 2-, 2-
FIG. 4.6: The development of the aspect rule (F) for each of the seven pupils at different stages in the teaching experiment. DEVELOPMENT OF ASPECT RULE 6
5
LEVEL
4
3
2
1
0 003
008
011
017
021
022
023
PUPIL TEST 1
LEARNING PHASE
TEST 2, 3, 4
64
Initially in Test 1, pupils described recursive rules or dependence rules from accidental or wrong application of simple proportion. They continued to see recursive and proportional relationships in the learning phase. The use of proportion is said here to be accidental particularly in problems where it worked because it was not developed from an understanding of proportion as equal ratio between pairs of values. There was no checking whether or not all pairs of values in a table, for example were proportional, before stating the rule. At the end of the experiment more students operated at level F2. The function machine seems to have facilitated the pupils’ ability to see dependence relationship. The ability to state a rule depended on the demands of the task. In Test 1, q2 all the pupils were able to give the response: the payment is found by multiplying the hours worked by Z$200. This is a generalized statement although there is need to further probe whether the hours are being understood as a variable or unknown. For example in Test 4, q3 Pupil 023’response is “The information needs when there are newspapers sold”. The pupil seems not able to express the rule in tabular or graphical form because the values to make the table are not given. The pupil did not see the link between the different representations, verbal, table and graph although he was able to state a rule in words on how to calculate the money Tapfuma can earn a week. This emphasizes the need to use different contexts and multiple representations (Van de Walle 2004) in developing the function concept. They make the learning meaningful and contribute to the development of the aspects of function concept.
65
TABLE 4.5: The development of the aspect representation (symbol P) for each of the seven pupils at different stages in the teaching experiment. PUPIL Context (Task item) Aspect representat ion 003 008 011 017 021 022 023
TEST 1 P WP q.8 q.2& 3, 4, 6 P1 P1 P1 P1 P1 P1 P1
FM q.5
P1 P1 P1 P1 P1 P1 P1
P2P1 P2P1 P1 P1 P1+
LEARNING PHASE P WP FM T5 – T8 T7C Act. 4, q1-2 (iii), 5 7D- q2
TESTS 2, 3, 4 P WP T1 T1 q5q16 3 T3 q3
FM T1 q1-4, T2
Development progress
P2P2P2P2P2P2P2-
P2 P2 P2 P1 P1 P1 P1
P2 P2P2 P1 P2P2P2-
1+, 1, 1+, 1, 1, 1, 1,
P2P1 P2P1 P2abs. P1
P2 P2P2P2abs. P1P2
P2 P2P2 P2P1+ PI P2-
SUMMARY
2-, 2 1+, 22-, 2 1+, 1+ 2-, 1+ 1+, 1+ 1+, 1+
FIG. 4.7: The development of the aspect representation (P) for each of the seven pupils at different stages in the teaching experiment. DEVELOPMENT OF ASPECT REPRESENTATION 6
5
LEVEL
4
3
2
1
0 003
008
011
017
021
022
023
PUPIL TEST 1
LEARNING PHASE
TEST 2, 3, 4
The general picture in the summary show that the representations described in Table 3.1 at level 1 dominated at the beginning of the teaching experiment but five of the seven 66
pupils moved upwards. 003, 008 and 011 moved quite significantly into level 2. The use of context that is physical objects and diagrams, verbal expressions and the block graph were understood and used more by almost all the pupils through out the experiment. All the pupils were also able to read and represent values in a table from the beginning of the experiment. However in the early stages of the experiment, given an open problem to solve, they did not immediately use the tabular representation to help them formulate solutions. After being directed and shown how to use the table to both represent the situation and solve problems pupils began to use them. Representation using symbolical expressions became evident in pupils 003’s and 011’s work towards the end of the teaching experiment. The two students used these representations with confidence and understanding.
TABLE 4.6: The development of the aspect strategy (symbol S) for each of the seven pupils at different stages in the teaching experiment. PUPIL Context (Task item) Aspect strategy 003 008 011 017 021 022 023
TEST 1 P WP q.8 q.14
FM q.5
SI SI SI SI SI SI SI
S2 S1 S2 S1 S1 S1 S2-
S2S2S2S1+ S2 S1 S1+
LEARNING PHASE P WP FM T5 – T8 T7C Act. 4, q1-2 (iii), 5 7D- q2
TESTS 2, 3, 4 P WP T1 q1- T1 q53 6 T3 q3
FM T1 q1-4, T2
Development progress
S2 S1 S2 S1+ S1 S2S2-
S2 S2S2 S2S1 S2S2-
S2 S2S2 S1 S2 S1 S2-
2-, 2, 1+, 1+, 2-, 2, 1, 1, 1+, 1+, 1, 1+, 1+, 2-,
S2 S2S2 S1 S2abs. S2-
S2S2S2 S1 abs. S1 S2
S2 S2S2 S2S1 S1 S2-
SUMMARY
67
2 22 1+ 1+ 1+ 2-
FIG. 4.8 The development of the aspect strategy (symbol S) for each of the seven pupils at different stages in the experiment. DEVELOPMENT OF ASPECT STRATEGY 6
5
LEVEL
4
3
2
1
0 003
008
011
017
021
022
023
PUPIL TEST 1
LEARNING PHASE
TEST 2, 3, 4
The strategies that dominated in the pupils’ work in Test 1 were at level 1, use of context, ratio and the recursive approach. In Test 1 there is no evidence of pupils using several strategies to solve one problem; at least this is not seen in their written work. They worked either directly with the context or used the ratio or recursive approach in their written answers. The ratio was usually based on one example and seemed to have been influenced by existing knowledge in simple proportion. Pupil 011’s response to q8 was “25 cans equals to 5 rows. So we say 5 into 100 equal to 20. So 25 x 20 =500” This implies the pupil assumed proportionality between the variables, row number and number of cans, without checking the assumption by, for example, counting the cans in the diagram. The pupil’s understanding of simple proportion as a concept could have been limited hence the wrong application. These strategies continued to be used through out the experiment but pupils developed new strategies in particular the use of several strategies. The results show this development into level 2 was quite evident in Test 2, 3 and 4. Figs. 4.9, 4.10 and 4.11 show examples of pupils using several strategies in one solution in both the learning phase and at the end of the experiment in Tests 2, 3 and 4. In
68
Figs. 4.9 and 4.10 the pupils used the context and probably counted the number of people that can sit at the 12 tables. Pupil 011 seems to have derived the generalised approach from this context approach. The context provides a visual representation of the formula which is then expressed verbally. The influence of the problem-centred approach is also evident in these responses. Pupils were encouraged in the discussions to acknowledge all ideas, particularly different ways of finding solutions (see APPENDIX II: Task 5Activity 1B).
4.2.2.2
Language development
The audio taped group and class discussions provide information on the language use by the pupils. Episode 4.1 and 4.2 provide information on the language use by some of the pupils. The context in which they were working influenced the language that the pupils used to communicate their ideas and solutions. The following are extracts from some of the discussions which reveal the language the pupils were using.
EPISODE 4.1 Part of a class discussion on Task 7B q2 (ii) (see APPENDIX III) Tr: What is input here? What does the word input represent, what is input 008? (No response) 008 what is input? Somebody comes here and says what are you calling input? How would you answer the question? 008: (Hesitates) Tr: You were answering this question and you were told these are inputs what does that mean to you? (Pause No reply from 008) 023: I think the inputs are numbers that will get into outputs which are on your left which get into the outputs. Tr: (interrupts) So inputs they must go into the outputs. 023: Or they must be multiplied or divided into the outputs. Tr: So what happened to the first question here refers to other parts in Task 7 3 (i) 023: (Referring to one of the questions) This was added to an operator. Tr: Is it an input. 023: This one is an input, this one is an operator so for this situation there must be an input to have 30. Tr: So what is your input here is it still meaning the same as dividing into? 023: Yes it’s a number which is added or multiplied or subtracted or divided into the operator to get an output. Tr: Into the operator 023: Yes Tr: (Turns to the other pupils) You have got something to say. 003: I wanted to say an input is a number which is divided, multiplied, added or subtracted to get an answer. 023: (Objects to “answer) Ah what answer
69
Tr: What’s wrong with the word answer? 023: It’s wrong because we are using input and output here. 011: (joins in) So if you say answer ah ---- it’s meaningless. 003: If there is someone who does not know that there is something which is called input or output so we say we get an answer. 023: So how would you represent these numbers at, by your left, when you ay these to your right are is an answer? These are called inputs (011 reiterates) then you represent them with another word? 011: (Laughs) 023 you have cancelled the output. Tr: You are saying the two words must always go together. 023: They must match. Tr: They must match 023 & 011: Yes Tr: So “answer” is wrong. 023: (011 in the background) “Answer” is wrong. 003: So what is the word which will represent input when you want to use “answer”?
In the group discussion it is quite evident that pupils had different meanings for the same words. Input and output are everyday words which convey the same meaning in the language of functions. Pupil 023 and 011 took the meaning literally and could not accept other words to replace the words input and output unless they were opposites. Pupil 003 has a more and flexible understanding of the use of these words in the context of functions and is prepared to replace them with other words. The words have a special meaning for her in the context of functions and that shows she is at level 2.
EPISODE 4.2: Part of the whole group discussion on Task 8 This episode should not be treated as a continuous discussion; some parts have been left out but the order of the discussion did not change. The Cloakroom and Phone shop Problems (see Task 8 APPENDIX II) 003 003(laughs) it depends how long you are going and the time you will spend there. (Laughs, she has made an observation that the 2nd c1oakroom is cheaper) It depends on how many hours you spending away. (008 mumbles something like a disagreement). If you are spending 2 hours, 3 hours or less you go to the 1st cloakroom but if you are spending 6 hours or more you go to the 2nd cloakroom. I think it’s possible to draw a table to find when they will pay the same. 003 I think the input is the hours because the hours change from one person to the other. If you put the hours in the operator it won’t because they are changing. So for the input they are the hours, the operator the money being paid for an hour.
The Tuck-shop Problem
70
I will say “x” is equal to the number of students who buy at the tuck-shop and I say ⅔ x which is ⅔* the number of packets of Maputi bought at a day. 008 So what is your answer, I want the answer? 003 ⅔ x 003 Students who buy at the tuck-shop. We don’t know the number of people who buy at the tuck-shop because today I will buy a packet of Maputi, tomorrow I will buy a freeze-it, the next day I will not buy anything at the tuck-shop. So the number varies it depends on how many people bought at the tuck-shop on that day. Tr. So you said the number does what? 003 It varies 023 But the question says “A survey carried out on the sales of your school tuck-shop, tuck-shop, revealed that 2 out of 3 students who buy in --- maputi” It is already said 2 out of 3. Can’t I say 2 out of 6, 7 out of 9. 003 We never said the fraction varies but the number of people who buy at the tuck-shop. 023 Yes they are always ⅔ 003 ⅔ of people who buy maputi. But the number of people who are ⅔ of that number varies. We don’t know the number so how many people buy?
008 To get the output I will multiply the price, the charges for 1 hour then I will multiply the charges by the hours, which I will have spent. What was your answer? Let’s say you don’t know the number of pupils at St Dominics and you’re said to calculate the amount or the packets of Maputi will buy. How do you calculate them if you don’t know the students? Because here it’s also said ⅔ of the students but we don’t know the amount of people who are learning at the number of people who are learning at St Dominic’s
Pupil 003 reflected functional thinking and was able to identify the constituent elements of a function in the problem very clearly. She was able to say what was changing and the relationships between these changes. Her language expressed functional reasoning. She did not only see the table as a way of recording data but a method of solving the problem as well. She showed the ability to use and connect the verbal situation, the table and the symbolic expression. The group work helped her to share and clarify her ideas with the others who also adopt the expressions. There was evidence of negotiating meaning and reaching a consensus among the students. For example as they discuss 023 and 008 who do not see variables in the problem but unknowns that should be provided if the problem is to be solved benefit from 003’s explanations. They did not accept her answers but sought clarification and tried to make sense of what 003 was explaining.
71
EPISODE 4.3: Continuation of part of the whole group discussion on Task 8 011
Ah the 2nd one is cheaper because 6 hr x 400 you get 2 400 and then plus 1 000, 3 400. But then this one if you say 6 x 600 you will get 3 600. You can go anywhere because if you say for 1 hour, for 1 hour you will get 600 for the 1st cloakroom and for 1 hour you get, for the 2nd you get 1 400. But this is only 600. But for 6 hours this one will become cheaper than this one (1st) (laughs) We cannot choose the cloakroom which is cheaper because it depends on how many hours are you going to leave your luggage, luggage. Our input will be the money, the money paid and our operator will be the amount, our operator will be the hours you spend and the output will be the money you have been charged.
021 The first one is saying for an hour it is 600 and the second one is saying for an hour it is 400 plus an additional of $1 000 so that is why we are saying the first one is cheaper. But how come when we are having 6 hours the amount of money, the 1st one will have a lot of more than the 2nd one but at the first we were having more on the 2nd than on the 1st one. I am saying that for an hour the 1st one, the 1st cloakroom you pay $600 only and the 2nd cloakroom you pay 1400. How will it that in the 1st one for 6 hours you pay 3 600 and for the 2nd cloakroom you pay 3 400? I am saying the 1st cloakroom charges 600/hr and here for the 2nd cloakroom he charges 400/hr plus an additional 1 000 for insurance. Then if you put your luggage there, if they keep for you for 6 hours then the 1st cloakroom will charge you 3 600 and the 2nd 3 400 how came the 1st cloakroom charge more but at the 1st it had less.
023
I wanted to say what they said because for the 1st, the 2nd one you are saying, for 1 hour you pay 1 400 and in the 1st one you pay 600. So it increases with the hours gone. Hold on, I have understood the question on the 1st one it is increasing when you multiply the insurance is already added with the payment for 1 hour and here we can just add only 100 after every hour you have left your things, your luggage.
The pupils continued to develop a language that would be formalized into conventional functional terms. Pupil 021 raised a very important question which reflected how he was relating to the problem and created an opportunity to study the idea of rate of change. He was struggling to understand how the tuck-shop charging only $600 in the first hour becomes more expensive than the one that was charging $1400 also in the first hour. The opportunity to introduce other methods like the table or a graph was created. A revisit of Test 1 q2 and 3 was done at the end of the experiment to assess the language development of the pupils in word problems. The following is an extract Test 1:
72
Instructions: Read the following carefully before you answer the questions.
Answer all the questions. Explain clearly all your answers. Use whatever you think will help to explain e.g. words, numbers, diagrams, tables, graphs, symbols such as letters, etc. 2.
Suppose I agree to pay you Z$200 for every hour you work. Give a method that we could use to calculate your pay after you finish the work.
3.
John works part-time during the school holidays selling newspapers. He receives Z$2000 as his salary per week, plus Z$100 for each newspaper he sells. How much can he earn in a week?
TABLE 4.7: Language development in word problems PUPIL TEST 1 q2 and q3(Beginning of experiment) 003 2. After my work I will calculate the number of hours I worked and multiply by $200.
008
011
017 021 022 023
3. In a week he will receive Z$2000 + Z$100 x the number of newspaper he would have sold. 1. The money you get times the number of hours worked. 2. John can earn Z$200 x Z$100 + newspaper he had sold. 2. The way is to say Z$200 multiply by the number of hours you have worked. 3. He can earn $2000 x 7 and we will get $14000, then we will say plus $100 per newspaper. 2. You say Z$200 x the hours your work. 3. John salary per week Z$2000 + Z$100 = Z$2100. 2. You multiply the number of hours I have worked by Z$200 and you will get the amount. 3. John earns Z$2100 or more. 2. Multiply the number of hours worked. 3. Money he earn = Z$2100 2. Multiply the number of hours I work by Z$200 so to get the payment. 3. John earns Z$2000 by the end of the week and the amount of money cost by the news papers he sell.
Test 1 q2 and q3 (End of experiment) They are varying because the hrs change so I say the hrs depends on the payment. They are variable quantities. I say the hrs depends on the payment because as the hrs change the payment change The payment depends on hours worked. The payment is varying on hours worked because the hours changed. Money paid for an hour (in the table this refers to money paid for worked hours) is a variable and the time (hours worked).
The number is unknown not a variable The first have a basic payment of 1000 that is pay in each case you make a call and it does not have a base payment. The payment depends on the hour. 2. No. of hours x Z$200. On the second they is no basic charge and 1 has a basic charge of 1000. The money depends on time. The time is varying and money varies as time varies. Money depends on time because if no time the payment will remain $200.
73
Most pupils show that they were using the words depend and variable with the intended meaning in the language of functions. 017 still understood variables as unknowns and 021 was difficult to place from his response.
4.2.2.3
Sample of pupils responses on selected tasks
The following excerpts of pupils’ responses will provide first hand insight into the pupils’ levels of development of the function concept. The aspects are embodied in the task and it gives the reader an opportunity to make an independent assessment of the levels. The excerpts bring closer what is going on in the mind of the pupil and different interpretations can be derived from them. The excerpts included here are from the learning phase and the end of the experiment phase. They are a selection from the pupils’ work. They may not necessarily cover all the levels but will provide information on where the analysed data is coming from...
LEARNING PHASE PATTERNS: Task 5 – Activity 5
Problem: How many students can sit around a table of varying lengths? Find a formula or rule that can be used to find the number of people that can sit around a table formed by a sequence of unit-tables joined together as shown in the diagrams below:
74
FIG. 4.9 Pupil 011’s solution on Task 5–Activity 5
In this excerpt pupil 011 shows thinking at level 1 in the diagram which is summarized at level 2. This example explains how a pupil who may be operating at level 2 may be judged to be at level 1 because of what he or she presents on paper. If 011 had provided the answer up to the statement 12 tables = 26, he would have been classified at level 1. The diagram may not be understood as presenting a general solution as much as the verbal expression does. O23 provides a third representation. 011 may not have seen this as necessary since he had already obtained a solution. The variety of strategies used by the pupils were usually shared and discussed (see APPENDIX III, Task 5-Activity 1B).
75
FIG. 4.10 - Pupil 023’s solution on Task 5–Activity 5
In Fig. 4.10, pupil 023 works with the context and the ratio method. The solution he obtained from the ratio approach was different from the one he got using the context. He was able to revisit his ratio approach and discovered his error and corrected it as indicated in his responses. The verbal formula is also represented numerically using a table. The question was open and pupils were now using various strategies. Both verbal
76
solutions are at level 2. The solutions show that both pupils were now able to identify change at level 2. Pupil 023’s solution identified what varied or what was unknown. He still needed to find a method of calculating the number of people who would lose seats from joining any number of tables in order to have a general solution. In the next example we see a pupil who was now beginning to move out of level one. FIG. 4.11 Pupil 017’s solution on Task 5–Activity 5
In Fig. 4.1 Pupil 017 used the ratio method but abandons it perhaps after realising that the solutions, except for (1; 4) were different for the rest of the values in the table. The table may have been constructed from the diagram given in the question. However pupil 017 seems to have limited ways of approaching the problem and might not have been able to find the formula from the table alone. But this indicates growth upwards in level 1. He rejected a method that did not apply universally to other values in the table. A function is a relationship between variable quantities. PATTERNS: Task 5-Activity 4 (see APPENDIX II for the complete task) Task 5 - Activity 4A q4 Can you draw a graph of the perimeters made from the pattern-block strings? If you can, draw one.
77
Task 5-Activity 4B q4 Draw a graph to illustrate your answer to Question 2 (Question 2: How does the perimeter of a square change as we increase the length of a side).
FIG. 4.12 Pupil 011’s solution on Task 5-Activity 4
78
Fig. 4.12 is an example of a pupil who was beginning to move from A-level 1 representation in graphs to level 2. The pupil used a block graph to represent the perimeter of a string of N pattern blocks of hexagons. Below the block graph the pupil drew the graph to illustrate his response to Activity 4B q4. The pupil drew a graph on the Cartesian plane. In both cases the axes are reversed. The joining of the point in the second graph could be an indication that the pupil realized that the length of the side is a continuous variable.
END OF EXPERIMENT The following are examples of the pupils’ responses in the context of word problems extracted from the pupils’ solutions to the Test 2 q5 at the end of the experiment. WORD PROBLEMS: Test 2 q5 FIG. 4.13 Pupil 003’s solution on Test 2 q5
Pupil 003 approached the problem from many angles. She gave a verbal solution of the method and below it draws a table and uses it to explain her verbal solution. She also used the difference strategy to derive the rule as indicated in Fig. 4.13 above.
79
The next examples are pupils’ solutions using the function machine context from Test 3 at the end of the teaching experiment.
FUNCTION MACHINE AND FLOW DIAGRAMS TEST 3 FIG. 4.14 Pupil 021’s solution to Test 3 In Fig. 4.14: pupil 021 connects three different representations of the function machine problem in Task 3. He is given a function machine and expresses it in words, as a flow diagram and as a Cartesian graph all attributes of level 2. He also indicates in the solution
80
the ability to use symbolic rules and successfully finds the inverse function in part (ii) of the problem.
4.2.3 CONCLUSION In Chapter Two the development of the function concept was described as taking place in two directions, horizontally and vertically. The horizontal growth involves the acquisition of the various aspects or sub-concepts of a function namely: change, relationship, rule, and representation as a way of expressing these aspects. The development and eventual integration or unification of these aspects into a function is a vertical growth process. The results presented here come from data analysed using an instrument developed from the literature on the historical development of functions, its various conceptions as well as adapted levels of development. For the purpose of this research “development” has been defined as the “process of acquiring the concept”. This implies making incremental gains in understanding the concept. Ideally in this study this should be shown by knowledge of the aspects and the change in the pupils’ understanding of these aspects as indicated in the levels of development. This required identification of the aspects they knew initially and to what level of understanding then compare this with the knowledge reached at the end of the experiment. The results show development by each pupil beyond and/or within the initial level in most of the aspects. There are two situations of a drop in the initial level, 008 in the aspect change and 021 in the aspect change and representation. Pupil 021 was absent in some of the lessons and some of 008’s responses resembled 003’s suggesting copying or over dependency on the latter. Although 021 appears to have dropped in his level of operation in the aspect representation at the last stage of the experiment his work on Test 2 (see Fig. 4.4) show that he is at level 2. This means developing to level 2 does not necessarily mean the pupil can handle all the problems set at that level. The second factor is that development of the representations themselves is at different levels. Cartesian graphs are a higher level of representation than the table. Assessing them both at level 2
81
may not be a correct assessment of the level in the development of the aspect representation. The difference in the tasks used in the assessment of the level of understanding of the aspects at each stage of development could have also been a factor that influenced the pupil’s performance. Different tasks were used to test the levels at the various stages of the experiment. The use of different tasks was intended to give pupils a wide variety of experiences in sources of functions and the assessment took this into account. However determining the extent of development would have been easier and more meaningful if the same tasks had been used for each context at each stage in the experiment to assess the development of the aspects. The development of language in the learning of functions was also evident in most pupils. The group discussions and awareness of what they were learning helped in the adoption of function terms. At first they had everyday meanings attached to them but later these were understood in the context in which they were being used. This is evident in Episode 4.1 in which pupils 023 and 003 express different understanding of the words input and output.
82
CHAPTER FIVE FINDINGS, SUMMARY AND RECOMMENDATIONS
5.1
SUMMARY AND FINDINGS
The focus of this study was to investigate the possibility of teaching functions at Form 1 level in Zimbabwe as recommended by the NCTM (2000), South Africa’s DoE (2002) and the Zimbabwe Nziramasanga Report (1999). The study was motivated by the belief that functions are pivotal in the development of mathematics and other school subjects and therefore should be introduced in a meaningful way as early as Form 1. Its early introduction at secondary school would facilitate the learning of other concepts particularly in algebra. The investigation involved introducing a group of Form 1 pupils in an urban co-educational secondary school and assessing the extent to which they developed the concept. This involved assessing the pupil’s exististing knowledge of functions and building on that knowledge. According to literature reviewed in the study, the constituent elements of functions are change, relationship and rule (Sierpinska 1992) and these must be the focus in developing the concept. Other elements critical to the development are representation, language and strategies (Van de Walle 2004) and these should also be introduce not in isolation but in an integrated approach. The problem-centred approach was used in the teaching experiment to stimulate and support students’ individual and social construction of meaning (Olivier 1993).The approach to functions in the current Zimbabwe mathematics secondary school curriculum is to first introduce the concept at Form 3 level in the traditional way which is formal and abstract. The Nziramasanga Report (1999) recommended the use of problem-solving as one of the methods that can be used to teach mathematics at all levels in order to improve the current state of mathematics education in Zimbabwe. In the literature study (Chapter 2) the definition of a mathematical function, its development and ways of approaching 83
the concept in the school curriculum recommend the use of meaningful contexts to teach functions. A variety of tasks were developed to address this need. An instrument was developed from the literature review and used to assess the individual pupils’ extent of development of the aspects identified as the constituent elements of the function concept. Five of these, change, relationships, rule, representation and strategies were analysed for each of the seven pupils in the study. The instrument measured qualitative more than the quantitative attributes of the aspects of function that were being developed in the study. The instrument assumed two levels at Form 1 level, that is, the entry level 1 and the level the pupils were expected to achieve. Kalchman’s (2001) instrument provided most of the ideas that were used to develop the assessment instrument for this study. In the actual analysis of data the instrument constructed in Chapter 3 continued to be modified to accommodate in between levels that were emerging. The findings seem to indicate that it is possible to introduce functions at Form 1 level and pupils can be moved upwards within or beyond their initial levels of understanding of the aspects of the function concept. However the use of a larger and more representative sample was necessary to confirm this. The most significant growth was what has been described in Chapter 2 as the horizontal growth, which involves the acquisition of the aspects of function. The pupils began to look for relationships, describe rules, use more than one representation and employ strategies that reflected functional reasoning. This is demonstrated in some of the pupil’s written work and episodes from the audio taped discussions.
The vertical growth, which refers to the acquisition of a better and more
complex understanding of each aspect and integrating these into a notion of function was evident but perhaps less significant in terms of moving pupils from level 1into level 2 as suggested by the assessment instrument in Chapter 3. The tables and figs in Chapter 4 provide a picture of this vertical growth. The growth in the understanding of change, in particular the ability to distinguish between variables, constants and the unknown, was not really expected according to the assessment instrument. However pupils like 003 and 011 displayed a meaningful understanding of these critical concepts in the development of the function concept. There were some peculiar patterns in the vertical growth where there was a downward trend in the development rather than an upward movement. The
84
consistence of the instrument in measuring the same thing at all the three stages was compromised by the different tasks that were used. The questioning, justifying and seeking for clarification that was evident in most of discussions, for example in the case of 011 (see Episodes 4.1 and 4.2 in Chapter 4) and the variety of strategies some of the pupils were using by the end of the experiment show the effects of the problem-centred approach in a socio-constructivist learning environment. Pupils began to negotiate meaning and respected each other’s solutions which were not the case at the beginning of the experiment. Then pupils asked for examples, hide their answers or tried to copy from others if they could not solve the problem. There were some limitations in carrying out this study which influenced the results. The paper and pencil tasks failed to provide enough experience for pupils to see change between variables in a more dynamic way. A teaching experiment required clinical interviews to probe further and deeper into each of the seven pupils’ thinking. This was not adequately done due to constraints of time. The pilot study did not adequately test the instruments. Both the learning tasks and the assessment tasks require further refinement.
5.2
RECOMMENDATIONS
5.2.1 Teaching The results from this study indicate the possibility of introducing functions at Form 1 in line with current trends in the teaching of algebra that recommend introducing functions early as a unifying theme. However a study at a larger scale, using a more representative sample, is necessary to determine whether the findings reported here would be replicated. An important consideration for teacher education is to ensure that the implementers of the curriculum are provided with the necessary knowledge to teach the concept. The problem-centred approach is difficult to implement if prospective teachers do not experience it during their own learning. It is recommended not only in the teaching of 85
functions but can be used in the introductory stages of most topics. The interconnectedness of mathematical ideas is an important recommendation in reform curricula and teaching functions at school and in teacher education can provide an opportunity for this to happen. The problem-centred approach enabled pupils to experience problem solving and making connections within mathematics.
5.2.2 Further research A lot of questions emerge from carrying out this study which are worth investigating. The following are suggestions of further research that can be done: •
While a number of approaches were used, patterns, word problems and function machines further research can be pursued in teaching functions through modeling as recommended in the literature reviewed in Chapter 2. Functions are a common phenomenon in real life situations and real problems help to motivate the learning of functions.
•
The instrument for assessing functions has not received enough attention for the curriculum suggested here or in the recommended reform curricula like NCTM (2002).
•
The development of language was not adequately investigated in this study and can be an area of further study. Is it possible to develop a programme that can help students in their learning as well as acquiring the specific language of functions as early as Form 1?
•
In this study the problem- centred approach was applied on the recommendation of literature reviewed. In Zimbabwe, the ideas of teaching mathematics in order to promote reasoning, problem solving and making connections can be areas of further investigation by the teaching of functions through a problem-centred approach. These ideas are currently not explicitly addressed in the Zimbabwe secondary school mathematics curriculum. The results of this study suggest paying more attention to these ways of thinking because they facilitate meaningful learning.
86
5.3
CONCLUSION
The results can be used to develop this study further in terms of refining it or pursuing specific areas as indicated in section 5.2.2. The study provided the researcher/teacher with a learning experience and a better understanding of functions.
87
REFERENCES Anderson, J. 1978. The mathematics curriculum: algebra. London: Blackie Bednarz, N; Kieran, C & Lee, L (Eds.) 1996. Approaches to algebra: perspectives for research and teaching. Dordrecht: Kluwer Academic Press. Bell, A. 1995. Purpose in school algebra. Journal of Mathematical Behavior 14: pp 41-73. Borba, MC & Confrey, J. 1996. A Student’s construction of transformations of functions in a multiple representational environment. Educational Studies in Mathematics 31: pp 319-337. Cangelosi, JS. 1996. Teaching mathematics in secondary and middle school: an interactive approach. (2nd edition). New Jersey: Prentice-Hall. Channon, JB; McLeish Smith, A; Head, HC & Macrae, MF. 1991. New General Mathematics (New Edition). U.K. Longman Group Ltd. Confrey, J & Smith E. 1995. Splitting, covariation, and their role in the development of exponential functions. Journal for Research in Mathematics Education, Vol. 26. No. 1: pp 66-86. Confrey, J. 1994. Splitting, similarity, and rate of change: a new approach to multiplication and exponential functions. “In” Harel, G. & Confrey, J. (eds.).The development of multiplicative reasoning in the learning of mathematics. State University of New York Press. Confrey, J. & Smith, E. 1991. A framework for Functions: prototypes, Multiple Representations, and Transformations. From: Proceedings of the Thirteen Annual Meeting of PME-NA October 16-17, 1991. Blacksburg. VA.
88
Confrey, J. & Smith, E. 1994. Exponential functions, rates of change and the multiplicative unit. Educational Studies in Mathematics, 26. Kluwer Academic Publishers, Netherlands: pp 135-164. Cooney, TJ; Brown, SI; Dossey, JA; Schrage, G & Wittmann, EC. 1996. Mathematics, pedagogy, and secondary teacher education. Portsmouth, NH: Heinemann. Coulombe, WN. & Berenson, SB. 2001. Representations of patterns and functions: tools for learning. “In” Cuoco, A. (ed.). The roles of representation in school mathematics, NCTM’’s Yearbook: pp 166-172. Davidson, PM. 1987. Early function concepts: Their development and relation to certain mathematical and logical abilities. Child Development, 58: pp 1542-1555. Davindeko, S. 1997. Building the concept of function from students’ everyday activities. The Mathematics Teacher, Vol. 90, No. 2, Feb97: pp 144-149. DeMarois, P & Tall, D. 1996. Facets and layers of the process conception of function. Proceedings of PME, (1996), vol. 2: pp 297-304. Dossey, JA; Giordano, FR; McCrone, S & Weir, MD. 2002. Mathematics methods and modelling for today's mathematics classroom: a contemporary approach to teaching Grades 7-12. Canada: Brooks/Cole. Dubinsky, E. & Harel, G. 1992. The nature of the process conception of function. “In” G. Harel and E. Dubinsky (eds.). The concept of function: aspects of epistemology and pedagogy (1-16). West LaFayette. IN: Mathematical Association of America: pp 85-106. Freudenthal, H. 1973. Mathematics as an educational task. Dordrecht-Holland: D.Reidel Publishing Company.
89
General Certificate of Education O level Syllabuses for Candidates in Zimbabwe: Mathematics (4008, 4028). SS9 (ZIMB), 1991. Gravemeijer, K. 1998. Developmental research as a research method. “In” Sierpinska, A & Kilpatrick, J (eds.) Mathematics education as a research domain: a search for identity . An ICMI Study Book 2. Dordretch: Kluwer Academic Publishers: pp 277-295. Gravemeijer, K; van den Heuvel, M & Streefland. 1990. Contexts free productions tests and geometry in Realistic Mathematics Education. OW & OC, Utretch, The Netherlands. Haimes, DH. 1996. The implementation of a "Function" approach to introductory algebra: a case study of teacher actions, and the intended curriculum. Journal for Research in Mathematics Education, Vol. 72, No. 5: pp 582-602. Heid, M.1996. A Technology – Intensive functional approach to the emergence of algebraic thinking. “In” Bednarz, N. Kieran, C.& Lee, L 1996. Approaches to Algebra: Perspectives for Research and Teaching. The Netherlands: Kulwer Academic Publishers. Hiebert, J; Carpenter, TP; Fennema, E; Fuson, KC; Wearne, D; Murray, H; Olivier, A & Human, P. 1996. Making Sense: teaching and learning mathematics with understanding. Portsmouth, NH: Heinemann. Human P, Olivier A, le Roux, A, Bennie, K, Sasman, MC, Liebenberg, R & Sethole, GI. (2000). Mathematics at Work, Grade 8, Learner's Book. Cape Town: NASOU LIMITED.
90
Human P, Olivier A, Murray H & Du Toit D. 1993. Mathematics at work, Standard 2: a problem-centred approach. Cape Town: NASOU LIMITED. Kalchman, M & Case, R. 2000. Modeling the development of the concept of function. “In” Fernandez, M. (ed.). Proceedings of the Twenty-Second Annual Meeting of the North American Chapter of the International Group for the Psychology of Mathematics Education Columbus, OH: ERIC Clearinghouse for Science, Mathematics, and Environmental Education: pp 241-246. Kalchman, M & Fuson, KR. 2000. Conceptual understanding of functions: A tale of two schemas. Fernandez, M. (ed.). Proceedings of the Twenty-Second Annual Meeting of the North American Chapter of the International Group for the Psychology of Mathematics Education (194-205). Columbus, OH: ERIC Clearinghouse for Science, Mathematics, and Environmental Education. Kalchman, M. 2001. Using a neo-piagetian framework for learning and teaching mathematical functions. University of Toronto. Kerslake, D. 1981. Graphs. “In” Hart, KM (ed). Children understanding mathematics: 1116. London: John Murray: pp 120-136. Kieran, C & Chalouh, L. 1999. Pre-algebra: The transition from arithmetic to algebra. “In” Moss, B (ed) Algebra thinking, Grades K-12. NCTM’s School-based Journal, Reston, Virginia: pp 59-70. Kieran, C. 1990. Cognitive processes involved in learning school algebra. “In” Nesher, P & Kilpatrick, J. (ed.). Mathematics and cognition: A research synthesis by the International Group for the Psychology of Mathematics Education. Cambridge: Cambridge University Press: pp 96-112.
91
Kieran, C; Boileau, A & Garacon, M. 1996. Introducing algebra by means of a technology-supported, functional approach. “In” Bednarz, N, Kieran, C & Lee, L (eds.). Approaches to algebra: perspectives for research and teaching. Dordrecht: Kluwer: pp 257-294. Kleiner I. 1989. Evolution of the function concept: A brief survey. The College Mathematics Journal, Vol. 20, No. 4: pp 282-300. (Internet Source). Kuchemann, D. 1981. Algebra. “In” Hart, KM (ed). Children understanding mathematics: 11-16. London: John Murray: pp 102-109. Kwari, R., Mtetwa, D.K.J., Chipangura, A.T., & Makamure, R. (2002). Active learning approaches in Zimbabwean science and mathematics classrooms. “In” The Proceedings of the 11th Annual Conference of the Southern African Association for Research in Science, Mathematics and Technology Education (SAARMSTE). University of Swaziland, Jan 11-15. Land, J. (1990). Appropriateness of the Van Hiele model for describing students' cognitive processes on algebra tasks as typified by college students' learning. UMI Dissertation Services. Michigan. Laridon, P (co-ordinating author); Brown, M; Jawureki, A; Mbatha, L; Mbatha, P; Scheiber, J; Sigabi, M; Van Noorte, D & Wilson, H. 1998. Classroom Mathematics: Outcome Based, Grade 7: Learner's book. Heinemann Publishers (Pty) Ltd. Linchevski, L. 1995. Algebra with numbers and arithmetic with letters: A definition of pre-algebra. Journal of Mathematical Behavior 14: pp 113-120.
92
Lodholz, RD. 1999. Pre-algebra: The transition from arithmetic to algebra. “In” Moss, B (ed) Algebra thinking, Grades K-12. NCTM’s School-based Journal, Reston, Virginia: pp 52-58. Mason, J; Graham, A & Johnston-Wilder, S. 2005. Developing thinking in algebra. London: Paul Chapman Publishing. McComas, KK. 2000. Felix Klein and the NCTM’s Standards: A mathematician considers mathematics education. The Mathematics Teacher, Vol. 93, No. 7. October 2000: pp 714-717. Mesa, V. 2004. Characterising practices associated with functions in the middle school textbooks: An Emperical Approach. Educational Studies in Mathematics 56: pp 255-286. Netherlands: Kluwer Academic Publishers. Murray, H; Oliver, AI & Human, PG. 2000. Learning through problem solving. Malati Project, IWWOUS. “In” Wessels, DCJ (2000), Reader for MEDMA UNISA: Pretoria, pp 30-38 National Council Teachers of Mathematics. 2000. Principles and Standards for Schools. Reston, VA. http://standards.nctm.org/ Noss, R; Healy, L & Hoyles, C. 1999. The construction of mathematical meanings: connecting the visual with the symbolic. Educational Studies in Mathematics, Vol 33, No.2: pp 203 – 233. Nziramasanga, CT. (chairman). August 1999. Report of the Presidential Commission of Inquiry into Education and Training: Harare, Zimbabwe: pp 323-348
93
Olivier, A. 1993. Blaming the victim in Curriculum reconstruction for society in transition. Political and Dimensions of Mathematics Education 2 (PDME). Maskew Miller Longman Pimm, D. 1987. Speaking mathematically: communication in mathematics classrooms. London and NewYork: Routledge and Kegan Paul. Ponte, JP. 1992. The history of the concept of function and some educational implications. The Mathematics Educator, Vol. 3. No. 2: pp 3-7. Schultz, JE & Waters, MS. 2000. Why representations? The Mathematics Teacher, Vol. 93, No. 6: pp 448-452 Schwartz, J & Yerushalmy, M, 1992. Getting students to function in and with algebra. . “In” Harel, G and Dubinsky, E. (eds.). The concept of function: aspects of epistemology and pedagogy. West LaFayette. IN: Mathematical Association of America: pp 261-289. Schwingendorf, K; Hawks, J & Beineke, J. 1992. Horizontal and vertical growth of the students’ conception of functions. “In” Harel, G.and Dubinsky, E. (eds.). The concept of function: aspects of epistemology and pedagogy. West LaFayette. IN: Mathematical Association of America: pp 59-84 Serra, M. 1997. (2nd Edition). Discovering geometry: an inductive approach. Key Curriculum Press, San Francisco. Sfard, A. 1992. Operational origins of mathematical objects and the quandary of reification: the case of function. “In” G. Harel and E. Dubinsky (eds.). The concept of function: aspects of epistemology and pedagogy. West LaFayette. IN: Mathematical Association of America: pp 59-84
94
Sfard, A.1991. On the dual nature of mathematical conceptions: reflections on processes and objects as different sides of the same coin. Educational Studies in Mathematics, 22: pp 1-36. Sheehy, L. 1996. The history of the Function Concept in the intended of the High School curriculum over the past century: What has changed and what has remained the same in the roles that functions are to play. Jurikon.coe.uga/olive/EMA T3500/History of Fns.doc (Internet Source) Shuard, H. & Neill, H. 1977. The mathematics curriculum: From graphs to calculus. London: Blackie. Sierpinska, A. (1992). On understanding the notion of function. “In” Harel, G and Dubinsky, E (eds.). The concept of function: aspects of epistemology and pedagogy. West LaFayette. IN: Mathematical Association of America: pp 25-58 Steffe, LP & Thompson, PW & Von Glasersfeld. 2000. Teaching experiment methodology: underlying principles and essential elements. “In” Kelly A E & Lesh RA (Eds). Handbook of research design in Mathematics and Science Education. Mahwah, New Jersey, London: Lawrence Erlbaum Associates, Publishers: pp 267-306. Tall, D. 1992. The transition to advanced mathematical thinking: Functions, limits, infinity and proof. “In” D.A.Grouws (ed.) Handbook of research on mathematics and meaning: A project of the National Council of Teachers of Mathematics (495511). New York: Macmillan Tall, D; McGowen, M & DeMarois, P. 2000. The Function machine as a cognitive root for the function concept. “In” Fernandez, M.L (Ed.). Proceedings of the TwentySecond Annual Meeting of the International Group of the Psychology of mathematics education: Vol. 1 (256-261). Tucson, Arizona U.S.A.
95
Thomas, H. 1975. The concept of function. “In” Rosskopf, M (ed). Children mathematical concepts: six Piagetian studies in mathematical education. New York: Teachers’ College Press: pp 145-172. Thompson, DR & Rubenstein, RN. 2000. Learning mathematics vocabulary: potential pitfalls and instructional strategies. The Mathematics Teacher, Vol. 93, No. 7. Oct. 2000: pp 568-574. Van Ameron BA, 2003. From arithmetic to algebra. Educational Studies in Mathematics, 54: pp 63-75. Van de Walle, JA, 2004. Elementary and middle school mathematics: Teaching developmentally (5th Edition). USA: Pearson Education, Inc. Vinner, S. 1992. The function concept as a prototype for problems in mathematics learning. “In” Harel, G.and Dubinsky, E. (eds.). The concept of function: aspects of epistemology and pedagogy. West LaFayette. IN: Mathematical Association of America, pp 195-213. Willoughby, SS. 1999. functions from kindergarten through sixth grade. “In” Algebraic Thinking: Grades K-12, NCTM, Reston, VA; pp 197-201. Yerushalmy, M. & Shternberg, B. 2001. Charting a visual course to the concept function. “In” Cuoco, A. (ed), The roles of representation in school mathematics, 2001 National Council of Teachers of Mathematics Yearbook (2001), pp 251- 268. Yerushalmy, M. 2000. Problem solving strategies and mathematical resources: A longitudinal view on problem solving in a function based approach to algebra. Educational Studies in Mathematics, 43: 125-147.
96
APPENDIX 1 TEACHING PROGRAMME 1. Aim: 1.1. Form 1/ Grade 8 pupils to start developing the concept of a function. 1.2. Pupils to begin to see functional relationships in a variety of situations. 1.3. Pupils begin to represent functional relationships in more than one way, e.g. verbally, numerically, geometrically and symbolically. 2. Pre-knowledge: 2.1. Operations with positive numbers; 2.2. Proportionality; 2.3. Read tabulated information; 2.4. Work with formula e.g. to find perimeter and area of plane shapes. 3. Teaching objectives: Pupils should be able to: 3.1. Identify changes and describe them; 3.2. identify and describe linear relationships; 3.3. Generalise relationships into a rule; 3.4. Represent a relationship in more than one way, e.g. verbally, in a table, in a graph. 4. Assessment objectives: 4.1 What aspects of the function concept do the pupils develop? 4.2 To what extent do they develop these aspects (measured against identified stages of development of the function concept)? 4.3 What strategies reflecting functional reasoning do pupils use on the tasks? 4.4 What function language do they begin to use? 5. Method/Approach: Develop the function concept through the use of task based activities that involve: 1. patterns; 2. Input-output diagrams; 3. Word problems. Use a problem based / centred approach to the development of the function concept. 1. Start by engaging students in a problem or an activity individually or in small groups; 2. Follow with whole class discussions.
97
WEEK 1
ASPECTS Orientation and TEST 1 TEST 1 and identification of the experimental group Orientation of the experimental group Familiarity with patterns Define a pattern Identify patterns Describe patterns Functions from patterns- Growing patterns Identify patterns Describe the pattern Extend patterns Functions from patterns- Growing patterns Identify patterns Describe the pattern Extend patterns Predict nth term Use tables Assessment
ACTIVITIES Write the test. Select participants. Explain to participants what they were going to be doing. Copy patterns and extend. Use various schemes to read a pattern. Make same patterns using different materials • Identify patterns (geometric and numeric) and extend.
5
Input-Output relationships- Function machines, Guess My Rule Game, Flow diagrams Calculate output values Calculate input values Find operators Draw tables Draw graphs
6
Input-Output relationships Complete tables Draw graphs Assessment
7
Functions from word problems Solve word problems. Use tables as strategies to solve problems
2
3 4
• • • • •
Identify patterns (geometric and numeric) and extend. Make predictions of the nth element in the pattern. Give reasons. Verify the predictions. Represent patterns using tables. Assessment Task on Patterns
Find output numbers given input values and operator. Calculate input values given operator and output. Find operators given input and output. Represent patterns using tables. Follow up interviews on assessment task Complete tables with input/output values. Assessment Task on Input-output relationships
9
Assessment
Identify the variables in the problem. Identify the relationships between the variables. Find general solutions. Follow up interview on assessment task Lesson 1 Identify the variables in the problem. Identify the relationships between the variables. Find general solutions. Assessment Task on Word problems Tests 2, 3 and 4
10
Assessment
Follow up interviews on assessment tasks
8
Functions from word problems Solve word problems. Use tables as strategies to solve problems. Assessment
98
APPENDIX II TASKS TEST 1 You have I hour and 30 minutes to do this test. Instructions: Read the following carefully before you answer the questions. Answer all the questions. Explain clearly all your answers. Use whatever you think will help to explain e.g. words, numbers, diagrams, tables, graphs, symbols such as letters, etc. Show all your working on the answer sheet provided. 4. To make a local telephone call at Ngwaru phone shop one pays a basic charge of Z$1000 plus Z$600 per minute. a) How much does it cost to make a 7 minutes long local telephone call? b) If a local telephone call cost Z$7600 how long did it take? 5. Suppose I agree to pay you Z$200 for every hour you work. Give a method that we could use to calculate your pay after you finish the work. 6. John works part-time during the school holidays selling newspapers. He receives Z$2000 as his salary per week, plus Z$100 for each newspaper he sells. How much can he earn in a week? 7. The table below is a record of some of the sales of onions on a particular day at a Supermarket. Weight of onions (kg) Cost (Z$)
1,5 2250
3,8 5700
5 7500
6,25 9375
8,1 12150
15 22500
A customer pays $9000, what weight of onions did she buy? Explain how you get your answer. 9. Tendai decides to play a game called Guess My Rule with his classmates. Tendai asks for a number from his classmates. He uses a rule on the number and then gives a response. The results of the game are recorded in a table. Each number a classmate says is called input and each response that Tendai gives is called output. Input Output
1
2 5
3 7
4,5
5 11
6 13
1,5
30
x
(a) What is Tendai’s rule? (b) Copy and complete the table for the inputs 1; 4,5; 1,5; 30, and x. 6. Mrs. Muyambo sells mealie meal at her tuck shop in Chikanga. The graph below shows the cost (Z$) of the different amounts of mealie meal (kg) one can buy.
99
Cost (Z$) of mealie meal 12000 11000 10000 9000
Cost (Z$)
8000 7000 6000 5000 4000 3000 2000 1000 0 0
1
2
3
4
5
6
Amount of mealie meal (kg) Use the graph to answer the following questions: a) What is the cost of: i) 4kg of mealie meal ii) 5,4 kg of mealie meal. iii) 7,5 kg of mealie meal b) How much mealie meal can you buy for: i) Z$8000 ii) Z$11 000 iii) Z$17500 8. In a can-stacking competition competitors must stack the cans as shown in the picture. Chido is sure that she can win the competition if she is able to stack 100 rows of the cans. Row 1 Row 2 Row 3 Row 4 Row 5
a) How many cans would she require for the 100th row? b) Explain how you get the answer. [Source: Adapted from Human et.al 2000: 2]
100
TASK 1 [Done individually first, followed by tape recorded class discussion] Use the space provided to answer the following: What is a pattern? To answer this question you can describe in words or use a diagram or a picture to explain what you mean by a pattern.
TASK 2 [Done individually first, followed by class discussion] 1. Are any of the following diagrams patterns? If there are some that are patterns, identify them and explain in each case why it is a pattern. Use the space provided to write your explanation. i. ii.
iii.
iv.
v.
TASK 3 [Done individually first, followed by class discussion] Draw the next shape or shapes in each of the following pictures to extend the patterns. i. ii. iii. 101
iv.
v.
vi.
vii.
viii.
102
TASK 4 [Done individually first, followed by tape recorded group discussion] Use the spaces provided to write down your responses (show all your working). Are any of the following number sequences, patterns? If the sequence is a pattern, extend it. In each case write the rule you are using to extend the pattern. Explain to the people in your group how you know you are correct. a. 1, 2, 3, 4, …
b. 2, 2, 3, 3, 4, 4 …
c. 1, 2, 1, 3, 1, 4, 1, 5, …
d. 4, 7, 10, 13, …
e. 1, 4, 9, 16, …
f. 0, 1, 5, 14, 30, …
g. 2, 5, 11, 23, …
h. 2, 6, 12, 20, 30, …
i. 3, 3, 6, 9, 15, 24, …
103
TASK 5 - Activity 1 A
[Done individually first, followed by whole class discussion]
Materials You will be provided with some matchsticks or toothpicks. Instructions Show all the working and answers on this sheet. Use spaces provided to write down the working (methods, explanations etc.) and answers. i.
Make a triangle using the matchsticks as shown in the figure below.
Enter the number of triangles made and the number of matchsticks used in the table below. ii.
Add a second triangle as shown below.
Enter the number of triangles made and the number of matchsticks used in the table below. iii.
Add a third triangle as shown below.
Enter the number of triangles made and the number of matchsticks used in the table below. iv. Make the pattern with four and five triangles and enter your results in the table below. v. By now you should see a pattern that will enable you to complete the table without making any more triangles. Number of triangles (T) Number of matchsticks
104
Answer the following questions a. How many matchsticks were needed to make the first triangle? b. How many extra matchsticks were needed to make each additional triangle? c. How many matchsticks will be needed to make 20 triangles? Explain your method. d. How many will be needed to make 70 triangles? 100 triangles? Explain your method. e. How do you know that your method is correct? f. If there are 31 matchsticks how many triangles can you make? g. How many triangles can you make with 163 matchsticks?
TASK 5 - Activity 1 B
[Whole class discussion, tape recorded]
003, 004, 005, 008, 016 and 021use different methods to calculate the number of matchsticks in Task 5 – Activity 1A. In your groups discuss the following: (a) Who will get the right answer? Explain why. (b) If someone will not get the right answer, explain why not. (c) Which of these plans do you prefer? Explain why. 003 After the first triangle you need 2 more sticks to make another triangle. So for 20 triangles you multiply 20 by 2 to get 40 then add 1. 004 If you draw the triangles are separated, you need 3 sticks for each triangle. When you join them like in the picture 2 triangles will share a side. That is if you join 2 triangles they share 1 side and if you join 3 triangles 2 sides will be shared meaning you need less sticks. So for 10 triangles you say 10 x 3 to get 30. Then when the triangles are joined 9 sides are shared so we subtract 9 sticks from 30 to get 21 sticks. 005 If the triangles you want to make are too many for the sticks you have or you do not have the space to make the triangles, e.g. 100; you subtract the sticks for one triangle, which is there. What you do is to subtract that 1 triangle from 100 to get 99. For the 99 triangles you need to add two sticks to make each triangle. So you multiply 99 by 2 to get 198. Then add the three sticks you had subtracted to get 201. 008 10 21
20 41
40 61
50 81
60 101
70 121
80 141
90 161
100 181
Because the numbers are increasing by 21, 10 = 21. Therefore 70 = more 70 = 21 x 70/10 = 21 x 7 =147
105
016 I see from the table that 3 to 5 is plus 2 and 5 to 7 is plus two and from 7-9 so I continue to add 2 until I reach 20 triangles or more. 021 1 triangle = 3 70 triangles = more sticks. You then do simple proportion and subtract 1 from the answer. 70/1 x 3 = 210 – 1 = 209.
TASK 5 - Activity 3
[Individual followed by group discussions]
Instruction You can use the materials provided (matchsticks or toothpicks) to help you answer this question. Dadirayi makes a pattern of squares like this:
Shape 1
Shape 2
Shape 3
If she used matchsticks or toothpicks to make the shapes: a. How many matchsticks does she use to form Shape 4? b. How many matchsticks does she use to form Shape 5? c. How many matchsticks does she use to form Shape 100? Explain your method. d. Dadirayi has 516 matchsticks. Which shape number can she form? Explain your method. e. Complete the table for Dadirayi: Shape number Number of matchsticks
6 44
7 52
8 60
9 68
10
11
12
13
14
f. Write a rule for Dadirayi to calculate the number of matchsticks she needs for any shape number. g. Explain your rule. h. How many matchsticks does Dadirayi use to form Shape n?
106
TASK 5 - Activity 4 A
[Group work followed by tape recorded whole class discussion]
[Adapted from Van De Walle 2004: 441 - Activity23.1] Perimeter patterns How do you find the perimeter of each of the following shapes? Explain your method to members of your group.
1
2
3
4
Materials: You are provided with paper cuttings of regular polygons (square, trapezoid and hexagon) to use as tiles to build the strings or blocks of regular polygons. In this activity, you will explore the perimeters of strings of regular polygons. Each string of regular polygons is made up of tiles of the same shape. Adjoining tiles share one side as shown in the diagrams below. For a given shape find a rule or formula for the perimeter (P) of strings of any number (N) of tiles. 1.
2.
In each case what is the perimeter (P) of a string of N pattern blocks? 3. Draw a table showing the perimeters of a string of N pattern blocks for the hexagons. 4. Can you draw a graph of the perimeters made from the pattern-block strings? If you can, draw one for the hexagons.
107
Activity 4B [Done individually] 1. In activity 4A, how does the perimeter change as we increase the number of tiles? 2. How does the perimeter of a square change as we increase the length of a side? 3. Use a table to illustrate your answer to Question 2. 4. Draw a graph to illustrate your answer to Question 2.
TASK 5 - Activity 5 [Adapted from Bednarz et. al. 1996: 295] Problem: How many students can sit around a table of varying lengths? Find a formula or rule that can be used to find the number of people that can sit around a table formed by a sequence of unit-tables joined together as shown in the diagrams below:
TASK 6 - Function Machine Whole class discussion The following machine adds 5 to every number that goes through it (input). For example when 7 is put into the machine the output is 12. 7
Add 5
12
(a) If you change the input 7, what happens to the output?
108
(b) (c) (d) (e) (f)
What are the outputs for the following inputs: 3, 9, 12, 45, 6.5, -8, 0, x. If the output from the above machine is 19, what is the input? Are the outputs the same? Give reasons for your answer. In pairs change the operator and ask your partner to find the outputs. The following table shows the inputs that go into a machine and the corresponding outputs: Input 15 62 0 -10 0.6
Output
7.5
31
0
-5
0.3
(g) What does the machine do to the inputs to get the outputs? Illustrate this information using a function machine.
109
TASK 7 - Activity A Input / Output diagrams (Human et al. 2000 pp 3-8) 1. Complete the diagrams: i. 30 40 50 60 70 80 90 110
+67
ii. 34 44 54 64 74 84 94
-22
114 iii. 7 13 25
+10
50 9 5
iv.
2 3 5 8 10 12 15
+2
×3
110
TASK 7 - Activity B Input / Output diagrams 1.
-3
+48
h.
l.
w.
r.
-200
+60
The numbers on the left side of each diagram are called the input numbers, and the numbers on the right side are called output numbers. In h above, 54 is the output number that corresponds to the input number 6. (a) In l, what is the output number for the input 34? (b) What is the input number in w that corresponds to the output number 760? (c) In which diagram does the output number 260 correspond to the input number 200? (d) In which diagram does the output number correspond to the input number 30? (e) What will the output number in h be if the input number is 30? (f) What will the input number in h be if the output number is 148? (g) The output number for r is -100 ("minus 100" or "negative 100") if the input number is 100. What will the output number for r be if the input number is 40? (h) What will the output number in l be if the input number is 0? 2. Fill in the missing output numbers and the operator. i. 30
24
40
34 44 54
50 60
70 80
90 110
111
ii. 1
12
2 3
13 14 15
4 5 6 7 8
3. Fill in the missing operator in each of the following diagrams. i. 45
23 53
75
51
73
80 10
?
102
32
42
64
15
37
ii
9
3 15
225
1
1
8
?
64
10
100
12
144
5
25
112
TASK 7- Activity C Input-output diagrams - Compositions Complete the flow (input - output) diagrams: i.
2 3 5 8 10 12
×3
+2
15
ii. 2 3 5 8 10 12
+2
×3
15
iii.
In the flow diagram fill in the missing operator. Explain how you would convince your group mates that you are correct.
1
3 5
2
7
3
9
4 5 6
11 13
113
TASK 7 - Activity D Guess My Rule Game 1. In a "Guess My Rule Game" with numbers, when Tendai said 2, Farai said 5; when Chipo said 4 Farai said 7; when Mary said 10, Farai said 13. (i) When Kudzai said 6 what did Farai say? (ii) What is Farai's rule? (iii) Play this game in pairs. 2. Guess and write down the rule for the responses in each of the following: Input number 1 0 4 10
Output number 3 0 12 30
Input number 2 3 5 10
Output number 5 7 11 21
Input number 2 4 7 21
Output number 0 0 7 21
3. (a) Complete the following table. (b) Write a rule for calculating the output number. (c) Explain how you would convince the others that your rule is correct. Input 3 … 7 … 12 … 21
Output 11 … 23 … 38 … 65
114
TASK 8 - Word Problems Instructions - Do this activity in pairs. Show all your working on the writing papers provided. 1. A survey carried out on the sales of your school tuck shop revealed that 2 out of 3 students who buy in the tuck shop buy a packet of maputi. How do we find the number of packets of maputi bought at any given day? 2. Two cloakrooms are located next to each other at a bus terminus. One cloakroom charges Z$600 an hour for luggage left in its care. This charge includes an insurance fee. The second one charges Z$400 an hour and an additional Z$1000, which they call insurance fee. Both cloakrooms are well known for their excellent services. Which cloakroom would you leave your luggage? Explain your reasons. 3. A school has a small forest with 300 trees. Each year 20% of the trees will be cut down and 100 new trees will be planted. After 5 years how many trees will be in the forest?
TEST 2: Instructions: Use the space provided and the spaces at the back of this paper to show all your working and answers. Attempt all the questions 1. Fill in the spaces provided to extend the following patterns. i. ii. 1; 3; 5; 7; __; __; __ 2. Describe or draw the 7th shape in the following patterns. i. ii.
3. How many tiles are needed to make the 10th shape in the following pattern?
115
4. Complete the following flow diagram. Explain your method? 5
1 2
9
3
13
4 6 9
37
15 5.
Farai gets Z$30000 every month for lunch at school. Farai takes Z$1500 everyday to school. Besides counting the money, how can Farai calculate the amount of money left? Explain your method.
6. Farai would like to use public libraries to borrow books for school homework and general reading. In the city there are two public libraries and the student phones them for information about the borrowing fees. One of the libraries Turner Memorial sent a table of monthly borrowing fees for various numbers of books as shown below. The student is allowed to borrow a maximum of 9 books. Number of books 1 Borrowing Fees (Z$) 90
2 170
3 240
4 300
5 350
6 390
7 420
8 440
9 450
The Community library sent a graph of their monthly borrowing fees as shown below. The student is allowed to borrow a maximum of 9 books. Community Library Borrowing Fees 630
Borrowing fees in Z$
560 490 420 350 280 210 140 70 0 0
2
4
6
8
10
Number of books
116
a. Which library should Farai choose to use? Explain your choice. b. Explain how you used the information in the table and graph to make your decision. c. If he wants 6 books, which library should Farai use and how much will it cost him to borrow the books for a month?
TEST 3: Use the answer sheets provided to answer the following questions. Show all your working. 1. Consider the following function machine. Input
Multiply by 3 Add 2
Output Use it to answer the following questions. Show all your working and explain clearly what your are doing. (a) What is the output if the input is: i. 7 ii. 3,6 iii. x (b) What is the input when the output is: i. 35 ii. 6,5 iii. y (c) Can we use a table to showing some of the inputs into the function machine and the outputs? If yes draw a clearly labelled table (d) Can this information be represented by a line graph? If yes draw the graph. Put input on the horizontal axis and output on the vertical axis
Input 117
TEST 4 Answer all the questions on the answer sheets provided. Show all your working. 1. How do you describe: (a) A variable. (b) An input variable. (c) An output variable. (d) A dependent variable. 2. Copy and complete the tables. In each case explain the method that you will have used to complete the table. Input variable Output variable
1 1
2 3
3 5
4 7
5
6
13
24
Input variable Output variable
1 2
2 5
3 6
4 7
5 10
6
13
24
3. Tapfuma works part-time during the holidays selling newspapers. He receives Z$10 00,00 as basic salary per week, plus Z$400,00 for each newspaper sold. (a) Show this information in a table. (b) Draw a graph to illustrate this information (c) How much can he earn a week? (d) How many newspapers must he sell to earn at least Z$50 000,00?
118
APPENDIX III ASSESSMENT SCHEMES TABLE III-1: TEST 1 ASSESSMENT SCHEME QUESTION 1a Change, relationship and strategy 1b Change, relationship and strategy 2 Rule 3 Rule
4 Solution and strategy 5a- sol Rule
5b-reason Relationship 6a Representation and strategy 6b Representation and strategy 8a & b Solution and strategy
SCORE
POSSIBLE SOLUTION 7 * 600 (1000 + 600) * 7 1000 * 7 + 600 1000 + (600 * 7) 7600/11 200 7600/600 7600/1600 (7600 – 600) /7 (7600 – 1000) /600 An equation Money * # hours worked 200 * # hours worked 2000 / 100 = Z$20 per week 2000 * 100 + newspaper sold 2000 + 100 2100 or more 2000 * 7 +100 per newspaper 2000 + # newspaper sold * 100 7500/5 = 9000/5 Less than 6,25 kg 1,5kg cost Z$ 2250. Do simple proportion 6 kg because 1 onion cost Z$1500 3,8,14,16,18 or No sense 3,9,15,17,19 3,10,1.5,61,x 3,10,4,61 3,10,4,61, x+x+1 (2x + 1) No sense Output is increasing by 2 For every number given I will add a number more by one I would have added before Add next number that follows that number (x + x + 1) None correct 1 correct – 8000, 11 000, 13 500 2 correct -8000, 11 000, 17 500 All correct – 8000, 11 000, 15 000 None correct 1 correct – 4kg; 5,.2kg, 11,5kg 2 correct – 4kg; 5.4kg;11,5kg All correct – 4kg; 5,4kg; 8,75kg 20 = 100/5 90= (100/50) * 45 1000 = # of rows by itself twice 186= # of cans required for 50 rows* 2 180= (100/5) * 9 500 = 25 * 100/5 102 - In each row the # of cans is increasing with two 199 – Add 2 previous rows to get # of cans in next row Or 2 x row number - 1
LEVEL 1+1+0 1+1+0 0+0+0 2+2+2 0+0+0 0+0+1 0+0+1 0+0+0 2+2+2 0 +0 1 2 0 0 0 1 1 2 0+0 1+0 0+2 1+2 0 1 1
003
008
011
017
1
1
1
1
021
022 1
6 0
023
6
0 1
1
1
1
1 2
1
1 2
2
2
2
0 0
0 1
1 2
2 0 1 2
3 0 0
3 0 1
1 0 1
2 0
1
1
2 0 1 1 2 0 +0 1+0 2+1 2+2 0 1 2+1 2+2 0+0 0+0 0+0 0+0 0+1 0+1 0+1 2+2
0
1
0 1
1
1
1 3
1
1
3 4
4
0 1 3 4
3
3
4 0
0 1 1
1 1
1
17
6
17
7
22
119
9
22
TABLE III-2:
Aspect of function Changes / variable [C] What changes? How it changes Relationship/rule [R] Recursive / Functional
Question 1(i)
• • •
1(ii)
• •
2(i)
• • • •
2(ii)
3
4
5
6
Arrow orientation (vertical followed by horizontal orientation) (C1) Arrow shape does not change (two-way pointed). (C1) Number of arrows corresponds to position of arrows. (R2) Observes increase (or difference) of 2 between numbers (implied by the answer). (C1) Observes increase (or difference) of 2 between consecutive numbers (implied by the answer). (R1) The size of the shape. (C1) Number of rectangles in each shape position of pattern. (C2) The number of rectangles in each shape position increase by 1. (R1) Number of rectangles in each shape position equals the shape number (stated). (R2)
• • • • •
003 C 1
008
Student 017 021
011
022
023
R C R C R C R C R C R C R 1 1 1 1 1 1
1
1 2
1 2
1
1
1
1
1
1
1
1
0 2
0 1 1
0 2
1
1
1
1
1 1
1 2
1
1
1
1
0 1
0
1 2
1
1
1
1
0 1 1
1 2
1
1
1
1
0 1
2 1
1
1
1
1 1
1
1
2
2
Number of sides in the polygon. (C1) Number of dots inside the polygons. (C1) Position of dots inside the shape. (C1) Regular shape. (C1) Number of sides in the polygon is two more than the position number of the polygon [stated (R2), implied (R1)] • Number of dots in the polygon is equal to the shape position number of the polygon OR two less than the number of sides of the polygon [stated (R2), implied (R1)]
1
1
1
1
0
1
1
0
1
1
0
1
1
1
0
0
0
0
0
0
0
0
0
0
0
0
0
0
• • •
Number of tiles increase. (C1) Number of tiles in the vertical block of each shape increase by 1. [implied (C1)] Number of tiles in the shape at each stage increase by 1 as shape position increase by 1 [stated or implied]. (R1) • The number of tiles in the shape is equal to the shape position + 4 or other correct relationships [stated (R2)]
1
1
1
1
• • •
Consecutive output values are increasing by 4. [stated or implied (C1)] Find output by adding or subtracting 4 to given consecutive output values. (R1) Find outputs by using co-variation, as input increase by 1 output increase by 4. (R2) • Find output value from input value + operator [1 correct output (R1), correct outputs (R2)]
1
1
1
0
0
1
1
1
1
1
0
0
1
1
• Number of days Farai goes to school. (C1) • Amount of pocket money Farai has each day he goes to school. (C2) • Subtracted 1500 from 30000 for each day Farai goes to school. (R1) • Finds days left and multiply by 1500 or money spend and subtract from 30000 (R2) i.e. 1500 x (20 - days Farai goes to school) or 30000 - 1500 * days Farai uses the money
1
0
0
0
0
1
2
0
1
1
0
1
• • •
Total Score
Test 2 –Results
It depends on the number of books borrowed. [stated (R2) implied (R1)] For borrowing less than or equal to 7 books the Community Library is cheaper and for 8 or more books Turner Memorial is cheaper. [stated (C2)] Used the graph and the table to compare the borrowing fees or used the graph and the table to compare the changes in the borrowing fees. [stated (P2)] Turner Memorial for 410. (F2)
1
1
1
0
0
0
1
0
1
1
0
1
1
1
1
1
1 1
1
0 1
1
1 0
1
1 1
1 1
1
2
2
2
0
1
2
2
32
1
2
2
0
0
2
2 0 0
1
1
0
0
0
2
1
0
0
0
1
1
0
0
1
2
0
2
1
0
1
2
1
1
1
0
0
0
1
24
31
16
15
120
24
27
TABLE III-3: Test 3 - Results Question
Aspect of function: rule/ strategy and representation a. b. c. d.
1a (i)
(ii)
(iii)
1b(i)
(ii)
(iii)
c
•
• • •
• • •
• • • • • • • • • • • • • • • • • • • •
d
Total Score
• • •
Follow a rule to get images Find the rule/reverse (inverse) operation to get pre-images Tabular representation of the information given in the function machine Graphical representation of the information given in the function machine or table Wrong answer (0) Applies the given operator to the input correctly (1) Correct output (1) Wrong answer (0) Applies the given operator to the input correctly (1) Correct output (1) Wrong answer (0) Applies the given operator to the input correctly (1) Correct output (1) Wrong / No answer answer (S0) Trial and error (tries the given operator on some input to get the given output). (S1) Reverses the operators in incorrect order (S1) Reverses both operators in the correct order. (S2) Correct input (1) Wrong/ No answer (S0) Trial and error (tries the given operator on some input to get the given output). (S1) Reverses the operators in incorrect order (S1) Reverses both operators in the correct order. (S2) Correct input (1) Wrong/ No answer (S0) Trial and error (tries the given operator on some input to get the given output). (S1) Reverses the operators in incorrect order (S1) Reverses both operators in the correct order. (S2) Correct input (1) No table. (P0) Table with input and some incorrect corresponding output values. (P1) Table with input values and correct corresponding output values. P(2) No graph (P0) Graph with input and output plotted. (P2) Plotted point joined with a line. (P2)
Student 003
008
011
017
021
022
023
1 1
1 1
1 1
1 1
1 1
1 1
1 1
1 1
1 1
1 1
1 1
1 1
1 1
1 1
1 1
1 1
1 1
1 1
1 1
1 1
1 1 0
1
1
1 1
1 1
1 0 0
1
1 0
2 1
1 0
0
0
0
2
2
2 0
2
2 2
17
12
12
1 1
1
2 1
1 0
1
0 1
0
1
2
2 1 0
1 1 2
2
2
0 2 2
19
2
8
16
12
121
TABLE III - 4: Test 4 - Results Question
1a)
1(b)
1(c)
1(d)
Aspect of function: change, relationship and representation
Student
1. 2.
003
Describe a variable. Discover the relationship between two variables presented in a table. 3. Representation of a functional situation using: a table, graph, an equation • Quantity/ number/ value that changes/ varies. (C2) - Any number/ quantity/ value. - Number that takes different values. • Unknown quantity/ number/ value (a letter). (C1) • • • • • • • •
2 (i)
• • •
• •
A changing or any quantity/ number/ value. (C1) Associates it with the operator and the output. (C2) Associates it with an operator only. (C1) No response or sense (C0) A changing or any quantity/ number/ value. (C1) Associates it with the operator and the input. (C2) Associates it with an operator only. (C1) No response or sense (C0) A quantity/ number/ value that changes and depends on another or the output variable. (C2) A quantity etc. or any number that depends on another. (C1) No response or sense. (C0) Correctly completes the table. [9, 11, 25, 47] (2) Apply operation to input to get output. (stated F2, implied F1) No/ wrong output values (0) Iteratively fills in the output values [9, 11, 13, 15](F1)
008
011
2
3a)
b)
c)
d)
Total mark [20]
• Correctly completes the table. [9, 11, 25, 47] (2) • Apply operation to input to get output. (stated F2, implied F1) • No/ wrong output values (0) • Iteratively fills in the output values [9, 11, 13, 15](F1) Table: • Correct table (P2). • Incorrect table (P1). • No table (0) Graph: • Plotted points. (P2) • Not joined with a line (P2), Joined with a line (P1) • No Table. (0) • Newspaper sold x Z$400 +Z$10 000. (C2, F2) • Incorrectly e.g newspaper sold x 400 + 10000 x 7 (C1, F2) • An actual amount for a specified number. (1) • Incorrect or not stated. (0) Number of newspapers he can sell: • A specific number [100]. (2) • Incorrect or not stated. (0)
021
022
023
1
0
2 0 1
1
1
1
1 2
1
1 0
0 1
1
1 1
1
1
1
1
0 2 1
2
0 2 2
0 2 (i)
017
0 1
2 2
0
0
0
0
0
0
0
2
2
2
2
2 1
2
2
2
2
2
2
2
1
2
1
4
4
2
0 4
2
3 0
0
0 19
0
0 7
18
19
0 Abse nt
15
122
10
APPENDIX IV EPISODES FROM THE AUDIO-TAPED DATA Episode 1 – Task 8: Q 2. The cloakroom problem (group work) Group 1 - 003, 008, and 017 Tr. 003 How long do you intend to leave your luggage? 003 --- (laughs) it depends how long you are going and the time you will spend there. Tr. Okay so it depends how long you will be away. 003 & 008 Yes Tr. Suppose you spend two hours and you come back, how much do you pay in the 1st cloakroom for the luggage you have left. 008 & 003 ($) 1 200 Tr. How much do you pay if you leave in the 2nd cloakroom 008 & 003 ($) 1 800 (Repeat) 1 800 Tr. Okay that is if you go for 2 hours suppose you go for --017 You say ($1 000 + 400) x 2 Tr. Why are you multiplying by 2? 017 2 hours Tr. Put it down 017 I am saying 1000 + 400 just because you’re paying $400 for an hour and $1 000 for insurance fee so to combine this insurance fee and the money we add. Tr. And what do we get? 017 $1 400 - - 1 400 (repeats, then hesitates laughs with the girls) Okay I thought $ 1 000 is being paid every hour. Tr. So you know how it’s only paid once, so how much would you pay after 2 hours. 017 $1 800 Tr. Okay, suppose you --- Give me any other time that you might spend 003 4 hours 008 6 hours Tr. 6 hours, can you find out how much you are going to pay. 003 For the 1st cloakroom 3 600, for the next (calculates) 3 400. 008 (objects) Ah – 017 We multiply x 2, 600 by I am trying to --- Is interrupted by 003 Tr. Have you solved the problem? 003 (Laughs, she has made an observation that the 2nd c1oakroom is cheaper) It depends on how many hours you spending away.(008 mumbles something like a disagreement). If you are spending 2 hours, 3 hours or less you go to the 1st cloakroom but if you are spending 6 hours or more you go to the 2nd cloakroom. Tr. How do you know its 6 hours or more? 008 (mumbles some disagreement again) 003 (with confidence) you know that how many hours are you going to be away. 008 I have an argument, which one is cheaper than the 1st one than the 2nd one? 003 Okay for 6 hours, 6 x 600 = 3 600, 6 x 400 = 2 400 plus 1 000 = 3 400 so which one is cheaper? (laughs) get it? 008 (laughs uncertainly) Tr. Are you happy 008? 008 (laughs) Yes Tr. So which one are you going to take? 003 Both because they are all well known for their excellent service so ah ---
Episode 2 Task 8: Q. 2 Group 2 - 011, 021, and 023 Tr. Which one is cheaper? 011 Ah the 2nd one is cheaper because 6 hr x 400 you get 2 400 and then plus 1 000, 3 400. But then this one if you say 6 x 600 you will get 3 600.
123
023 If say 400 x 6 you get 2 400 + 1 000 you get $3 400. Than I will say 600 x 6 to get 3 600. So the 2nd one is cheaper than the 1st one. Tr. Why are you changing your mind? At 1st you said this one. 023 Because this one, we can say it has got a stable insurance. 021 The first one is saying for an hour it is 600 and the second one is saying for an hour it is 400 plus an additional of $1 000 so that is why we are saying the first one is cheaper. 011 You can go anywhere because if you say for 1 hour, for 1 hour you will get 600 for the 1st cloakroom and for 1 hour you get, for the 2nd you get 1 400. But this is only 600. But for 6 hours this one will become cheaper than this one (1st) Tr. So what are you going to do, how are you going to decide? 023 I wanted to say what they said because for the 1st, the 2nd one you are saying, for 1 hour you pay 1 400 and in the 1st one you pay 600. So it increases with the hours gone. 021 But if it increases Tr. Speak up 021 But how come when we are having 6 hours the amount of money, the 1st one will have a lot of more than the 2nd one but at the first we were having more on the 2nd than on the 1st one. Others (murmur some queries) 021 Here we are having 600 (other students – yes) and here we are having 1 400. This one the 2nd one has got one. 023 Hold on, I have understood the question on the 1st one it is increasing when you multiply the insurance is already added with the payment for 1 hour and here we can just add only 100 after every hour you have left your things, your luggage. 011 (laughs) We cannot choose the cloakroom which is cheaper because it depends on how many hours are you going to leave your luggage, luggage. Tr. He asked the question. 021 have you found an answer to your question? He said why is it that at one time this (2nd) was less than that (1st) 021 I am saying that for an hour the 1st one, the 1st cloakroom you pay $600 only and the 2nd cloakroom you pay 1400. How will it that in the 1st one for 6 hours you pay 3 600 and for the 2nd cloakroom you pay 3 400? Tr. So you are saying how did it happen? 021 Yes Tr. Is that what you want to find out? 023 At the 2nd one it is said you charge $400 for an hour then an insurance of 1 000. Then at the 1st you pay 600 an hour the insurance is already included in the money charged. Tr. Did you get his question. He was saying how did it happen that when you get to 6 hours the numbers are switching. In other words its cheaper now. 023 Yes, we can say, we said we have 6 hours, then the 1st one is charging 600/h so we multiply 600 x 6 to get 3 600. Then the 2nd one you say 400 x 6, then you get 2 400 plus 1 000 then you get 3 400. 021 But isn’t it that 1 400 by 6? 023 No because here it said the 2nd one offers an insurance of 1 000 besides the hour payments. Tr. So the insurance is charged once, once its charged it's charged for as long as you keep your luggage on that day. If you then take them out and come back later they will charge you another 1 000 and count the hours (from zero). But his question has not been answered ---- He said 021 I am saying the 1st cloakroom charges 600/hr and here for the 2nd cloakroom he charges 400/hr plus an additional 1 000 for insurance. Then if you put your luggage there, if they keep for you for 6 hours then the 1st cloakroom will charge you 3 600 and the 2nd 3 400 how came the 1st cloakroom charge more but at the 1st it had less. 023 No the 1st one, the 2nd one, the 1st one is charging more if you say, let’s say the insurances are different because if you say maybe for 6 hours if you subtract, 200 x 6 from 3 600. Tr. (intervenes) Okay can I ask you something. Why don’t you record the ---023 On a table? Tr. Try and see if it will help you. 023 (Makes the table) 021 (working out the table values). For 1 hour for the 1st cloakroom it will charge you $600 and for the 2nd cloakroom it will charge you $600 and for the 2nd cloakroom it will charge you 1400, then for 2 hours this one will pay 1 200 and the 2nd 1 800
Episode 3 - Task 8: Phone shops problem. Language aspect Tr. So there is time when the --- Is it possible to have a time when you (pay) the same (amount)? 021 & Others No Tr. No its not possible 003 I think its possible Tr. 003 011 When 003 I think its possible to draw a table to find when they will pay the same.
124
… 023 Ee, the money, the payment which is charged for 1 hour is our input. When – as we increase the ---- as the hours increase, the payment increases. Tr. So your input is the hour, is the payment? 023 Yes, the payment for 1 hour because if I say the payment Tr. Does the payment for 1 hour change. 023 No it doesn’t change, the payment for hours --Others (laughs) Tr. 017 what is your input? 017 I think the input is the hours Tr. Why do you say it is hours? 017 I say the hours just because there is umm… the money that is being paid plus the hours you get the output (some disapproval from others) 003 I think the input is the hours because the hours change from one person to the other. If you put the hours in the operator it won’t because they are changing. So for the input they are the hours, the operator the money being paid for an hour. Tr. So you use --- 008 the operator is the money being paid for 1 hour. 011 you don’t agree what is the operator? 011 The operator should be the hours. 003 How will they operate? You leave your luggage for 1 hour and Holderness for 3 hours, how will you write? 011 Our input will be the money, the money paid and our operator will be the amount, our operator will be the hours you spend and the output will be the money you have been charged. Others Aaa! 021 I think the input is the money you pay. Tr. You pay to who 021? For an hour, the input is the money you pay? 023 I think --- I want to correct 011, the operator must be the money you pay for 1 hour 003 – Yes because without the money, you cannot have a difference, or a decrease or an increase. Tr. Lets put it in a diagram (the flow diagram) and show it in your diagram. Just draw a diagram to show what you are saying. What is the relationship between, you said there is a relationship between the input and output? 023 Yes there is a relationship between the input and output because ee I found that when you divide the input into the output it will still give you the operator. Tr. It will give you the operator? 023 For example 1 into 600 you get 600, 2 into 1 200 gives 600, 3 into 1 800 gives 600, 4 into 2 400 gives 600. Tr. Anybody else who has something to say about the relationship …? Is there any relationship? What about 021? 021 I have the same idea with 023 Tr. Okay what statement did you write down? 021 Input is multiplied by 600, which is being paid after every minute. That means that if the input is 1 the output is 600 and the operator is 600, and they are related because if I multiply 600 by 1 I get 600 and if I divide 1 into 600 I get 600 which is the operator. 023 I think the relationship between the input and the output is that for the 1st 600 we know that 600 is the sum being paid for an hour and 1200 for 2 hours, so that is the relationship 600 to 1, 1 200 to 2 Tr. That’s the relationship? 003 Yah Tr. What did you write? How did you get your output 008? 008 To get the output I will multiply the price, the charges for 1 hour then I will multiply the charges by the hours, which I will have spend. Tr. And get what? 008 I will get my output
Episode 4: Task 8 – Tuck shop problem Tr. What is sold at your tuckshop? Students Maputi, freeze-it, matemba, biscuits some drinks and its called Tondido. 017 (Reads the question) (Had problems pronouncing “survey” and “revealed” – perhaps these are not familiar words) Tr. I will give you another minute to read the question. 003 (interrupts) What is a survey? Tr. Okay does somebody know? What is a survey? Do you know what a survey is? 011 An investigation Tr. An investigation like, what happened in this one, how was it done. 021 Somebody and investigated and found out that there 2 out of 3 students who visit at the tuckshop buy maputi. Tr. The most important thing we want is for you to explain to your friend, your answer and why you think you are right. 021 I think you multiply ⅔ by the number of students who buy at the tuckshop and get the number of packets of maputi.
125
Tr. (After no response comments from others) If you have any questions to ask – ask him. 008 What was your answer? Let’s say you don’t know the number of pupils at St Dominics and you’re said to calculate the amount or the packets of maputi will buy. How do you calculate them if you don’t know the students? 003 I will say “x” is equal to the number of students who buy at the tuckshop and I say ⅔ x which is ⅔* the number of packets of maputi bought at a day. 008 So what is your answer, I want the answer? 003 ⅔ x Others (Disagree including 008). Aa aa – 021 What Diana is saying eh I think I disagree because if you are not given the number of students who buy at the tuckshop how will you work it? Tr. Whom are you addressing 008 or 003? 008 Because here its also said ⅔ of the students but we don’t know the amount of people who are learning at the number of people who are learning at St Dominics Tr. Can I ask you a question? Are we saying all the students at St Dominics Others No --- Some of the students 003 Who buy at the tuckshop 003 Students who buy at the tuckshop. We don’t know the number of people who buy at the tuckshop because today I will buy a packet of maputi, tomorrow I will buy a freeze-it, the next day I will not buy anything at the tuckshop. So the number varies it depends on how many people bought at the tuckshop on that day. Tr. So you said the number does what? 003 It varies Tr. (to other students) It varies. Do we understand what she means by that? Others Yes Tr. 021 what does she mean by the number varies 021 It means that its not all days; I am trying to say that a person buys maputi today, tomorrow he or she will buy a freeze-it so the number varies. 023 But the question says “A survey carried out on the sales of your school tuckshop, tuckshop, revealed that 2 out of 3 students who buy in --- maputi” It is already said 2 out of 3. Can’t I say 2 out of 6, 7 out of 9. 003 We never said the fraction varies but the number of people who buy at the tuckshop. 023 Yes they are always ⅔ 003 ⅔ of people who buy maputi. But the number of people who are ⅔ of that number varies. We don’t know the number so how many people buy? Others interrupt 023 Can I ask, why are you saying why are you saying? 003 Do you buy a packet of maputi everyday. 023 Yes
126
APPENDIX V ANNALYSIS OF PUPILS LEVELS OF DEVELOPMENT IN THE VARIOUS ASPECTS ACROSS THE TEACHING EXPERIMENT
LEARNING PHASE
Question 8
Task 5- Activity 1 (c)
Task 5-Activity 2B (c)
Task 5- Activity 5
Pupil
END OF EXPERIMENT
Pattern
Pattern
Pattern
Pattern
003
I calculated the number of cans required for 50 rows then multiply by 2
Number of sticks for 20 triangles we will say 20 times 2 +1.
She will say shape number x 2 –1
F2 C2, F1
F2
For shape n she needs n x2 –1 squares.
We say the number of people sitting on a table x the number of tables the number of sides being shared by the tables F2
Test 2 – Q.5 Word problem
Test 3 Input Output
Test 4 - 3c
To find the money left he will say 1500 into 30000 the number he get will be the number of days he will spent with the money then subtract the number he get with the number of days he had used then multiply it by 1500 F2
Q.1 a (iii) “3x + 2” Q.1 b (iii) Cancelled “y – 2 /3 ?”
In a week he will receive Z$10000 x the number of newspaper he would have sold
F2
F2
Word problem
127
Vertical growth
TEST 1
LEVEL
RULE
Analysis of responses on the aspect rule for each of the seven pupils at various stages in the teaching experiment
F2
Task 5- Activity 1 (c)
Task 5-Activity 2B (c)
Task 5- Activity 5
Pupil
RULE
Question 8 Pattern
Pattern
Pattern
Pattern
008
In each row the number of cans is increasing with two.
Extends the table for triangles 11-20 (intervals of 1 triangle) and for 10 – 100 (intervals of 10) to correspond with increases of 20 matchsticks for each interval.
Shape number x 2 –1
He need n x 2-1 =1 n, n=1.
F2
F1
C2,F1
END OF EXPERIMENT
F1 011
25 cans equals to 5 rows. So we say 5 into 100 equal to 20. So 25 x 20 =500 C2
We are saying 1 triangle as to 3 matchsticks and it is increasing by 2. F2
017
50 cans to 45th row 100 cans more (100/50)*45
First of all we can use the ratio of 1: 2. Hereby do simple proportion and add 1 to the denominator wherever we want the number of match stick.
C2, F1
Rule is to say shape number x 2 –1 F2 She must say, subtract and the answer she get must come as that 5, 6, 7, 8, 9
F1
He needs n squares x 2 – 1. F2 Cancels “Shape n will be 6-n, 7-n, 8n….” and replaces with “shape number x 21.” F1
On the first table there are 4 people, second 6. To get the number of people sitting on the third table. We add three people for the three tables. 3 table x 3 pple, 9 people – 1 on the edge to get 8 people sitting on table 4. F0 We will say the no. of tables times two plus two people sitting aside F2 We simply use ratio on that problem 1:4 F1
Test 2 – Q.5 Word problem
Test 3 Input Output
Test 4 - 3c
We divide Z$30000 into Z$1500 to get the amount of money left. Z$30000/Z$1500=Z$2 0 left. Then subtract the amount he had used and multiply by $1500. F2
1a(iii) “3x+2” 1b(iii) No response
Tapfuma can earn Z$40000 x Z$400 + newspaper sold.
F1
F0
He must say the amount he use subtract from the actual number which is $30000 F2 He would say $30000($1500+$1500) = $30000-$3000 = $27000.
1a (iii) “3x+2” 1b (iii) “y / 3 +2 – 1” F2 1a (iii) “3x+2”
No response
F2
“$10000x”
F1
F1
Word problem
F1 1b (iii) “y / 3 –2” F2
F1
128
Vertical growth
LEARNING PHASE
LEVEL
TEST 1
F1
Task 5- Activity 1 (c)
Task 5-Activity 2B (c)
Task 5- Activity 5
Pupil
RULE
Question 8 Pattern
Pattern
Pattern
Pattern
021
You count how many cans are in the last row. In this case our last row is 5 and it has 9 cans. Then you say 5th row has 9 cans what about in the 100th row then you do simple proportion C2, F1
You first find the scale or ratio which is needed for two triangles which is 1: 2. So you say 1:2 what about 10 then you will say more sticks and do simple proportion for example 1: 2 what about 15, more sticks, then 15/1 *2 = 30 and add the denominator and you will get 31 sticks. F1
Number of squares increase by two in each case after an additional shape number.
Add the number of cans in 5 rows and multiply by 50.
1 triangle has 3 matchsticks and for each additional triangle there are two additional matchsticks. So you add up to 20 triangles and see how many matchsticks will be needed. F1
Add 1 to the shape number and divide by 2.
022
C2, F1
END OF EXPERIMENT
Shape n = n square. (n x 2)-1= (n x 2) –1. F2
F1
F1
F2
The people are increasing by 2 so you can do simple proportion then divide by 2 and add two which are being added in each case to the answer.
“n + 1 / 2”
Formula – The more 1 table is added to the example two people also join the group like for example the first had four pupils. When the second table was added 6 pupils were now sitting round the table. F2
Test 2 – Q.5 Word problem
Test 3 Input Output
Test 4 - 3c
1 day you spend 1500 so you say 1 day = 1500 is spent 3 days that means you spend more so you say 3 x 1500 = $4500. Money left you saw $30000 – 4500 = $25000. Money left = (Day x 1500) answer subtract from $30000. F2
1a (iii) “(x x 3) + 2”
No response
For every day he takes 1500 a week he will take 1500 x 5 days. So for a month which has got 4 weeks that means 1500x7 which we get 10500? So the 10500x4 we have 42000… You then subtract 30000 from 42000. F1
1a (iii) “3x + 2” F2
Word problem
F0
1b (iii) “(y - 2) / 3” F2
1b (iii) No response F0
Tabulated results imply Money earned = $10000 + 400* number of newspapers sold F2
129
Vertical growth
LEARNING PHASE
LEVEL
TEST 1
PP RC FC PP FC FC
RC FC FC
Task 5- Activity 1 (c)
Task 5-Activity 2B (c)
Task 5- Activity 5
Pupil
RULE
Question 8 Pattern
Pattern
Pattern
Pattern
023
I used simple proportion. I saw that the 5 rows contain 25 cans so 100 rows contain more and I multiplied 100 by 5 so I got 500 cans
“… base of the two triangles are represented by 1 matchstick. So it is 1:2. Multiplying the number of triangles asked for by 2 and the 2 comes from the two sides, which are being added to obtain as many triangles. After that, add one which is represented by 1 stick representing two bases”.F2
“Shape number x 2 –1 = z squares.”
C2, F1.
END OF EXPERIMENT
“She needs nx2–1=z squares”. F2
F2
“You must multiply the number of available tables by 4 pupils subtract the edges of the tables being joined together by the number you have obtained.” F2
Test 2 – Q.5 Word problem
Test 3 Input Output
Test 4 - 3c
“Farai would divide the money of 1 day’s lunch ($1500) into $30000 the total money”. F1
1a (iii) “(x x 3)+2 = 5x” F1/2 1b (iii) “(y x 3 )+2 = 3y + 2 = 5y” F1
He can earn $10000 x 7 + 400 newspapers he had sold F2
Word problem
130
Vertical growth
LEARNING PHASE
LEVEL
TEST 1