AN OBJECT-BASED IMAGE INTERPRETATION APPLICATION ON CLOUD COMPUTING INFRASTRUCTURE
R. R. Antunes a, P. N. Happ c, E. S. Bias a *, R. S. Brites a, G. A. O. P. Costa b, R. Q. Feitosa b, c a
University of Brasilia, Brazil –
[email protected],
[email protected],
[email protected] b Rio de Janeiro State University, Brazil –
[email protected] c Pontifical Catholic University of Rio de Janeiro, Brazil –
[email protected]
KEY WORDS: Remote Sensing, Object-Based Image Analysis, Distributed Processing, Cloud Computing
ABSTRACT: The rapid increase in the number and in the spatial resolution of aerial and orbital Earth observation systems is generating a huge amount of remote sensing data that need to be readily transformed into useful information for policy and decision makers. A possible approach to tackle the demand for image interpretation tools that can deal efficiently with very large volumes of data is to employ data analysis methods based on distributed computing. This paper presents an object-based, remote sensing image interpretation application executed over cloud-computing infrastructure. The application is implemented with InterCloud, a novel image interpretation platform designed to run on computer grids (physical clusters or cloud-computing infrastructure). The application described in this paper is a land cover/land use classification of a pansharpened GeoEye-1 image, with 19k by 23k pixels. The image covers an area of the municipality of Goianésia, in Goiás State, Brazil. The site contains sparse urban areas intermixed with rural areas and natural patches of the Brazilian Cerrado biome. Eleven classes of objects, including urban, rural and Cerrado reminiscent targets were considered. In addition to the accuracies of the classification result, in this work we evaluate the scalability capability of InterCloud by performing different runs of the application with different configurations of the cloud infrastructure, in which we vary the number of computing nodes. 1. INTRODUCTION The rapid increase in the number and in the spatial, spectral and temporal resolutions of aerial and orbital Earth observation systems is generating a huge amount of remote sensing data (Zhang et al., 2015). As examples, Sentinel-1 from ESA produces around 1.5 GB per day (Grabak, 2014) and EOSDIS project from NASA generates about 16 TB per day (NASA EARTHDATA, 2015). Other space agencies around the world produce a comparable amount of remote sensing image data daily. Moreover, companies like Digital Globe, Planet Labs and Skybox Imaging are about to sum up one hundred satellites orbiting the globe. This scenario unveils great challenges for the remote sensing community related mainly to the capacity of dealing with very large datasets (Yan Ma et al, 2015; Lee et al., 2015). In fact, the techniques and automatic tools currently available for image interpretation are not ready to handle the massive volumes of remote sensing data being currently produced. An approach to tackle the demand for image interpretation tools that can deal efficiently with very large datasets is to employ distributed computing based techniques. In this context, cloud computing is a trend (Hashem et al., 2015) as it delivers a powerful infrastructure to perform large-scale computing, usually available in a pay-as-you-go model, which alleviates users from the need to acquire and maintain complex computing hardware.
* Corresponding author
In this work, we present an object-based, remote sensing image interpretation application executed on cloud-computing infrastructure. The application is implemented with InterCloud, a novel image interpretation platform designed to run on computer grids (physical clusters or cloud-computing infrastructure). InterCloud can exploit the scalability provided by commercial cloud-computing infrastructure services, enabling the interpretation of very large remote sensing datasets in an efficient way. The land cover/land use classification application uses different modules of InterCloud: distributed segmentation, distributed feature extraction; and the distributed classification. The application was executed using a commercial cloud-computing infrastructure service. The remainder of this paper is organized as follows. The InterCloud distributed architecture and its different modules are briefly described in Section 3. The interpretation application and the experiments conducted with InterCloud are described in Section 3. Section 4 presents conclusions and gives some directions for future related research. 2. INTERCLOUD InterCloud is a novel, open-source, image interpretation platform, which supports the creation of interpretation models and the execution of such models on cloud computing infrastructure. InterCloud can be regarded as a redesign of InterIMAGE (Costa et al., 2010) conceived to process arbitrarily large datasets in a distributed fashion.
Although the architecture of InterCloud have already been described before (Ferreira et al., 2014), it is important to recall some of its main aspects. The architecture is composed by three abstraction layers: the project definition layer, the image interpretation layer, and the distribution layer. The project definition layer supports the definition of all the information required for the execution of the interpretation application. This layer supports the definition of image interpretation models that describes the characteristics or properties of the classes of interest, and the models’ processing chains. The interpretation layer contains the algorithms and methods available to be used on the platform. It is structured on a highlevel programming language that hides the complexity of dealing directly with the distributed programming model. A user with conventional programming skills can embed new algorithms into this layer, so that an end user can select them in the project definition layer. It is worth mentioning that the interface between project and interpretation layers is defined by a translation of the first into processing and data flow instructions in the latter. The distribution layer is associated to the distributed execution of an interpretation model. Only experts in distributed systems are able to interact with this layer. The interface between the interpretation and the distribution layers is defined by a translation of the first into distributed programming code available on the latter. Another important aspect of InterCloud is its modular structure: the platform integrates different, independent modules. The modules are based on the same architecture and share the InterCloud core engine. This engine is responsible for the common methods, and the control of execution on the distributed environment. The three modules used in this work, relate to the three main processing steps in image interpretation: image segmentation, feature extraction and classification (Figure 1).
Figure 1. Image interpretation scheme
performance and scalability for this task. Therefore, distributed processing is an alternative to enable image segmentation of very large remote sensing imagery. This is the main premise in the design of InterCloud Image Segmentation module. The Image Segmentation module contain different algorithms. In this work, a distributed region growing segmentation method was used (Happ et al., 2015). First, the image is split into tiles that are spatially indexed. Next, an independent region growing segmentation is performed on each tile, in a distributed fashion. Then, the internal segments, i.e. those that do not touch the tile’s borders, are preserved. The other segments, i.e. those that touch borders, are grouped for a distributed post-processing step in order to continue the growing process. The input of this module is a raster image, which is divided into spatially indexed tiles. The tiles are stored on an auxiliary file repository to be retrieved when necessary. The segmentation output is a vector containing the generated segments. This vector is also stored on the same auxiliary file repository. 2.2 Feature Extraction The Feature Extraction module is responsible for distributed computing of segments’ properties. It is capable of computing spectral, textural, morphological features, as well as topological relationships among segments. The user is responsible for selecting which features should be calculated. Then, based on the vector data coming from the segmentation, all the features are computed on a distributed way. The module uses a spatial indexing mechanism in order to group segments on the distributed environment and to retrieve the image tiles when spectral information is required. The processing output is vector data containing the computed feature values. These values will be latter used in the classification process. 2.3 Classification The classification or recognition step considers segments’ properties to associate them to object classes. For this task, complex knowledge-based descriptions can be used, as well as unsupervised and supervised classification methods. Although InterCloud can handle all those alternatives, in this work we employed the latter. Supervised classification methods are based on samples: the assignment of a segment to a class depends on some sort of similarity of the segment to the samples of that class. Thus, it is important to collect samples that can clearly discriminate one class from the others. In InterCloud, the user must select some segments as samples and label then accordingly in order to create the training dataset. The remaining segments will be considered as the classification dataset.
2.1 Image Segmentation Image segmentation plays a key role in image interpretation since it delineates the segments that should represent image objects to be further classified. This task usually involves a high computational cost, especially when dealing with very large images. Considering the increasing of earth observation data volume, sequential and parallel solutions fail to deliver the expected
The distributed supervised classification method is based on (Ayma et al., 2014). The classification dataset is split into disjoined subsets to be distributed, while the training set is stored on an auxiliary storage system. When the execution starts, the training dataset is retrieved to build the classification model for each processing element. Then, the model is used to classify each subset of the classification dataset in the corresponding processing elements. Finally, all the parts of the
classification dataset are coupled to get the (complete) classification outcome. Currently InterCloud’s classification module contains different machine learning algorithms, like Naïve Bayes Classifier, Decision Trees, Random Forest and Support Vector Machines. The input of this module is a list of segments with corresponding feature values. The samples, with their feature values and class associations are stored on an auxiliary file repository to be retrieved when necessary. The output is a list of classified segments. 3. EXPERIMENTAL ANALYSIS The experimental analysis is based on an object-based application with the InterCloud platform. It is an automatic land cover/land use classification of a remote sensing image involving the distributed segmentation, feature extraction and classification modules. The application was executed using a commercial cloud-computing infrastructure service. In addition to the accuracies of the classification, we evaluate the scalability capability of InterCloud by performing different runs of the application with different configurations of the cloud infrastructure, in which we vary the number of computing nodes. We note that this is an ongoing research, and what we show here are preliminary results. 3.1 Cloud Environment
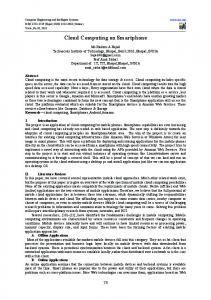
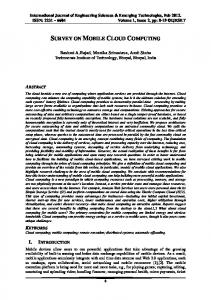
Figure 2. GeoEye-1 image from Goianésia. The first operation of the interpretation model is the distributed segmentation. A distributed version of the algorithm proposed in (Baatz and Shäpe, 2000) was used in the segmentation. There was no systematic parameter tuning for the particular application. The algorithm’s parameter values were determined empirically, and the following configuration was used: scale = 70, color weight = 0.5, compactness weight = 0.5, bands weight = 1,1,1,1. Figure 3 illustrates part of the segmentation outcome where different colors represent results from different processing elements.
The execution environment is a combination of commercial cloud services provided by Amazon Web Services (AWS). The auxiliary storage repository is provided by the Amazon Simple Storage Service (S3). The Amazon Elastic MapReduce (EMR) service was used to dynamically built and manage cluster of Amazon Elastic Compute Cloud (EC2) instances. The interpretation application was executed using two, four and eight m3.xlarge nodes to run InterCloud. These are 64-bit computers, with 15GB of RAM, 4 disks of 420GB and an Intel Xeon E5-2670 v2 processor containing 4 cores, operating at 2.5 GHz. Figure 4. Part of the distributed segmentation outcome. 3.2 Image We used a pansharpened GeoEye-1 image with 19404 by 21360 pixels, 0.5 m resolution and four spectral bands (Figure 2). The image has 3GB and covers an area of the municipality of Goianésia, in Goiás State, Brazil. The municipality has a population of 65,767; and is located 168 km from the state capital, Goiânia, and 265 km from the Brazilian capital, Brasilia. The site contains sparse urban areas intermixed with rural areas and natural patches of the Brazilian Cerrado biome. 3.3 Interpretation Model In the classification we considered 18 different land cover/land use classes of objects from rural and urban tarrgets: Asbestos, Asphalt, Bare Soil A, Bare Soil B, Beige Ceramic, Concrete Floor A, Concrete Floor B, Crops, Dark Ceramic, Gray Ceramic, Light Ceramic, Metallic A, Metallic B, Metallic C, Ploughed Soil A, Ploughed Soil B and Swimming Pool. InterCloud was configured to work with image tiles with 512 × 512 pixels totalizing 1677 tiles.
The next operation is the computation of feature values for each generated segment. Twenty-three features were considered in the classification: nineteen are spectral-based (Brightness, Mean value of bands 1, 2, 3 and 4, Maximum pixel value of bands 1, 2, 3 and 4, Minimum pixel value of bands 1, 2, 3 and 4, Ratio of bands 1, 2, 3 and 4, Division of mean value of band 4 by mean value of band 1, and Division of mean value of band 4 by mean value of band 3) and four are based on the segments’ geometry (Area, Angle, Compactness, Squareness, and Roundness). The last operation is the classification step. We collected sample segments for each object class, totalizing 919 samples. Then we created two sets of samples, one for training (with 172 samples) and the other for accuracy assessment (with 747 samples). Then, the distributed Decision Tree (C4.5) algorithm was executed.
3.4 Interpretation Results The main objective of the experiments reported here was to test the capacity of InterCloud to handle the whole interpretation execution. It is important to note that the same application could simply not be processed using other available interpretation tools like InterImage and eCognition, unless the input image was partitioned into smaller subsets. Figure 5 shows the processing times obtained from the interpretation execution on different number of computer nodes. Execution times of each step are shown: segmentation, feature extraction and classification. Image segmentation is clearly the most time consuming task, while the classification is the fastest one. The graph shows that the processing time decreases as the number of processing elements increases and demonstrates the scalability potential of the platform. The exception was the classification procedure, since it was so fast that there were no notable benefits in including additional processing power. Considering 4 nodes, we achieved a speedup of 1.57 and 1.92 for segmentation and feature extraction, respectively. For 8 nodes, speedups of 1.98 and 3.91 were obtained for the same tasks. The feature extraction shows better speedups due to its high parallelizable capability. The image segmentation suffers from dependencies among neighbouring segments, which hinders parallelization.
InterCloud is an open-source interpretation tool designed to work with computer grids. The experiments show that its distributed concept allows the execution of large images that cannot be processed with the common available tools. The results also demonstrate its scalability potential showing that the computational performance can be increased when more computer nodes are used. We note that this is an ongoing research, and what we showed in this paper are preliminary results. For future work, a better tailored image interpretation model will be designed. We intend to perform different segmentations for distinct groups of classes, and optimize parameter values for those groups. We will also exploit different classification methods and approaches. ACKNOWLEDGEMENTS The authors acknowledge the funding provided by FAPERJ (Carlos Chagas Filho Foundation for Research Support in Rio de Janeiro), CNPq (National Council for Scientific and Technological Development) and CAPES (Coordination for the Improvement of Higher Education). REFERENCES Ayma, V. A., Ferreira, R. S., Happ, P. N., Oliveira, D. A. B., Costa, G. A. O. P., Feitosa, R. Q., Plaza, A., Gamba., P., 2015. On the architecture of a big data classification tool based on a map reduce approach for hyperspectral image analysis, 2015 IEEE International Geoscience and Remote Sensing Symposium (IGARSS), Milan, 2015, pp. 1508-1511. Baatz M., Schäpe, A., 2011. Multiresolution Segmentation: an optimization approach for high quality multi-scale image segmentation, Angewandte Geographische Informationsverarbeitung XII, Heidelberg.
Figure 5. Execution times for each step of interpretation model. The classification obtained a global accuracy of 53% and a 0,50 Kappa value. Classification quality was not good basically because of the large number of classes, and because no special tuning of the segmentation parameter values was made. In order to improve these results, different segmentation runs could be performed for different group of classes. Additionally, some classes could be better classified using a structural, knowledge-based model, since we have better knowledge of their intrinsic characteristics. 4. CONCLUSION This work presents an interpretation application of a large remote sensing image executed over a cloud-computing environment. This application involves image segmentation, feature extraction and supervised classification. We use the InterCloud platform and its modules for this task.
Costa, G., Feitosa, R., Fonseca, L., Oliveira, D., Ferreira, R., Castejon, E., 2010. Knowledge-based interpretation of remote sensing data with the interimage system: major characteristics and recent developments. In: Addink, E., Van Coillie, F. (Eds.), GEOBIA. ISPRS Working Groups, Gent, Belgium, 2010. Ferreira, R. S., Oliveira, D. A. B., Happ, P. N., Costa, G. A. O. P., Feitosa, R. Q., Bentes, C., 2014. InterIMAGE 2: The Architecture of an Open Source, High Performance Framework for Automatic, Knowledge-Based Image Interpretation, In: International Geographic Object-Based Image Analysis Conference, Thessaloniki, 2014. Grabak, P., 2014. Sentinel-1 Mission Status. 15th Meeting of the International Ice Charting Working Group (IICWG). Happ, P. N., Ferreira, R. S., Costa, G. A. O. P., Feitosa, R. Q., Bentes, C., Gamba, P., 2015. Towards distributed region growing image segmentation based on MapReduce, 2015 IEEE International Geoscience and Remote Sensing Symposium (IGARSS), Milan, 2015, pp. 4352-4355. Hashem, I. A. T., Yaqoob, I., Anuar, N. B., Mokhtar, S., Gani, A., Khan, S. U., 2015. The rise of ‘big data’ on cloud computing: Review and open research issues, Information Systems, Volume 47, January 2015, Pages 98-115.
Lee, J., Kang, M., 2015. Geospatial Big Data: Challenges and Opportunities, Big Data Research, vol. 2, pp. 74-81, June 2015. Ma, Y., Wu, H., Wang, L., Huang, B., Ranjan, R., Zomaya, A., Jie, W., 2015. Remote sensing big data computing: Challenges and opportunities, Future Generation Computer Systems, vol. 51, pp. 47-60, October 2015. NASA EARTHDATA., 2015, EOSDIS Annual Metrics Reports [Online]. https://earthdata.nasa.gov/about/systemperformance/eosdis-annual-metrics-reports Zhang, L., Du, Q., and Datcu, M., 2015. Special section guest editorial: Management and analytics of remotely sensed dig bata, Journal of Applied Remote Sensing, vol. 9, no. 1, pp. 1-2, July 2015.