Terry Caelli, Li Cheng, Joan Fang, Ken Greenway, Dorothy. Lau, Omid Madani ... putational Learning Theory (COLT-00), pages 208â219, San. Fransisco, CA ...
Improving an Adaptive Image Interpretation System by Leveraging Lihong Li
Vadim Bulitko Russell Greiner Ilya Levner University of Alberta Department of Computing Science Edmonton, Alberta, Canada T6G 2E8 {lihong | bulitko | greiner | ilya}@cs.ualberta.ca
Abstract Automated image interpretation is an important task in numerous applications ranging from security systems to natural resource inventorization based on remote-sensing. Recently, a second generation of adaptive machine-learned image interpretation system (ADORE) has shown expertlevel performance in several challenging domains. Its extension, MR ADORE, aims at removing the last vestiges of human intervention still present in the original design of ADORE. Both systems treat the image interpretation process as a sequential decision making process guided by a machine-learned heuristic value function. This paper employs a new leveraging algorithm for regression (R ES L EV) to improve the learnability of the heuristics in MR ADORE. Experiments show that R ES L EV improves the system’s performance if the base learners are weak. Further analysis discovers the difference between regression and decisionmaking problems, and suggests an interesting research direction. Keywords: adaptive image interpretation system, leveraging for regression, boosting, sequential decision making.
1. Introduction Image interpretation is an important and highly challenging problem with numerous practical applications. Handcrafted image interpretation systems suffer from expensive design cycle, a high demand for human expertise in both subject matter and computer vision, and the difficulties with portability and maintenance. Over the last three decades, various automated ways of constructing image interpretation systems have been explored. A recent review can be found in [8]. One of the promising approaches to automatic acquisition of image interpretation systems lies with treating computer vision as a control problem over a space of image processing operators. Early attempts used the schema theory [2, 3]. While presenting a systemic way of designing image
interpretation systems, the approach was still ad-hoc in its nature and required extensive manual design efforts [10]. In the 1990’s the second generation of control policy based image interpretation systems came into existence. More than a systematic design methodology, such systems used theoretically well-founded machine learning frameworks for automatic acquisition of control strategies over a space of image processing operators. The two well-known pioneering examples are a Bayes net system [24] and a Markov decision process (MDP) based system [9]. The latter system ADORE (ADaptive Object REcognition) [9] and its extension MR ADORE (Multi-Resolution ADaptive Object REcognition) [20] learn dynamic image interpretation strategies for finding target objects in images. As with many vision systems, they identify objects in a multi-step process. The input is a raw image, and the output is an interpretation identifying target objects in the image; in between, the data can be represented as intensity images, probability images, edges, lines, or curves. The systems model image interpretation process as a Markov decision process, where the intermediate representations are continuous state spaces, and the vision procedures are actions. The goal is to learn a dynamic control policy that selects the next action (i.e., image processing operator) at each step so as to maximize the quality of the final interpretation. Instead of learning the policy directly, the system learns a value function as the heuristics for the MDP-based policy. In this paper we consider the problem of ensemble learning (in particular, leveraging [22]) in the context of MR ADORE. The task of recognizing tree canopies from aerial photographs (i.e., labeling pixels belonging to tree canopies in an input image) is used as the testbed. The rest of the paper is organized as follows. Section 2 reviews the requirements and design of MR ADORE, and then reports on the solution approaches employed to date. Section 3 gives a brief overview of the related work and the leveraging method employed in this paper. Section 4 presents and discusses the experimental results. Finally,
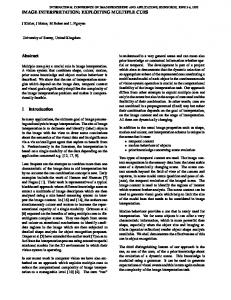
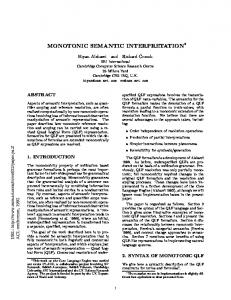
(a) Input image (b) Desired output Figure 1. The left image is an original photograph. The right one is the corresponding desired labeling provided by an expert as a part of the training set. Section 5 concludes the paper and points out some future directions. Figure 2. Data types (the boxes) and image processing operators (the arcs) in MR ADORE. Representatives of data tokens of each types are shown next to the nodes.
2. MR ADORE design MR ADORE was designed with the following objectives: (i) rapid system development for a wide class of image interpretation domains; (ii) low demands for subject matter, computer vision, and AI expertise on the part of the developers; (iii) accelerated domain portability, system upgrades, and maintenance; (iv) adaptive image interpretation wherein the system adjusts its operation dynamically to a given image; (v) user-controlled trade-offs between recognition accuracy and resources utilized (e.g., time required).
2.2. Learning control policies MR ADORE starts with the Markov decision process (MDP) as the basic mathematical model by casting the IPL operators as the MDP actions and the results of their applications as the MDP states. In the context of image interpretation, the formulation frequently leads to several challenges absent in the standard heuristic search/MDP domains such as the grid world, the 8 puzzle [23], etc. First, each individual state is so large (on the order of several megabytes), that we cannot use standard machine learning algorithm to learn the heuristic function. Selecting optimal features is a known challenge in itself. Second, the number of allowed starting states (i.e., the initial high-resolution images) alone is effectively unlimited for practical purposes. In addition, certain intermediate states (e.g., probability maps) have a continuous nature. Third, There are many image processing operators leading to a large branching factor; moreover, many individual operators are quite complex, and can take hours of computation time each. Lastly, goal states are not easily recognizable as the target image interpretation is usually not known a priori. This renders the standard complete heuristic search techniques (e.g., depth-first, A*, IDA* [19]) inapplicable directly. In response to these challenges, MR ADORE employs the following off-line and on-line machine learning techniques. First, we can use training data (here, annotated images) to provide relevant domain information. Each training datum is a source image, annotated by an expert with the desired output. Figure 1 demonstrates a training datum in the forestry image interpretation domain. Second, during the off-line stage the state space is ex-
2.1. Overview These objectives above favor the use of readily available off-the-shelf image processing operator libraries (IPL). However, the domain independence of such libraries requires an intelligent policy to control the application of library operators. Operation of such a control policy is a complex and adaptive process. It is complex in that there is rarely a one-step mapping from input images to their interpretations; instead, a series of operator applications are required to bridge the gap between raw pixels and semantic objects. Examples of the operators include region segmentation, texture filters, and the construction of 3D depth maps (see Figure 2 for a small example). Image interpretation is an adaptive process in the sense that there is no fixed sequence of actions that will work well for most images. For instance, the steps required to locate and identify isolated trees are different from the steps required to find connected stands of trees. Figure 3 demonstrates two specific forestry images that require significantly different operator sequences for satisfactory interpretation results. The success of MR ADORE therefore depends on its control policy: given an input image, how to select a sequence of operator to interpret the image most effectively and reliably ? 2
Figure 3. Adaptive nature of image recognition: two different input images require significantly different satisfactory operator sequences. Each node is labeled with its data type. Each arc between two data tokens is shown with the operator used.
3. Boosting and leveraging methods
plored via limited depth expansions of training images. Within a single expansion, all sequences of IPL operators up to a certain user-controlled length are applied to the training image. Since training images are user-annotated with the desired output, terminal rewards can be computed based on the difference between the produced labeling and the desired labeling. Then, dynamic programming methods [4] are used to compute the value function for the explored parts of the state space. We represent the value function as Q : S × A → R where S is the set of states (image tokens) and A is the set of actions (IPL operators). The true Q(s, a) computes the maximum cumulative reward the policy can expect to collect by taking action a in state s and acting optimally thereafter [26]. As the states are themselves very large, we first abstract each state s into a set of features f (s) using an abstraction function f (·). Then supervised machine learning extrapolates the sample values computed by dynamic programming on the explored fraction of the state space onto the entire space. Finally, when presented with a novel input image to interpret, MR ADORE first computes the abstracted version f (s), then applies the machine-learned approximation to the value function Q(·, ·) to compute Q(f (s), a) for each IPL operator a; it then performs the action a∗ = arga max Q(f (s), a). The process terminates when the policy executes action submit(hlabelingi) where hlabelingi becomes the system’s output.
Boosting is a powerful technique that can boost weak hypotheses to arbitrarily strong hypotheses [25]. This ability is called PAC-boosting property [13]. Boosting algorithms work by modifying training data to build different base hypotheses. At the end of training, these base hypotheses are combined to form a better final hypothesis. A well-known example is A DA B OOST [16] that has enjoyed a great success both in practice and in theory. A class of highly related techniques called “leveraging” work very similarly to boosting methods, except that they can often produce a better ensemble hypothesis, but cannot be guaranteed to have the PAC-boosting property [13]. Several boosting/leveraging methods have been developed and studied during the past decade [7, 11, 12, 14, 16, 15, 18]. Recently a simple and straightforward leveraging algorithm called R ES L EV (Figure 4) [21] has demonstrated the ability to improve the performance of a hypotheses by iteratively learning the previous ensemble hypothesis’ residuals (i.e., errors) of predictions on training data. Experiments on the Friedman datasets [17] indicate the algorithm’s effectiveness. Definitions: Given a set of training data S = {(x1 , y1 ), (x2 , y2 ), · · · , (xN , yN )} and a hypothesis h, the sample error of h on S is defined as: 3
on Q(·, ·), and relative reward of the produced labeling) were used for evaluation. Different sets of features (e.g., HSV-HISTOGRAM, RGB-MEAN, etc.) were extracted to abstract the states. Figure 5 shows the experimental results. For comparison, experiments with the random policy (i.e., the system randomly selects an operator to apply on the current token) were tried and an average relative reward of 26.3% was attained. Obviously, learning with each feature set increases the system’s performance: with good features (FEATURE-1), the average relative reward is increased to over 75%; even with non-representative features (FEATURE-2 and FEATURE-3), the average relative reward is over 44% and 48%, respectively. The diagrams also show that, the ensemble hypothesis tends to be better if the base hypotheses are weaker. For FEATURE-2, the generalization error decreases; for FEATURE-3, the relative reward increases. Decreases in sample/generalization errors can only be observed in the second case (Figure 5(2a)). This is very different from the results in [21], where both sample and generalization errors go down in each experiment. The phenomenon can be explained by further investigation of the results, which shows that condition (1) is frequently violated in the experiments with MR ADORE. With better regressors the condition will hold in most cases and the sample/generalization errors are expected to decrease, as Theorem 1 predicts. Candidates of such regressors include CART [5] and k-nearest neighbor [6]. Despite the relatively large increases of sample and generalization errors, the relative rewards either decrease by only a small amount (Figure 5(1b)(3b)), or even increase quite significantly (Figure 5(2b)). This interesting phenomenon suggests the difference between regression problems and decision-making problems: Claim: decision-making problems behave differently from regression problems in terms of boosting/leveraging methods applied to the value function. Ideally speaking, for a decision-making problem, if the regressor is good enough to learn the target function (here, Q(·, ·)) very well, with given training samples, then the generalization error approaches zero and the accumulative rewards or the control strategies tend to be optimal. Then decision-making problems tend to behave similarly to regression problems. But in many real world domains such as image interpretation, problems are usually complex and/or training data are often limited, both resulting in a relatively large generalization error of the final hypothesis. In such cases, as is shown in Figure 5, it is inappropriate to evaluate a hypothesis for decision making with the error measures usually used for regression. For this reason, other new boosting/leveraging methods incorporating error measures related to the overall performance of the decision-making system are to be developed.
ResLev (S, R, Tmax ) Input: A set of training samples S = {(x1 , y1 ), (x2 , y2 ), · · · , (xN , yN )}; A base regressor R; Maximum number of iterations Tmax 1. Initialize ensemble hypothesis H0 ≡ 0 2. For t = 1, · · · , Tmax Do (a) Apply R on S and produce a base hypothesis ht (b) Ht = Ht−1 + ht (c) Modify data in S: ∀i, yi = yi − ht (xi ) 3. Output final ensemble hypothesis HTmax
Figure 4. R ES L EV: Residual Leveraging N 1 X [yi − h(xi )]2 err c S (h) = N i=1 Let P be a probability distribution on the whole instance space, the generalization error of h with respect to P is defined as: errP (h) = EP [y − h(x)]2 where (x, y) is drawn randomly according to P. Theorem 1. Given any training set T = {(u1 , v1 ), (u2 , v2 ), · · · , (uM , vM )}, if the learner L produces a hypothesis h that satisfies M X i=1
vi2
>
M X i=1
(vi − h(ui ))2 = M · err c T (h)
(1)
then R ES L EV will reduce the sample error with the base learner L. [21] R ES L EV reduces sample error by repeatedly reducing the residuals of predictions over the training data. Assuming that the training data and test data are both drawn from an unknown distribution P, it is expected that a small sample error implies a small generalization error [1], provided that the ensemble hypothesis is sufficiently simple 1 .
4. Empirical evaluation We applied R ES L EV to learning the function Q(·, ·) in MR ADORE. Thirty two forestry aerial images with userannotated labeling were available in our experiments. Since the training data are quite limited, leave-one-out cross validation was used to evaluate the machine learning algorithm. In each run, one image was selected for testing while the other thirty one images were for training MR ADORE. Three measures (i.e., sample/generalization errors 1 The
risk of overfitting increases if a hypothesis is too complex.
4
0.85
0.085 0.083
0.83
0.079 Relative Reward
Sample\Generalization Error
0.081
0.077 train test
0.075 0.073
0.81 test 0.79
0.071 0.77
0.069 0.067 0.065
0.75 1
2
3
4
5
6
7
8
9
1
10 11 12 13 14 15 16 17 18 19 20
2
3
4
5
6
(1a) sample/generalization error with feature set #1 0.1
0.58
0.098
0.57
9
10 11 12 13 14 15 16 17 18 19 20
0.56 0.55
0.094 Relative Reward
Sample\Generalization Error
8
(1b) average relative reward with feature set #1
0.096
0.092 train test 0.09
0.54 0.53
test
0.52
0.088 0.51 0.086
0.5
0.084
0.49
0.082
0.48 1
2
3
4
5
6
7
8
9
1
10 11 12 13 14 15 16 17 18 19 20
2
3
4
5
6
7
8
9
10 11 12 13 14 15 16 17 18 19 20
Number of Base Hypotheses
Number of Base Hypotheses
(2a) sample/generalization error with feature set #2
(2b) average relative reward with feature set #2
0.15
0.6
0.145
0.58
0.14
0.56
0.135 0.54 Relative Reward
Sample\Generalization Error
7
Number of Base Hypotheses
Number of Base Hypotheses
0.13 train test
0.125 0.12
0.52 test 0.5 0.48
0.115 0.46
0.11
0.44
0.105 0.1
0.42 1
2
3
4
5
6
7
8
9
10 11 12 13 14 15 16 17 18 19 20
1
Number of Base Hypotheses
2
3
4
5
6
7
8
9
10 11 12 13 14 15 16 17 18 19 20
Number of Base Hypotheses
(3a) sample/generalization error with feature set #3
(3b) average relative reward with feature set #3
Figure 5. Experiments on MR ADORE using R ES L EV. Three sets of features are extracted to abstract the states, and two measures (i.e., sample/generalization error and average relative reward) are shown.
5
5. Conclusions and future directions
[8] B. Draper. From knowledge bases to Markov models to PCA. In Workshop on Computer Vision System Control Architectures (held in conjunction with ICVS), Graz Austria, March 2003. [9] B. Draper, J. Bins, and K. Baek. ADORE: Adaptive object recognition. In International Conference on Vision Systems, Spain, 2000. [10] B. Draper, A. Hanson, and E. Riseman. Knowledge-directed vision: Control, learning and integration. In Proceedings of the IEEE, volume 84, page 1625C1637. [11] H. Drucker. Improving regressors using boosting techniques. In D. H. Fisher, editor, Proc. Fourteenth International Conference on Machine Learning (ICML-97), pages 107–115. Morgan-Kaufmann, 1997. [12] N. Duffy and D. Helmbold. Leveraging for regression. In Proceedings of the Thirteenth Annual Conference on Computational Learning Theory (COLT-00), pages 208–219, San Fransisco, CA, 2000. Morgan Kaufmann. [13] N. Duffy and D. Helmbold. Potential boosters? In K.-R. M. Sara Solla, Todd Leen, editor, Advances in Neural Information Processing Systems (NIPS-99), volume 12, pages 258– 264. MIT Press, 2000. [14] N. Duffy and D. Helmbold. Boosting methods for regression. Machine Learning, 47:153–200, 2002. [15] Y. Freund and R. Schapire. A decision-theoretic generalization of on-line learning and an application to boosting. Journal of Computer and System Sciences, 55(1):119–139, 1997. [16] Y. Freund and R. E. Schapire. Experiments with a new boosting algorithm. In Proceedings of the Thirteenth International Conference on Machine Learning (ICML-96), pages 148– 156, 1996. [17] J. Friedman. Multivariate adaptive regression splines. Annals of Statistics, 19:1–141, 1991. [18] J. Friedman. Greedy function approximation: A gradient boosting machine. Technical report, Department of Statistics, Stanford University, CA, March 2000. [19] R. Korf. Depth-first iterative deepening : An optimal admissible tree search. Artificial Intelligence, 27, 1985. [20] I. Levner, V. Bulitko, L. Li, G. Lee, and R. Greiner. Towards automated creation of image interpretation systems. In the Sixteenth Australian Joint Conference on Artificial Intelligence (AI-03), Perth, Australia, December 2003. [21] L. Li. ResLev: A leveraging method for regression. Technical report, Department of Computing Science, University of Alberta, Edmonton, Alberta, Canada, July 2003. Available at http://www.cs.ualberta.ca/∼lihong. [22] R. Meir and G. R¨ asch. An introduction to boosting and leveraging. In S. Mendelson and A. Smola, editors, Advanced Lectures on Machine Learning, LNCS, pages 119– 184. Springer, 2003. [23] A. Reinefeld. Complete solution of the eightpuzzle and the benefit of node ordering in ida. In Proceedings of the Thirteenth International Conference on Artificial Intelligence (IJCAI-93), page 248C253, 1993. [24] R. Rimey and C. Brown. Control of selective perception using Bayes nets and decision theory. International Journal of Computer Vision, 12:173–207, 1994. [25] R. E. Schapire. The strength of weak learnability. Machine Learning, 5(2):197–227, 1990. [26] R. S. Sutton and A. G. Barto. Reinforcement Learning: An Introduction. MIT Press, Cambridge, MA, March 1998.
Future Work: Primary future directions include: (i) evaluating other regression algorithms so that the condition (1) in Theorem 1 can be satisfied and thus R ES L EV can be of help; (ii) modifying R ES L EV to improve its generalization ability, so that its variation has the PAC-boosting property, and can also work well with a real-world sequential decision maker such as MR ADORE; (iii) comparing the effectiveness of R ES L EV to that of other boosting/leveraging algorithms; (iv) developing new boosting/leveraging algorithms that directly optimize the overall decision-making performance as opposed to the regression error (such as sample/generalization errors) of the value function. Contributions: In this paper, we describe MR ADORE, a state-of-the-art adaptive image interpretation system. A new leveraging algorithm for regression is applied to learning the value function in the Markov decision-based system. Experiments show that, the ensemble hypothesis produced by R ES L EV results in improved decision-making performance if the base hypotheses are weak. More importantly, we show empirically that decision-making problems behave differently from regression problems. Therefore, new boosting/leveraging algorithms that directly optimize the overall decision-making performance are needed.
Acknowledgements Bruce Draper participated in the initial MR ADORE design stage. Terry Caelli, Li Cheng, Joan Fang, Ken Greenway, Dorothy Lau, Omid Madani, Rongzhou Man, David McNabb, and Guanwen Zhang have contributed in various ways. We are grateful for the funding from the Alberta Ingenuity Center for Machine Learning, the University of Alberta, and NSERC.
References [1] M. Anthony and P. L. Bartlett. Neural Network Learning: Theoretical Foundations. Cambridge University Press, Cambridge, 1999. [2] M. Arbib. The metaphorical brain: An introduction to cybernetics as artificial intelligence and brain theory. WileyInterscience, New York, 1972. [3] M. Arbib. Segmentation, schemas, and cooperative computation. In S. Levin, editor, MAA studies in Mathematics, pages 118–155. 1978. [4] A. G. Barto, S. J. Bradtke, and S. P. Singh. Learning to act using real-time dynamic programming. Artificial Intelligence, 72:81–138, 1995. [5] L. Breiman, J. Friedman, R. Olshen, and C. Stone. Classification and Regression Trees. Wadsworth, 1984. [6] T. M. Cover and P. Hart. Nearest neighbor pattern classification. IEEE Transactions on Information Theory, IT13(1):21–27, 1967. [7] T. G. Dietterich. An experimental comparison of three methods for constructing ensembles of decision trees: Bagging, boosting, and randomization. Machine Learning, 40(2):139– 157, 2000.
6