TELKOMNIKA, Vol.9, No.1, April 2011, pp. 1~8 ISSN: 1693-6930 accredited by DGHE (DIKTI), Decree No: 51/Dikti/Kep/2010
1
An Optimized Method of Partial Discharge Data Retrieval Technique for Phase Resolved Pattern 1.3
Eka Putra Waldi, 1.4Aulia, 1Ariadi Hazmi, 2Hairul Abral, 3Syukri Arief, 4M. H. Ahmad Department of electrical Engineering, 2Department of Mechanical Engineering, 3Department of ChemistryAndalas University. 25163 Padang, West Sumatra INDONESIA
1
4
Institute of High Voltage and High Current, Faculty of Electrical Engineering,Universiti Teknologi Malaysia, 81310 Johor Bahru, Johor, MALAYSIA.
[email protected]
Abstract The measurement of phase resolved partial discharge requires a gigantic memory capacity to store all the waves of the PD test results. This limitation eventually hinders the testing. It is necessary to optimize on the aspect of memory storage capability to reduce the storage requirements. In light of foregoing, the partial discharge data retrieval techniques with sampling rate methods were used to detect the peak of partial discharge as well as the PD constituent representatives. The optimization process was performed by using integration of oscilloscope and LabVIEW software. The partial discharge data recording can be easily confined to the points of the partial discharge occurrence only. As results, the storage points were reduced by taking wave magnitude associated with PD, thereby resulting in more representative data. Therefore, this optimized method was able to reduce the file size of the test results up to 99 percent of PD original size thereby decreasing the usage of hard disk storage. Keywords: partial discharge, phase resolved, sampling rate, peak detect, recording, LabVIEW. 1. Introduction Polyethylene is widely used in many electrical apparatuses and devices as high voltage insulating material due to its excellent electrical and mechanical properties. Usually, polymers are used together with other insulating material in high voltage insulation, such as air-polymer composite insulation. The dielectric strength of the air is less than that the polymer. Also, the discharge events probably start within the air and partially bridge the insulation between conductors with respect to the applied voltage. It is generally known as partial discharge (PD). The PD causes the progressive deterioration of polymer surface and eventually leading to the electrical breakdown to the alternating current (AC) apparatuses and devices [1]. The PD current activity is also influenced by the current generated from the source, whereby the greater the flow of resources, the higher the current of the PD. Likewise, under the environmental conditions such as the high humidity, the PD activity are affected enormously. The high humidity would accelerate the process of degradation. Furthermore, the repetition activities of PD at different dielectric values would also expedite the degradation process [1-3] and thereby generating a number of PD data. These PD data such as PD pattern could be a result of further condition monitoring and diagnostics of electrical equipment [5-7] such as medium voltage underground and overhead cables. There are two basic possibilities for recognition of PD. The first possibility is the time-resolved recognition for measuring the actual shape of the charge displacement within the defect in nanosecond scale. Literally, there is a direct relationship between the physic in the defect and shape of signal [8]. The second possibility is the phase related recognition. This method uses the classic discharge detector and the pattern that mostly occurs in 50 or 60 Hz sine wave or PD phase resolved (PDPR). The shape of single pulses is not relevant, only their relative high and phase angle are considered which the Time contant of PD conventional sensor (TSPDCS) should be in order of ~1 s [9-11]. Currently, the sampling rate speed of the analog-to-digital converter (ADC) could be in giga sampling per second (GS/s) and supported by very sophisticated real-time storage (RAM) Received May 9th, 2010; Revised August 3rd, 2010; Accepted August 16th, 2010
2
ISSN: 1693-6930
Figure 1 Testing and Imitation of PD setup using High Voltage Amplifier thereby attaining a PD pulse data and saving the data concurrently. A PD pulse is read by the data acquisition system (DAQ), in which requires a trigger value to store the PD data in a series of memory-related sequences with a reference magnitude or phase of PD. The raw PD data from the interfacing circuit were transferred into the computer memory, and data storage system for further analysis and also could be recalled as needed. [11-16]. As ADC speed increased rapidly, the ability of digital oscilloscopes is also increasing as well. Thus, the sampling rate can reach up to 20 GS/s and followed by a large record length [17]. These data were obtained from the reference in which the one-time collection of data can generate a data file of 40 MB. It is impossible to record all the PD data. If the data were recorded based on a time interval of one second in an hour, then the size of the data file would become 144 GB. Using a large sampling rate can read a PD peak precision. However, the amount of data (memory used) becomes large when the reading was followed by a wave of applications PD wave readings. So it takes a long time when transferring and storing data to a PC. This will make the interval between measurements to be great as well. Therefore, need to optimize sampling rate and optimizing the use of data to be stored. This could be a possible large size thus requiring data collection techniques and software help to overcome this problem. PD data storage at stochastic ways for a long time with a high sampling rate requires a large memory. This problem needs to be optimized so that the measurements can be carried out in a long time. In this research, the storage of PD measurement data is optimized by utilizing the oscilloscope capability in combination with the LabVIEW software to minimize the memory usage. 2. Research Method 2.1. PD measurement system. Figure 1 shows the schematic diagram of the experimental setup for PD measurement system was used. The 50 Hz AC voltage generated by a function generator (tektronik AFG3252 Arbitrary Waveform Generator) were amplified at 2000-fold by using the power amplifier (Model 20/20 C; Trek. Inst.) which was passed through the specimen. This high voltage amplifier derived from function generator was totally controlled by a personal computer (PC) via USB cable. The high voltage source were measured through the output signal voltage of high voltage source amplifier (with a ratio of 1: 2000 volts). PD pulses were detected by PD detector (Haefely Type 9231). Coupling-capacitor (Ck) was used as a voltage divider so that the voltage does not rise on the impedance of the PD. Before the PD detector was used, the calibration was done with a calibration signal charge (Haefely Type 9218) during the offline condition. PC controlled all the system under LabVIEW program. The dashed line in Figure 1 was referring to the calibration instruments during the offline state. It could be done as imitation from the PD signal in which possess the same magnitude with the programmed PD from the arbitrary function generator. Dotted line rectangular in Figure 1 is part of the PD calibration that should be done at the time of measurement equipment in the off state. Calibration is an imitation of PD event that
TELKOMNIKA Vol. x, No. x, Bulan 201x : first_page – end_page
TELKOMNIKA
ISSN: 1693-6930
3
(a)
(b) Figure 2 Phased resolved PD simulation, (a) voltage application and imitation of PD, (b) one of imitation PD waveform. has the same magnitude at each event. PD calibrator is an imitation of a real PD events. PD calibrator consists of a capacitor and a pulse source, usually it works in one polarity to the distance between pulses is constant. Besides these ways, PD calibrator can also be done with the help of the arbitrary function generator in combination with the LabVIEW software. PD magnitude and location of the incident is very random so it is hard to determine the value of the benchmark PD. This will significantly affect the level of efficiency of reading the number and magnitude of PD. By using the arbitrary function generator, value and pulse phase position as constituting an imitation PD can be determined, even the number of PD on any positive polarity voltage sources or the negative polarity can be programmed simultaneously. If the number and the peak value PD is already known at each polarity wave source, then the efficiency of the number of PD readings per phase and the peak value can be calculated. Examples of imitation PD measurement results are shown in Figure 2a. In this Figure, there are 30 PD pulses for each positive and negative polarities, whereas PD waveforms are shown in Figure 2b. PD signal measurements were performed using cylinder-plate electrodes. The diameter of the conductor cylinder and the diameter of the conductor plate was approximately 0.5 cm and 5 cm respectively. Polymer films were placed on the conductor plate, and cylinder electrodes were placed over the film at a given gap. The length of the gap between the polymer surface and the cylinder tip was approximately 0.01 mm. Also, two types of connectors were used. The first was the connector Number 1, where the cylinder was connected to the high voltage electrode and the ground conductor plate. The second connector was linked in a way opposite to the first connector, where the conductor-cylinder connected to ground, and the conductor plate was connected to the high voltage. The LDPE film with the thickness 80 µm was placed on the grounding electrode. 2.2. General concept. Figure 3 shows the reading of the corresponding PD voltage waveform. Where is composed of two parts, the first part is a function of the oscilloscope, where the analog signal is converted to a digital system. Most of the generated data (record length) depend on the value of
Title of manuscript is short and clear, implies research results (First Author)
4
ISSN: 1693-6930
Figure 3 Analog to digital PD waveform synchronization process
(a)
(b) Figure 4 PD measurement at 200 MS per second sampling rate, (a) voltage application and (b) Suitable PD data the selected sampling rate, so that the characteristics of the sensor are required as a reference for determining the value of the selected sampling rate. The second is the determination of the value of PD magnitude. It is analyzed with phase corresponding to the program logic so that only the PD magnitude and phase values (PD phase of occurrence and PD magnitude) are saved on the PC. Communication between oscilloscope and the PC is using the TCIP in which serves as the acquisition control and data delivery starter. The digitalization process of partial discharge is detecting the peak value obtained from the PD sensor (Haefely type 9231) can be read by using oscilloscope Tektronix DPO 5104. The oscilloscope also functions as the interface for LabVIEW software to control the measuring unit and to process the signals after the digitization processed has finished. The analog to the digital process of sampling rate is required to get the optimum performance of tool so that the
TELKOMNIKA Vol. x, No. x, Bulan 201x : first_page – end_page
TELKOMNIKA
5
ISSN: 1693-6930
Figure 5 PD process from analog to digital, (a) analog signal and (b) digital signal 140
Effisiency Detection of PD peak (%)
120
100
80
Ability of Sampling rate to read more than 90% PDmax
60 Negative polarity Positive polarity
40
20
0 1000000
10000000
100000000
1000000000
10000000000
Sampling rate (sample/sec)
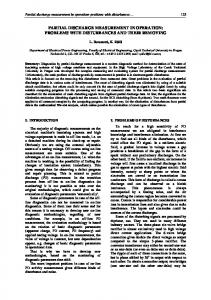
Figure 6 Detection efficiency of PD number per phase function of sampling rate repeatability of PD (looping) measurements does not take a long time. This process is divided into two parts, namely prose digitization, and signal processing. Figure 4a depicts a voltage source signal in the form of sine wave obtained from the voltage probe, whereas Figure 4b illustrates the PD pulse-shaped signal obtained from the PD detector. Both of these signals are synchronized in time. There were several events of PD during the first wave of the voltage source. The sampling rate was 200 MS/second. Figure 5 shows the assumption of a waveform that is on the small dotted box from Figure 2. To get the perfect waveform, a high sampling rate was used. In this study, a sampling rate of 10 GS/s was used. By taking the peak value of a pulse, the pulse magnitude value at 90% and the maximum value (peak) was measured as shown in Figure 5(a). Value above 90% of the maximum magnitude of pulse waveform of the first and second half-cycle has a period of time along line AB, which states the value of SR = 1 / AB is called the peak sampling rate of 90% (90% SR). The digital signal processing is a process to obtain a digital data from the analog signal by sampling the analog signal discretely under the period or frequency sampling domain. The Nyquist theory provides the rule that the frequency sampling should be at least two times the maximum frequency of the related signal or half of the signal period. The maximum value of sampling period (time between point A and B) should be equal to 0.5 of the period in order to achieve the value above 90% of the peak magnitude. Then, the digitized values are the intersection between the signal curve and the Nyquist period that are seen as the vertical dashed lines in Figure 5 (b). Although the peak of PD signal has been detected using a sampling technique based on Nyquist theory. However, another signal can also be detected instead of the real peak of PD during the detection process that can cause the PD signal to be counted more than one pulse, resulting in an incorrect value. In the actual measurement, the unwanted signals cannot be avoided. Thus, it is crucial to verify the measured signals that can be performed using LabVIEW. LabVIEW is software with the buildup functions that can be used to detect the peak value of a wave counted as the PD signal in the process of reading the data from the oscilloscope. If any, some additional logic function is required to enable the LabVIEW for
Title of manuscript is short and clear, implies research results (First Author)
6
ISSN: 1693-6930
(a)
(b) Figure 7 Partial discharge phase resolved for (a) connection type-1 and (b) connection type-2 Table 1 The Performance of PD from different connection types Connection Connection PD quantities type-1 type-2 Maximum PD 1280.64 8.6 positive (pC) Maximum PD -870.505 12.4 negative (pC) Number of PD 7317 10138 positive Number of PD 5668 10686 negative
recognizing the nature of PD signal and PD phase-resolved. 3. Results and Analysis 3.1. Reading the error of the difference value of sampling rate with the dummy PD signal PD waves were detected by the sensor under the PD duration approximately to one microsecond, whereas 90% of the peak value of SR is not more than 10% of the time duration PD. To get a peak value above 90% SR, it was ascertained first whether the sensors have detected all PD events, in other words the number of PD readings per phase voltage must be TELKOMNIKA Vol. x, No. x, Bulan 201x : first_page – end_page
TELKOMNIKA
ISSN: 1693-6930
7
accurate. The next step was to detect how many peak values that was equal to or bigger than 90% SR. To get better results at a value equal to or bigger than 90% of SR in the determination of sampling rate, it is necessary to know the ability of an oscilloscope to read the magnitude PD detected by the sensor. This was done by measuring the PD pulse imitation that consists of 30 pulses PD at each positive and negative polarity. Data collection was performed ten times for each additional measurement sampling rate. Tested sampling rate ranging from 2 MS/s up to 1.25 GS/s. Figure 5 shows the average efficiency readings number every single PD voltage waveform application (one cycle), it appears that the efficiency of the average readings PD imitation amount worth 100% at a sampling rate of at least 10 MS per second. In this paper, the sampling rate used two time or more, as 25 MS persecond. If this sampling rate using on voltage source with 50 Hz, it can record data are 500,000 point, and data for PD in one wave aplication have the maksimum around 100 point. Further more, the data record to PC can reduce up to 99%. 3.2. Application of PD measurements with different connectors PD readings with 25 MS/s sampling rate for a frequency of 50 Hz required 0.4 million points, whereas the measuring capacity of the oscilloscope was up to 25 million points. Therefore, the waves were read in real time as much as 62.5 waves. In this study, the mapping of the PD events was only for one second (50 waves) at intervals of four seconds. PD data retrieval has not been captured for a single time only, but it was captured repetitively. Storing all PD data requires a gigantic storage system but this process is almost impossible to be realized. To solve this problem, capturing and storing the PD data could be done randomly at certain time intervals [8, 11-13, 17]. Given the limitations of existing memory, it is necessary to capture only the PD related waves to reduce the use of larger memory without losing up the valuable information of PD parameters. The LabVIEW software, in this case, with its available features, can reduce the file size of the test results. Fig. 9a and 9b show the charge magnitude as a function of phase angle for connection type-1 and connection type-2 respectively. The PD data was stored on a PC in 50 cycles of the alternating voltage source. The PD measurement has resulted in two different types of connectors possessed the same patterns. In the positive polarity, PD activities have occurred at zero phase angle of the voltage application. It also occurred at a negative phase angle, but the magnitude of PDs have remained at positive values. PD activity was preceded by a charge carrier (CC) injection in the air, where molecules were ionized by the CC and amplified by the high electric field enhancement. The possibility of the existence of the CC at the high electric field was derived from the ionization of air molecules, but the process very complicated. Also, CC obtained from the electrode. This CC could distort the shape of the electrode. It was also verified in this experiment that the tip of the needle electrode was deformed by a discharge [8]. One reason for the significant increase in the PD pulse discharge time was due to the spread out of charge distribution on the surface of the specimen. Connection type-1 was a cylindrical conductor that was connected to a high voltage source. Also, the plate electrode was connected to ground, where the CC was dominant at the positive polarity. Thus, the maximum positive PD (MPDP) value was greater than the maximum negative PD (MPDN) value. Also, followed by the number of positive PD (NPDP) was higher than the number of negative PD (NPDN). Meanwhile, the connection type-2 was a cylindrical conductor connected to the ground conductor plate, then the plate was connected to the sources thereby resulting in the CC accumulated at the negative polarity part. Therefore, MPDP value was smaller than MPDN value. Likewise, NPDP value was lower than the NPDN value as shown in Table 1. 4. Conclusion As a conclusion, acquisition peak optimization conducted with PD decision-wave results has been successfully carried out. By taking wave magnitude associated with PD, it may reduce the storage point and thereby resulting in more representative data. Therefore, by designing a LabVIEW program features, it was able to reduce the file size of the test results up to 97 percents of PD original size thereby decreasing the usage of hard disk storage.
Title of manuscript is short and clear, implies research results (First Author)
8
ISSN: 1693-6930
ACKNOWLEDGMENT This research was supported by Direktorat Jendral Pendidikan Tinggi, Kementerian Pendidikan Nasional, Penelitian Hibah Fakultas Teknik Tahun anggaran No. 030/UN.16/PL/HT/2014, Indonesia References: [1] [2] [3] [4]
[5]
[6] [7]
[8] [9] [10] [11] [12] [13] [14]
[15] [16] [17]
P.H.F. Morshuis. Degradation of solid dielectric due to internal partial discharge: some throughts on progress made and where to go now. IEEE Transaction on dielectric and electrical insulation. 2005;12(5):905-913 Eka Putra Waldi. Influence of Partial Discharge on Breakdown of Air-Polymer Composite. IEEE International Conference on Condition Monitoring and Diagnosis (CMD). Bali. 2012; 791-974 Waldi E.P. Murakami Y. M. Nagao. Effect of humidity on breakdown of low density polyethylene film due to partial discharge. International Conference on Condition Monitoring and Diagnosis. Bali,2008:655 – 658 Eka Putra Waldi, Yoshinobu Murakami, Naohiro Hozumi and Masayuki Nagao. Breakdown of Air-Polymer Composite Insulation due to Partial Discharge and Influence of Thermal Insulation. IEEJ Transactions on Fundamentals and Materials. 2012;132 (11):1039-1044. Miofen Zhu, Guojin Chen, Ming Xu, Tingting Liu, Dong Xie and Yanping Zhang. Study and Monitoring System for Partial Discharge of lectrical Equipment. Telkomnika Indonesian Journal of Electrical Engineering, 2009;12:1273-1283. Hung-cheng C, Feng-chang G and Chun-yaao L, A. New method base on extension theory for partial discharge pattern recognition. WSEAS TRANSACTIONS on SYSTEM. 2008;12(7):1402-1411 Elpidio R and Teresa M.D. Lean maintenance model to reduce scraps and WIP in manufacturing system: case study in power cable factory. WSEAS TRANSACTIONS on SYSTEM 2013;12(12):650-666. P. H. F. Morshius and F. H. Krueger: "Transition from streamer to townsend Mechanism in Dielectric Void", J. Phys. 1990:23:1562-1568. F. H. Kreuger, E. Gulski and A. Krivda. Classification of Partial Discharge. IEEE Transaction on Dielectrics and Electrical Insulation, 1993;28(6):917-983. E Gulski. Computer-aided Measurement of Partial Discharge in HV Equipment. IEEE Transaction on Dielectrics and Electrical Insulation, 1993:28(6): 969-983 E. Gulski. Digital Analisis of Partial Discharge. IEEE Transaction on Dielectrics and Electrical Insulation, 1995:28(6):822-837. Paul Seiitz. Permanent Digital Recording of PD impulse in an Impulse analyzer. Proc. 5th Haefely Symp., Stutgart, 1992 G. C. Montanari, A. Contin and A. Cavalini. Random Sampling and Data Processing for PD-pulse Height and Shape Analysis. IEEE Transaction on Dielectrics and Electrical Insulation, 2000; 7(1):30-39 A Cavalini, A. Contin and G. C. Montanari. Advanced PD Interface in On-Field Measurement. Part I: Noise Rection. IEEE Transaction on Dielectrics and Electrical Insulation, 2003;10(2):216-224 Ardila-Rey, J.A.; Martinez-Tarifa, J.M.; Robles, G.; Rojas-Moreno, M.; Albarracin, R..A Partial Discharges acquisition and statistical analysis software. Instrumentation and Measurement Technology Conference. 2012 ;1670-1675. J Tang, J Zhou, X Zhng and F Liu. A transformer Partial Discharge Measurement System Based on Fluorescent Fiber. Energies, 2012; 490-1502. T Okamoto, H Suzuki, N Hozumi and M Ikeda. Partial Discharge Endurance Life of Polymer Insulating Materials at High Temperature. Electrical Engineering in Japan, 1999;126(1):15-22.
TELKOMNIKA Vol. x, No. x, Bulan 201x : first_page – end_page