reconstruction algorithm for both transmission and emission reconstructions is ... numerical experiments using natural pixels for a tomography application were ...
IEEE TRANSACTIONS ON NUCLEAR SCIENCE, VOL. 43, NO. 1, FEBRUARY 1996
295
An SVD Reconstruction Algorithm Using a Natural Pixel Represen tation of the Attenuated Radon Transform Grant T. Gullberg, Member, ZEEE, Yu-Lung Hsieh, and GI. Larry Zeng, Member, ZEEE
Abstract-The purpose of this work was to investigate the use of natural pixels to reconstruct attenuation corrected emission data using attenuation factors calculated from a natural pixel representation of the reconstructed transmission data. The reconstruction algorithm for both transmission and emission reconstructions is based on the assumption that a continuous image can he obtained by hackprojecting the discrete array q, which is the least squares solution to M q = p , where p is the array of discrete measurements. The M matrix represents the operator obtained from the hackprojection operator followed by the projection operator using the natural pixel basis. A singular value decomposition was used to solve the equation Mq = p , and the final image was obtained by sampling the continuous backprojection of the solution Q at a discrete array of points. Computer simulations showed that accurate attenuation corrected reconstructions could he obtained using a natural pixel representation of the attenuated Radon transform for a variable attenuator.
I. INTRODUCTION
P
RELIMINARY computer simulations have shown that the accuracy and precision of reconstructions from projections are improved for certain conditions using a natural pixel basis rather than using a square pixel image basis. It has been observed that the use of a natural pixel basis improves the accuracy and the image quality of reconstructions from truncated projections [I]. It has also been observed [2] that the reconstruction of exponential Radon projections [3], [4] is improved using the combination of a natural pixel model and SVD reconstruction. This work demonstrated that the use of a singular value decomposition (SVD) expansion with a natural pixel basis is less noise sensitive than using an SVD expansion based on the conventional square pixel image representation, or using the convolution backprojection reconstruction algorithm. The purpose of the work presented in this paper was to generalize the natural pixel representation from that of a constant attenuator (the exponential Radon transform) to a variable attenuator (the attenuated Radon transform [5]) and to evaluate the use of natural pixels to reconstruct attenuation corrected emission data using attenuation factors calculated from a natural pixel representation of the reconstructed transmission data. Manuscript received November 15, 1994; revised November 3, 1995. This work was supported in part by NIH Grant R 0 1 HL 39792 and Picker Intemational. The authors are with the Department of Radiology, University of Utah, Salt Lake City, UT 84132 USA. Publisher Item Identifier S 0018-9499(96)01908-9.
The natural pixel basis is a decomposition of the x-y plane into a set of overlapping pixels that are strip functions uniquely defined by the paths of all projection rays. The natural pixels are the supports for the characteristic functions XJm(r)[6], which arise quite naturally to describe the scanning geometry without digitizing the image. The first numerical experiments using natural pixels for a tomography application were reported by Natterer [7]. The term “natural pixel” was first. coined by Bunonocore et al. [8], who proposed the application of natural pixels in the reconstruction of xray CT images because the pixels arise naturally out of the geometry of the x-ray beam paths used to measure the projections. The natural pixel basis is a set {Xjm(r)} of characteristic functions with supports corresponding to ray paths of finite width from which the data measurements for angle m and projection bin j are generated. The integral of the function f over the set of all natural pixels defines a mapping from an infinite-dimensional function space into a finite-dimensional vector space [‘>I-[ 113. The integral over a natural pixel basis function defines a functional FJm that relates the unknown function f to the measured value gjm. The linear inverse problem with the discrete measurements { g j m } is to find a function f such that for a set {F”} of linear functionals F j m ( f ) = gj7n. In the work of Buonocore et al. [8], the function f was the distribution of linear attenuation coefficients; functionals provided the measurement from x-ray beam paths of internally emitted photons passing through the object and being detected by a finite set of detectors. It was claimed that the natural pixels better model the reconstruction of the image distribution than the nonoverlapping square pixel basis because natural pixels produce an optimal solution that incorporates the discrete form of the measurements. Using natural pixels requires that the reconstruction be formulated as a least squares solution in projection space such that the projection of the backprojection of the solution is close to the rneasured projections. The algorithm is based on the assumption that a continuous image can be obtained by backprojecting the discrete array q, which is the least squares solution to Mq = p , where p is the array of discrete measurements and the M matrix represents the composite operator of the backprojection operator followed by the projection operator. Previously in [ 11 an iterative conjugate gradient algorithm was used to solve for q. In this paper as in [2] an
0018-9499/96$05.00 0 1996 IEEE
IEEE TRANSACTIONS ON NUCLEAR SCIENCE, VOL. 43, NO. 1, FEBRUARY 1996
296
SVD approach was used to solve for q by inverting the matrix M instead of using an iterative algorithm. This paper first defines the attenuated Radon transform, defines functionals of the attenuated Radon transform corresponding to projections along natural pixels for a twodimensional parallel beam geometry, and then defines projection and backprojection operations. Expressions are given to calculate the elements of the M matrix, which is obtained from the composite of the backprojection and projection operators. Computer simulations are performed using the SVD to solve the equation M q = p for attenuation and emission distributions, and the final images are obtained by sampling the continuous backprojection of the solution q at a discrete array of points.
/ D Circular Support
11. THEORY
A. Attenuated Radon Transform The attenuated Radon transform [5] mathematically represents the measured projections in single photon emission computed tomography (SPECT) for an ideal detector with an ideal geometric response and no detected scattered photons. Let p be the radionuclide concentration function and p be the attenuation coefficient distribution, then the attenuated Radon projection operator A for a variable attenuator is defined at projection angel Om and spatial sampling E as
x
6 ( [
-
( 8 , . r)) dr
(1)
I
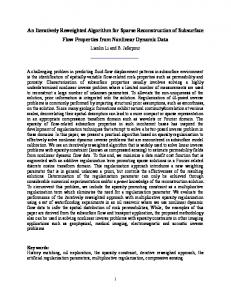
Fig. 1. The projection samples AJm(p)are formed by integrating the attenuated Radon transform over natural pixels x J m as defined in (2). The attenuation factor is shown to be the exponential of the line integral of the attenuation distribution from the point r.
natural pixel in Fig. 1 with indexes j , m. Thus, the projection operation maps the continuous function p into a vector p , of measurements AJ" ( p ). The backprojection operator A* operates on a vector q' with elements qjlml giving
m'
j'
x exp{-/p(s')6((8,!
where the integral over r is usually restricted to a finite support. The unit vector 8 , is defined as 8 , = (-sin Om, cos e,) where ,8 is the projection angle. Equation (1) defines a mapping A : p -+ Ap for a variable attenuator p. B. Natural Pixel Representation
The natural pixels are the basis set { x J m ( r ) of } characteristic functions. One natural pixel is shown in Fig. 1 with , r is a vector in the x-y characteristic function x j n t ( r ) where plane. The functions are one for r in the strip corresponding to the angle m and the projection bin j , and zero otherwise. For the attenuated Radon transform, the integral over each natural pixel defines a functional AJmthat relates the unknown continuous function p to the measured value Aj" (p). The functional AJmfor the attenuated Radon transform is defined as:
(3)
A* maps a projection vector into a continuous function so that the value at the position r in Fig. 2 is the summation of the elements qjtm/ corresponding to natural pixels xjr,! weighted by the attenuation factor given by the exponential term in (3). Combining the expressions for the projection operation in ( 2 ) and the backprojection operation in (3), we see that the backprojection-projection operator gives a real number for each functional Ajm A?, (A*n')
x exp
x dr.
where the integral over r is restricted to a finite support D (Firr. 1) and x;, is the characteristic function for the
. r ) - (8,) . s ' ) ) d s ' ) .
r
{ -j)(s')h((Bm/
. r) - (Om/ . s')) ds'
}
(4)
The matrix Me is defined to have elements given by the integral over r in (4). All integrals are restricted to the circular
GULLBERG et al.: AN SVD RECONSTRUCTION ALGORITHM USING A NATURAL. PIXEL REPRESENTATION
cir
L
a
a
291
\
q.,,m,, exp 1 - j ((s") ~ 6 ( ( 9 , . c)
-
(em,..
(s"))
dg"}
Fig. 2. The backprojection at r defined by (3) is the exponential weighted sum of the projection values qJJmt over those natural pixels for which r is an element.
Fig. 3. The elements ; L , M are approximated by summing up the exponential factors in (6) over subpixels within the intersection of two natural pixels. The line inlegral in each exponential argument originates from the central point of the subpixel and proceeds to integrate along the line parallel to the j'm' natural pixel for one factor and along the line parallel to the j m natural pixel for the other factor.
support D. The subscript "e" is used to denote the matrix used for the attenuation corrected emission reconstruction as opposed to the one used for the transmission reconstruction, which has a subscript 't'. the argument off each factor originates from the central point The variable attenuation distribution p ( s ) is expressed in of a subpixel, shown in Fig. 3 to be within the overlapped terms of natural pixels area of the two natural pixels. Each line integral corresponds to a sum of line lengths across the natural pixels weighted by the corresponding gamma values. For m", the integral over the natural pixels X j t j m / f is obtained by summing over j" the yjt/,tl and multiplying by the ratio 1/1" of the lengths shown where in practice the coefficients yjtr,t/ are obtained from the in Fig. 3. For overlapped areas on the boundary of the support, least squares reconstruction of transmission data. Substituting the subpixel is included in the sum only if the center of the (5) into (4), we have the elements of the matrix Me subpixel lies within the support. If the central point of the subpixel lies on the circular support boundary D or is totally ;E. Me outside the finite support, its contribution is assigned a value of zero.
111. METHODSAND RESULTS A. Methods
where integration is restricted to the circular support D. It is difficult to evaluate ;E, M in (6) because in general one does not have an analytical expression for the attenuation distribution. Instead the attenuation distribution in the exponential factors is expressed in a natural pixel representation as a backprojection, which would presumably be the backprojection of yj~,,) or yjiirmiir estimated from transmission data. In our implementation the integration is evaluated by summing up a finite number of exponential factors where the line integral in
The attenuation corrected reconstruction algorithm using the natural pixel representation is based on the assumption that a continuous image of the emission distribution can be obtained by backprojecting the discrete array q,, which is the least squares solution to Meq, = p,, where the subscript e refers to the emission reconstruction, p , is the array of discrete measurements, and the matrix Me represents the composite operator of the backprojection-projection operator in (4). A SVD is used to solve the equation Meq, = p , , and the final image is obtained by sampling the backprojection of the
298
IEEE TRANSACTIONS ON NUCLEAR SCIENCE, VOL. 43, NO. 1, FEBRUARY 1996
projected emission counts of 217644 and 217982 with and without Poisson noise. The following summarizes the steps used in the reconstruction procedure: Trunsmission Problem: Evaluate the matrix Mt. The elements Mt are (&+I - Cj)(&/+I - E j i ) / I sin Smfm1, except at the circular boundary [2]. There the expression is normalized by the area within the circular boundary. Use the SVD to solve
3%,
Mtqt = Pt
(7)
which is equivalent to solving
The solution qt is backprojected only for display purposes using (3) with p = 0. Emission Problem: Evaluate the matrix Me using (6). ~ qt obtained in Step 2 are used The elements y j ~ , of to calculate the sums in the exponentials of (6). Use the SVD to solve
which is equivalent to solving
Use (3) to backproject the solution qe to obtain the attenuation corrected emission reconstruction. The reconstmcted transmission sinogram qt was obtained using 600 singular value terms of the matrix Mt. This result (b) Fig. 4. Computer simulation phantom. (a) The attenuation phantom has was backprojected and sampled on a 32 x 32 grid to obtain attenuation coefficients of 0.15 cm-l, 0.28 cm-l, and 0.05 cm-' in the the reconstructed attenuator used only for display. The retissue, spine, and lung regions, respectively.The outer boundary was an ellipse constructed emission sinogram qe was obtained using 1100 with major axis of 30 and minor axis of 24. (b) The emission phantom is a uniform circular disk with diameter of 9 pixels positioned vertically off-center and 1240 singular value terms of the matrix Me for noisebut contained within the attenuator. free and Poisson noise simulations, respectively. Note that Me is different for the two cases. In the noise-free case the elements of Me are calculated from (6) using a noise-free solution qe at a discrete array of points. The elements of Me reconstructed transmission sinogram qt, whereas in the noise are determined by numerically calculating (6). case the elements are calculated using a noisy reconstructed A computer simulation was performed that used the phan- transmission sinogram. The attenuation corrected emission tom in Fig. 4 to evaluate the reconstruction, using a natural reconstruction was obtained by sampling the backprojection pixel representation of the attenuated Radon transform for of qe on a 32 x 32 grid. a variable attenuator. The projections were sampled from For the reconstructed transmission sinogram, 600 singular analytical integrals of the source in Fig. 4(b), attenuated by values were selected for the expansion to reconstruct qt the attenuator shown in Fig. 4(a). For each projection bin, 100 by qualitatively evaluating single-to-noise, resolution, and ray integrals were sampled and the sum was averaged to obtain accuracy in reconstructed images for various numbers of the projection value for that bin. Sixty-four projection angles singular values in the expansion. The exact number was not were sampled over 360°, with each projection containing 32 very precise in that these image quality parameters appeared projection samples. For the simulations with noise, Poisson stable over a wide range of singular values from 900 and noise was added to the simulated projections. The flux of the up to 1500. For the noise-free emission reconstruction, 1120 transmission source was 4000 counts per projection bin, to give singular values were selected. For the noise case, this same a total transmitted counts of 1.47041 x lo6 and 1.47248 x lo6 number was not necessarily applicable because the matrix Me with and without Poisson noise, respectively. The emission was modified by adding noise to the transmission data. For source had a concentration of 300 counts/pixe12 for a total this case the number of singular values used in the expansion
299
GULLBERG et al.: AN SVD RECONSTRUCTIONALGORITHM USING A NATURAL PIXEL REPRESENTATION
Singular Value Index
Fig. 5. The spectrum for the singular value decomposition of the matrix Me for natural pixel basis. The square root of the singular values are plotted as a function of index number. The spectrum is nowhere zero but approaches a small value of 3 x
was modified from 1120 to 1240 to obtain an overall best resolution, accuracy, and noise result.
B. Results Fig. 5 plots the spectrum of the singular value decomposition of the matrix Me using natural pixels. The spectrum but does not go to approaches a small number of 3 x zero. The spectrum for the matrix Me where the elements were calculated from a noisy reconstructed sinogram qt was very similar. Also, this spectrum did not go to zero, but approached a small number of 9 x lOW5. Fig. 6 shows the results without noise of the transmission and attenuation corrected emission reconstructions using a natural pixel representation of the attenuated Radon transform. An image of the reconstructed sinogram qt for the nonuniform attenuator is shown in Fig. 6(a). This is obtained by using the first 600 singular value terms of the matrix Mt. This result was backprojected and sampled on a 32 x 32 grid to obtain the reconstructed attenuator in Figs. 6(b) and 6(c). The attenuation corrected emission reconstruction is shown in Fig. 6(d). The reconstructed emission distribution was obtained by sampling the backprojection of qe on a 32 x 32 grid. The reconstructed emission sinogram qe was obtained using the first 1100 singular value terms of the matrix Me. The elements of Me were calculated from (6) using the reconstructed transmission sinogram qt. The average value within the reconstructed emission region was 304.2500f3.7851, which was fairly close to the value of 300 for the true phantom. Fig. 7 shows the results of reconstructing the attenuation distribution from noise-free projections and reconstructing the attenuation corrected emission distribution from noisy emission projections, using the noise-free reconstructed transmission sinogram qt to correct for attenuation. The sinogram qt for the nonuniform attenuator in Fig. 7(a) was obtained by using 600 singular value terms of the matrix Mt. The attenuation corrected emission reconstruction in Fig. 7(d) was obtained by sampling on a 32 x 32 grid the backprojection
of qe, which was obtained using 1100 singular value terms of the matrix Me. The average value within the reconstructed emission region was 303.8188 f 4.8410. As expected the reconstructed variance increased over that of the noise-free reconstruction in Fig. 6. Fig. 8 shows the results of the reconstructed attenuation distribution with noise and attenuation corrected emission reconstruction with noise. The sinogram qt for the nonuniform attenuator in Fig. 8(a) was obtained by using 600 singular value terms of the matrix Mt. The attenuation corrected emission reconstruction in Fig. 8(d) was obtained by sampling on a 32 x 32 grid the backprojection of qe, which was obtained using 1240 singular value terms of the matrix Me. The average value within the reconstructed emission region was 301.6625 f6.4569 for the natural pixel model. By adding noise to the transmission data, the reconstructed variance increased over that of the reconstructions in Fig. 7 due to the propagation of statistical errors through the calculation of the matrix elements for M e . The spectrum of Me for the natural pixel basis did not go to zero for either the noise-free or the noisy simulations. Therefore the total spectrum of 2048 singular values was available to reconstruct the sinogram qe. It was observed that the reconstruction required more than 900 terms for accuracy. The average regiional value remained about 300 counts/pixe12 from 900 up to the maximum index of 2048. However, the noise began to increase after a singular value index of 1500. IV. DISCUSSION
An SVD reconstruction algorithm was used to reconstruct a natural pixel representation of computer simulated projections attenuated by a variable attenuator. Computer simulation studies with and without noise showed that projections attenuated by a variable attenuator could be reconstructed using a natural pixel basis to give accurate and precise attenuation corrected reconstructions. The coefficients of the natural pixel representation of the variable attenuator were first estimated. The estimated coefficients of qt were used to calculate the attenuation factors in the natural pixel representation of the emission projection-backprojection operator. With the natural pixel representation, the emission source distribution and the variable attenuation distribution are continuous functions, which do not need to be represented by any type of pixalization. The goal of the present work was to investigate whether attenuation corrected reconstructions could be obtained by a reconstruction algorithm that used a natural pixel representation of the attenuated Radon transform with variable attenuator. The work was intended to lay the groundwork for eventually evaluating whether a natural pixel representation could be used to improve the accuracy of attenuation corrected emission reconstructions, which use an algorithm that models the attenuation using attenuation factors calculated from the reconstruction of truncated transmission data. Simultaneous transmission%mission imaging using a three detector SPECT system typically must reconstruct attenuation
300
IEEE TRANSACTIONS ON NUCLEAR SCIENCE, VOL. 43, NO. 1, FEBRUARY 1996
(4
CO)
(4
(4
Fig. 6. Transmission (no noise) and attenuation corrected emission (no noise) reconstructions using natural pixel basis. (a) Reconstructed sinogram plot of qt . The sinogram gt is obtained by using 600 singular value terms of the Mt matrix. (b) Reconstructed attenuator with profile plot through tissue and lung. The reconstruction is obtained by sampling the backprojection of qt in (a) on a 32 x 32 grid. (c) Reconstructed attenuator with profile plot through the spine. (d) The attenuation corrected emission reconstruction. The reconstructed emission distribution is obtained by sampling the backprojection of g, on a 32 x 32 grid. The sinogram ge was obtained by using 1100 singular value terms of the matrix Me with elements calculated from (6) using the reconstructed transmission sinogram gt in (a). The average value within the reconstructed emission region is 304.2500 f 3.7851. Note: The numbers in the lower left corner of the images are equal to the number of singular terms used in the expansion of the sinogram divided by 10.
aps of the thorax from truncated transmission projections. has been observed in simulations [l] that the use of ral pixels improves the accuracy and the image quality e reconstruction of nonattenuated truncated projections. hypothesized that the natural pixel representation of the uated Radon transform for a variable attenuator will have oved accuracy for truncated transmission data because the attenuation map is not reconstructed as a pixelized distribution, but the attenuation factors are formulated 1s exponentials of integrals of the continuous natural pixel representation of the attenuation distribution. It is interesting to note that other researchers [12] have applied natural pixels to limited angle reconstruction, which is also a limited data reconstruction problem. A more appropriate model for SPECT than the ideal parallel geometry assumed in this paper would be one that models both attenuation and the geometric response. The geometric response could be modeled as natural pixels that diverge from the sampling bin to account for the resolution fall off with distance from the face of the collimator. The natural
pixels would be cones, with the vertex at the sampling bin and with weights that vary such that the integral over every cross-sectional area of the cone parallel to the detector has equal area no matter what distance the plane of the crosssectional area is from the collimator. This means that the natural pixel is no longer a characteristic function (i.e., one and zero), but decreases in value with distance from the collimator. Conceptually this is a straightforward problem to solve if one has sufficient computer power. However, more efficient algorithms require direct methods for calculating the overlapping areas of any two natural pixels, which in SPECT is not easy to determine analytically. This is in contrast to an application in PET where an SVD reconstruction using a natural pixel model was successfully applied to recover the point response image degradation [13], [14]. To obtain precision in the reconstructed values, a statistical model should be used that best fits the statistical fluctuations of the detection process. In this paper we assumed a Gaussian statistical model and obtained least squares solutions. A weighted least squares can be obtained by including statistical
30 1
GULLBERG et al.: AN SVD RECONSTRUCTION ALGORITHM USING A NATURAL PIXEL REPRESENTATION
(a)
(b)
(C)
(4
Fig. 7. Transmission (no noise) and attenuation corrected emission (noise) reconstructions using natural pixel basis. (a) Reconstructed sinogram plot of qt . The sinogram qt is obtained by using 600 singular value terms of the nCr, matrix. (b) Reconstructed attenuator with profile plot through tissue and lung. The reconstruction is obtained by sampling the backprojection of qt in (a) on a 32 x 32 grid. (c) Reconstructed attenuator with profile plot through the spine. (d) The attenuation corrected emission reconstruction. The reconstructed emission distribution is obtained by sampling the backprojection of qe on a 32 x 32 grid. The sinogram qe was obtained by using 1100 singular value terms of the matrix Me with elements calculated from (6) using the reconstructed transmission sinogram qt in (a). The average value within the reconstructed emission region is 303.8188 f 4.8410.
weights in the M matrix; this is something we are investigating. The weighted least squares solution should give more efficient estimates of the reconstructed image. Still a better approach would be to model the statistics as a Poisson distribution which is more appropriate for gamma camera counting. This would require the derivation of a new ML-EM type algorithm. An analytical formulation for the elements of the matrix Me in (6) has not been derived. Such an expression would significantly speed up the computation time. In calculating the matrix Me, the integrals of the attenuation factors over the region of two overlapping natural pixels is approximated as a summation over subpixels (Fig. 3 ) . To initially store the matrix Me, it required (32 x 64)2 32 bit words for the examples presented in this paper. The SVD calculation required twice this memory because it was performed in
required 6 hours of CPU time to perform the SVD on Me. We expect that these times could be improved with better optimization of the code. The regularization techniques that have been developed for square pixel reconstructions, such as the use of smoothness priors [15]-[17], do not appear suitable for the natural pixel approach because the image is never represented. In our reconstruction using natural pixels, we impose that Mq = p. The SVD approach is used to solve this system of equations. One type of regularization truncates the singular value expansion. Other regularization methods could be developed by imposing various smoothness criteria on the projection solution q. The difficulty is to impose smoothness criteria on the projection solution that would insure that a particular smoothness criteria is satisfied for the reconstructed image. This is not to say
double precision. Two steps required major computation time:
that it cannot be done, but at this point in
The first calculated the elements of the matrix Me, the second performed the singular value decomposition of the matrix Me. The calculation of the matrix Me required 24 hours of computation time on a SUN SPARCstation 200 (40 MHz superSPARC processor, 256 Mbytes of memory). It then
it isn’t clear how a smoothness criterion imposed on the image space might be imposed on the projections so that the backprojection of the projection solution might satisfy a smoothness criterion imposed upon the image. Also, when using a natural pixel model it may be difficult to impose a
OUT
research
302
IEEE TRANSACTIONS ON NUCLEAR SCIENCE, VOL. 43, NO. 1, FEBRUARY 1996
Fig. 8. Transmission (noise) and attenuation corrected emission (noise) reconstructions using natural pixel basis. (a) Reconstructed sinogram plot of qt. The sinogram qt is obtained by using 600 singular value terms of the Mt matrix. (b) Reconstructed attenuator with profile plot through tissue and lung. The reconstruction is obtained by sampling the backprojection of qt in (a) on a 32 x 32 grid. (c) Reconstructed attenuator with profile plot through the spine. (d) The attenuation corrected emission reconstruction.The reconstructed emission distribution is obtained by sampling the backprojection of qe on a 32 x 32 grid. The sinogram qe was obtained by using 1240 singular value terms of the matrix Me with elements calculated from (6) using the reconstructed transmission sinogram qt in (a). The average value within the reconstructed emission region is 301.6625 f 6 4569
nonnegativity constraint on the reconstructed image. At least in terms of the present development, the natural pixel model does not have regularization techniques available for the square pixel model. The goal in this paper was to get away from a square pixel representation of the attenuator [18], [19] so that the attenuation factors could be calculated directly from the reconstructed coefficients of the natural pixel basis functions. It is hoped that this will improve the accuracy of attenuation factors calculated from truncated transmission projections. However, other basis functions may prove to even be better. Such possibilities are variations of the square pixel approach, such as a local basis of cubic B-splines [20] or an overlapping basis that is rotationally invariant [21]. In the past it has b e n common with iterative reconstruction algorithms to represent the image as an expansion of a nonoverlapping square pixel basis or polar pixel basis [22]-[24] for convenience and speed in implementing the reconstruction algorithm. With faster computation it may become feasible to use new basis functions such as natural pixels.
ACKNOWLEDGMENT
The authors would like to thank Biodynamics Research Unit, Mayo Foundation, for use of the Analyze software package. They also thank Dr. R. Huesman for his helpful comments.
REFERENCES [l] G. L. Zeng and G. T. Gullberg, ‘‘An iterative reconstruction algorithm with natural pixel basis,” J. Nucl. Med., vol. 34, p. 19P, 1993. [2] G. T. Gullberg and G. L. Zeng, “A reconstruction algorithm using singular value decompositionof a discrete representationof the exponential Radon transform using natural pixels,” IEEE Trans. Nucl. Sci., vol. 41, pp. 2812-2819, 1994. [3] 0. J. Tretiak and C. Metz, “The exponential Radon transform,” SIAM J. A& Math, vol. 39, pp. 341-354, 1980. [4] G. T. Gullberg and T. F. Budinger, “The use of filtering methods to compensatefor constant attenuation in single-photon emission computed tomography,” IEEE Trans. Biomed. Eng., vol. BME-28, pp. 142:157, 1981. [5] G. T. Gullberg, “The attenuatedradon transform: Theory and application in medicine and biology,” Ph.D. thesis, University of California at Berkeley, 1979. [6] F. Natterer, The Mathematics of Computerized Tomography. Chichester, U.K Wiley, 1986, pp. 144150 and 156-157.
GULLBERG er al.: AN SVD RECONSTRUCTION ALGORITHM USING A NATURAL PIXEL REPRESENTATION
[7] F. Natterer, “Efficient implementation of optimal algorithms in computerized tomography,” Math. Meths. In Appl. Sci., vol. 2, pp. 545-555, 1980. [8] M. H. Buonocore, W. R. Brody, and A. Macovski, “A natural pixel decomposition for two-dimensionalimage reconstruction,”IEEE Trans. Biomed. Eng., vol. BME-28, pp. 69-78, 1981. [9] G. Backus and F. Gilbert, “The resolving power of gross earth data,” Geophys. J. R. Astr. Soc., vol. 16, pp. 169-205, 1968. [lo] M. Bertero, C. De Mol, and E. R. Pike, “Linear inverse problems with discrete data. I: General formulation and singular system analysis,” Inverse Problems, vol. 1, pp. 301-330, 1985. [ 111 -, “Linear inverse problems with discrete data: 11. Stability and regularisation,” Inverse Problems, vol. 4, pp. 573-594, 1988. [12] L. Gamero, J.-P. Hugonin, and N. De Beaucoudrey, “Limited-angle tomographic imaging using a constrained natural-pixel decomposition,” Optica Acta, vol. 33, pp. 659471, 1986. [13] J. R. Baker, “Spatially variant tomographic imaging: Estimation, identification, and optimization,” Ph.D. dissertation, University of California at Berkeley, 1991. [14] J. R. Baker, T. F. Budinger, and R. H. Huesman, “Generalized approach to inverse problems in tomography: Image reconstruction for spatially variant systems using natural pixels,” Critical Rev. Biomed. Eng., vol. 20, pp. 47-71, 1992. [15] D. L. Snyder and M. I. Miller, “The use of sieves to stabilize images produced with the EM algorithm for emission tomography,” IEEE Trans. Nucl. Sci., vol. NS-32, pp. 3864-3872, 1985.
303
[16] E. Levitan and G. T. Herman, “A maximum a posteriori probability expectation maximization algorithm for image reconstruction in emission tomography,” IEEE Trans. Med. I m g . , vol. MI-6, pp. 185-192, 1987. [17] D. S. Lalush and B. M. W. Tsui, “Simulation evaluation of Gibbs prior distributions for use in maximum a posteriori SPECT reconstructions,” IEEE Trans. Med. Imag., vol. 11, pp. 267-275, 1992. [18] G. T. Gullberg, R. H. Huesman, J. A. Malko, N. J. Pelc, and T. F. Budinger, “An attenuated projector-backprojectorfor iterative SPECT reconstruction,” Phys. Med. Biol., vol. 30, pp 799-816, 1985. [19] R. H. Huesman, G. T. Gullberg, W. L. Greenberg, and T. F. Budinger, “Donner Algorithms for Reconstruction Tomography,” Lawrence Laboratory Pub. PUB 214, 1977. [20] K. M. Hanson and G. W. Wecksung, “Local basis-function approach to computed tomography,” Appl. Optics, vol. 24, pp. 40284039, 1985. [21] R. M. Lewitt, “Altematives to voxels for image representation in iterative reconstruction algorithms,” Phys. Med. Biol., vol. 37, pp. 705-716, 1992. [22] M. H. Buonocore, W. R. Brody, A. Macovski, and S. L. Wood, “A polar pixel Kalman filter for limited data CT image reconstruction,” in Proc. Soc. Photo-Opt. Instrum. Eng., San Diego, CA, Aug. 1979, vol. 206, pp. 1019-115. [231 C. E. Floyd, R. 5. Jaszczak, and R. E. Coleman, “Image resampling on a cylindrical sector grid,” IEEE Trans. Med. Imag., vol. MI-5, pp. 128-131, 1986. [24] T. J. Hebert and R.M. Leahy, “Fast methods for including attenuation in the EM algonthm,” IEEE Trans. Nucl. Sci., vol. 37, pp. 754-758, 1990.