coronal plane with a vibratome (VT1200S, Leica Biosystems, Germany) and were. 84 transferred for 1 min in a solution containing (in mM) 225 D-mannitol, 2.5 ...
1
Table of content
2
Appendix Figure S1
3
Appendix Figure S2
4
Appendix Figure legends
5
Appendix Discussion Appendix Materials and Methods
6 7
Appendix References
Model
ExpDecay1
Model
ExpDecay1
Equation
y = y0 + A1*exp( -(x-x0)/t1)
Equation
y = y0 + A1*exp( -(x-x0)/t1)
Reduced Chi-Sq r
0.57757
Adj. R-Square
0.98994
Reduced Chi-Sq r
0.40708
Adj. R-Square Value
0.97473
Standard Error
Value
Standard Error
STCCntr
y0
0
0
STCTBOA
y0
STCCntr
x0
330
0
STCTBOA
x0
330
0
STCCntr
A1
-72.50279
0.7846
STCTBOA
A1
-38.21667
0.60134
STCCntr
t1
7.28581
0.0565
STCTBOA
t1
12.33379
0.13149
0
0
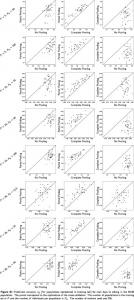
8
τ = 11.9 ms
Ctr τ = 7.2 ms
20 pA
10 ms
100 µA
10 ms
300 µA
600 µA 800 µA
STC τdecay (ms)
TBOA 5 µM
10
150 125
8
100
6
75 4
50
2 0
25
100
300
600
Stim intensity (µA)
Appendix Figure S1 9 10 11 12
1
STC amplitude (pA)
B 5 pA
A
800
0
5
200
***
150 100 50 0
WT
KI
300
***
3 2 1 0
5
250
4
CSD threshold (ms)
CSD threshold (ms)
250
CSD velocity (mm/min)
300
P34 – P35 RT
B
P34 – P35 T = 30°C
WT
200 150 100 50 0
KI
***
WT
KI
CSD velocity (mm/min)
A
4
***
3 2 1 0
WT
KI
Appendix Figure S2 13 14 15 16
Appendix figure legends
17 18
Figure S1. The decay kinetics of the STC reflect the rate of glutamate clearance by
19
astrocytes and provide a measure of the rate of glutamate clearance which is
20
independent of the amount of glutamate released.
21
(A) Inhibition of a fraction of glutamate transporters with DL-TBOA increases τdecay of the
22
STC elicited by single pulse stimulation in layer 1 astrocytes in WT cortical slices. In the
23
representative experiment shown here, 5 µM DL-TBOA increased by 65% τdecay of the STC
24
(from 6.6 ms to 12.6 ms) and decreased the STC amplitude by 42%. The STC was
25
isolated pharmacologically by subtracting the current recorded in the presence of
26
saturating concentrations of DL-TBOA (100 µM) from the total control current and the total
27
current recorded in the presence of 5 µM DL-TBOA (see Fig 1B of main text). P23 (n=3;
28
N=2).
29
(B) Increasing the intensity of the extracellular stimulation increases the amplitude without
30
affecting the decay kinetics of the STC elicited by single pulse stimulation in layer 1 2
31
astrocytes in WT cortical slice. STC traces at increasing intensity of extracellular
32
stimulation (left) together with τdecay and amplitude of the STC as a function of the intensity
33
of stimulation (right) in a representative experiment in which the stimulation intensity was
34
increased from 100 to 800 µA. The STC was isolated by subtracting from the total inward
35
current an exponential waveform that approximates the average TBOA-insensitive current
36
(see Fig 1C of main text). P21 (n=3; N=3).
37 38
Figure S2. Facilitation of CSD induction and propagation in acute cortical slices of
39
P34-35 W887R/+ FHM2 KI mice at different temperatures.
40
(A) CSD threshold and CSD velocity in WT (n = 20; N=3) and FHM2 KI (n = 26; N=4)
41
cortical slices from P34-35 mice (T = 30 °C, flow rate 13 ml/min). CSD threshold is 39%
42
lower in FHM2 KI relative to WT mice (149 ± 6 vs 243 ± 4 ms; Mann-Whitney U test, P
25 nm from the
245
membrane extracellular side (Melone et al, 2009). Comparison of particle densities (i.e.,
246
background, total, cytoplasmic and membrane-associated densities) of immunopositive
247
profiles between WT and FHM2 and between FHM2 saline and cetriaxone groups was
248
then performed using GraphPrism.
249
Equipment, settings and image analysis. For electron microscopy, Philips EM 208 and
250
CM10 electron microscopes (Eindhoven, The Netherlands) coupled to a MegaView-II high
251
resolution CCD camera with Soft Imaging System (Münster, Germany) and iTEM software
252
v 5.1 (Olympus Soft Imaging Solutions, GmbH) were used to acquire microscopical fields
253
from immunogold processed ultrathin sections. Original collected images were in gray
254
scale method (jpg format), 8 bit/channel with an original resolution of 150 dpi (1376 x 1032
255
pixels; 23.3 x 17.48 cm) for those of the Philips EM 208, and of 300 dpi (2048 x 2048 11
256
pixels; 17.34 x 17.34 cm) for those of CM10. For determining the relative density of GLT-
257
1a gold particles, original images were opened with ImageJ; set scale function was applied
258
and then total, cytoplasmic and membrane areas of profiles were calculate, gold particles
259
within the areas counted and data collected.
260
Image processing for final illustrations. For final qualitative high resolution illustrations of
261
fields representative of data obtained, original images were properly dimensioned and
262
converted into high resolution images (600 dpi; gray scale method, tiff format, 8
263
bit/channel) by using Adobe Photoshop CS5 extended (v.12.1). Selected areas of interest
264
were cropped and gray levels of final images, were obtained by using the level function
265
with minimal degree of processing.
266 267
Western blotting
268
Total amount of protein in cortical crude synaptic membranes was determined according to
269
the Bradford method (Bradford, 1976) using the Bio-Rad Protein Assay (Bio-Rad
270
Laboratories, GmbH, Munchen, Germany) and a Beckman DU 530 spectrophotometer
271
(Beckman Coulter, Fullerton, CA; 3–4 measurements/homogenate). A standard curve with
272
2-10 µg of bovine serum albumin was drawn for each dosing run. Curves of increasing
273
concentration were drawn to define a linear range for densitometric analysis (Bragina et al,
274
2006). Aliquots of homogenates were subjected to SDS-PAGE (3 µg of total protein [tp] for
275
GLT-1 studies; 7 of [tp] for α2 Na+,K+ ATPase studies; and 5 of [tp] for both xCT and
276
Kir4.1 studies). To control potein loading, β-actin and β-tubulin were used as
277
housekeeping proteins (Li & Shen, 2013). Based on the known molecular weight of each
278
protein studied and to avoid possible overlaps between bands, β-actin was used as
279
housekeeping protein for GLT-1a and α2 Na+,K+ ATPase studies, whereas β-tubulin for
280
xCT, and Kir4.1 experiments. Separated proteins were electroblotted onto nitrocellulose 12
281
filters, which were initially washed in phosphate buffered saline with 0.1% Tween 20 (PBS-
282
T; pH7.4); subsequently, they were exposed first to a blocking buffer solution (5% Bio-Rad
283
non-fat dry milk in PBS-T; 1 h), and incubated (2 h at room
284
overnight at 4°C ) in a solution of 0.1% BSA in PBS-T containing anti-GLT-1a made in
285
rabbit (0.12 µg/ml) and anti-β-actin made in mouse (1:5000; A5441, Sigma-Aldrich, St
286
Louis, MO), or anti-α2 Na+,K+ ATPase made in rabbit (1:350; Merck-Millipore) and anti-
287
β−actin made in mouse (1:5000) primary antibodies, or anti-xCT made in rabbit (1:250;
288
ab93030, Abcam; Cambrige, UK; raised against a synthetic peptide corresponding to N-
289
terminal residues (between 1-50) of mouse xCT; (Van Liefferinge et al, 2016)) and anti-β-
290
tubulin made in mouse (1:2000; T5293, Sigma-Aldrich) primary antibodies or anti-Kir4.1
291
(1:700; H00003766-M01, Novus Biological, Abingdon, UK; raised against KCNJ10
292
(NP_002232,
293
(DFELVLILSGTVESTSATCQVRTSYLPEEILWGYEFTPAISLSASGKYIADFSLFDQVVKVA
294
SPSGLRDSTVRYGDPEKLKLEESLREQAEKEGSALSVRISNV); (Tong et al, 2014)) and
295
anti-β-tubulin made in mouse (1:2000) primary antibodies. The following day, filters were
296
washed with PBS-T and then exposed to appropriate secondary antibodies (Jackson)
297
dissolved
298
chemiluminescent substrate (Bragina et al., 2006). Homogenates from each animal were
299
experimented 4-6 times for each antigen. Intensity data were calculated as ratios of
300
GLT1a/β-actin, α2 Na+,K+ ATPase/β-actin, xCT/β-tubulin, and Kir4.1/β-tubulin (Alhaddad et
301
al, 2014; Melzer et al, 2008). Comparison between saline and cetriaxone measures for
302
each antigen was performed using GraphPrism.
303
Acquisition and quantification of bands. Immnunoreactive bands were visualized by Bio-
304
Rad Chemidoc and Quantity One software v.4.1. Optimal time of exposure during
305
acquisition, was set for each antigen based on the appearance of few saturated pixel in
in
A.A.276-380)
PBS-T.
Bands
partial
were
recombinant
visualized
13
by
temperature and then
protein
the
with
SuperSignal
GSTtag
West
Pico
306
immunoreactive bands with a visible gray background. For GLT-1a and α2 Na+,K+ ATPase
307
studies, optimal exposure time for GLT-1a and α2 Na+,K+ ATPase corresponded to that of
308
β-actin detection whereas for both xCT and Kir4.1, exposure time was different to that of β-
309
tubulin detection (for this reason illustrative images of western blottings of GLT-1a and α2
310
Na+,K+ ATPase and β-actin there is no cropping between bands, whereas for those of xCT
311
and Kir4.1 and β-tubulin there is cropping between bands). Original images of acquisition
312
(1sc format) were used to quantify the intensity of bands by Quantity One tools. Collected
313
values were used to calculate ratios of GLT1a/βactin, α2 Na+,K+ ATPase/β-actin, xCT/β-
314
tubulin, and Kir4.1/β-tubulin.
315
Image processing for final illustrations. Original images (1sc format) were exported in tiff
316
format (resolution of 97.5 dpi, gray scale method, 8 bit/channel, 20 x 13.3 cm) by Quantity
317
One software. For final qualitative illustrations of data, original images were properly
318
cropped (without excluding additional bands), dimensioned and converted into high
319
resolution images (600 dpi; gray scale method, tiff format, 8 bit/channel) by using Adobe
320
Photoshop CS5 extended (v.12.1). Gray levels of final images, were obtained by using the
321
level function with minimal degree of processing.
322
Appendix References
323 324 325
Alhaddad H, Das SC, Sari Y (2014) Effects of ceftriaxone on ethanol intake: a possible role for xCT and GLT-1 isoforms modulation of glutamate levels in P rats. Psychopharmacology 231: 4049-4057
326 327 328 329
Bozdagi O, Shan W, Tanaka H, Benson DL, Huntley GW (2000) Increasing numbers of synaptic puncta during late-phase LTP: N-cadherin is synthesized, recruited to synaptic sites, and required for potentiation. Neuron 28: 245-259
330 331 332 333
Bragina L, Melone M, Fattorini G, Torres-Ramos M, Vallejo-Illarramendi A, Matute C, Conti F (2006) GLT-1 down-regulation induced by clozapine in rat frontal cortex is associated with synaptophysin up-regulation. J Neurochem 99: 134-141 14
334 335 336
CHESLER M (2003) Regulation and Modulation of pH in the Brain. Physiological Reviews 83: 1183-1221
337 338 339 340
DeSilva TM, Borenstein NS, Volpe JJ, Kinney HC, Rosenberg PA (2012) Expression of EAAT2 in neurons and protoplasmic astrocytes during human cortical development. J Comp Neurol 520: 3912-3932
341 342 343
Dugue GP, Dumoulin A, Triller A, Dieudonne S (2005) Target-dependent use of coreleased inhibitory transmitters at central synapses. J Neurosci 25: 6490-6498
344 345 346 347
Golovina VA, Song H, James PF, Lingrel JB, Blaustein MP (2003) Na+ pump alpha 2-subunit expression modulates Ca2+ signaling. Am J Physiol Cell Physiol 284: C475-486
348 349 350 351 352
Ikeda K, Onaka T, Yamakado M, Nakai J, Ishikawa TO, Taketo MM, Kawakami K (2003) Degeneration of the amygdala/piriform cortex and enhanced fear/anxiety behaviors in sodium pump alpha2 subunit (Atp1a2)-deficient mice. J Neurosci 23: 4667-4676
353 354 355 356
Juhaszova M, Blaustein MP (1997) Na+ pump low and high ouabain affinity alpha subunit isoforms are differently distributed in cells. Proc Natl Acad Sci U S A 94: 1800-1805
357 358 359 360
Li R, Shen Y (2013) An old method facing a new challenge: Re-visiting housekeeping proteins as internal reference control for neuroscience research. Life Sciences 92: 747-751
361 362 363
Melone M, Bellesi M, Conti F (2009) Synaptic localization of GLT-1a in the rat somatic sensory cortex. Glia 57: 108-117
364 365 366 367
Melone M, Burette A, Weinberg RJ (2005) Light microscopic identification and immunocytochemical characterization of glutamatergic synapses in brain sections. J Comp Neurol 492: 495-509
368 369 370 371 372
Melzer N, Meuth SG, Torres-Salazar D, Bittner S, Zozulya AL, Weidenfeller C, Kotsiari A, Stangel M, Fahlke C, Wiendl H (2008) A ?-Lactam Antibiotic Dampens Excitotoxic Inflammatory CNS Damage in a Mouse Model of Multiple Sclerosis. PLoS ONE 3: e3149 15
373 374 375 376 377
Minelli A, Castaldo P, Gobbi P, Salucci S, Magi S, Amoroso S (2007) Cellular and subcellular localization of Na+–Ca2+ exchanger protein isoforms, NCX1, NCX2, and NCX3 in cerebral cortex and hippocampus of adult rat. Cell Calcium 41: 221234
378 379 380 381 382
Moseley AE, Lieske SP, Wetzel RK, James PF, He S, Shelly DA, Paul RJ, Boivin GP, Witte DP, Ramirez JM, Sweadner KJ, Lingrel JB (2003) The Na,K-ATPase alpha 2 isoform is expressed in neurons, and its absence disrupts neuronal activity in newborn mice. J Biol Chem 278: 5317-5324
383 384 385 386
Omrani A, Melone M, Bellesi M, Safiulina V, Aida T, Tanaka K, Cherubini E, Conti F (2009) Up-regulation of GLT-1 severely impairs LTD at mossy fibre--CA3 synapses. J Physiol 587: 4575-4588
387 388 389
Racz B, Weinberg RJ (2004) The subcellular organization of cortactin in hippocampus. J Neurosci 24: 10310-10317
390 391 392 393
Rothstein JD, Martin L, Levey AI, Dykes-Hoberg M, Jin L, Wu D, Nash N, Kuncl RW (1994) Localization of neuronal and glial glutamate transporters. Neuron 13: 713725
394 395 396 397 398
Tong X, Ao Y, Faas GC, Nwaobi SE, Xu J, Haustein MD, Anderson MA, Mody I, Olsen ML, Sofroniew MV, Khakh BS (2014) Astrocyte Kir4.1 ion channel deficits contribute to neuronal dysfunction in Huntington's disease model mice. Nat Neurosci 17: 694-703
399 400 401 402 403
Tottene A, Conti R, Fabbro A, Vecchia D, Shapovalova M, Santello M, van den Maagdenberg AMJM, Ferrari MD, Pietrobon D (2009) Enhanced Excitatory Transmission at Cortical Synapses as the Basis for Facilitated Spreading Depression in Ca(v)2.1 Knockin Migraine Mice. Neuron 61: 762-773
404 405 406 407
Tyler WJ, Pozzo-Miller LD (2001) BDNF enhances quantal neurotransmitter release and increases the number of docked vesicles at the active zones of hippocampal excitatory synapses. J Neurosci 21: 4249-4258
408 409 410 411 412
Van Liefferinge J, Bentea E, Demuyser T, Albertini G, Follin-Arbelet V, Holmseth S, Merckx E, Sato H, Aerts JL, Smolders I, Arckens L, Danbolt NC, Massie A (2016) Comparative analysis of antibodies to xCT (Slc7a11): Forewarned is forearmed. Journal of Comparative Neurology 524: 1015-1032 16
413 414 415
17