developing and delivering didactic tools for use in statistics teaching. ... channels
(e.g. Doane, Mathieson, & Tracy, 1997; Lohninger, 1999; Velleman, 1998).
ICOTS6, 2002: Darius et al.
APPLETS FOR EXPERIMENTING WITH STATISTICAL CONCEPTS P. Darius,,, S. Michiels, B. Raeymaekers Katholieke Universiteit Leuven, Belgium J-P. Ottoy,, O. Thas Ghent University, Belgium The World Wide Web and the JAVA programming environment provide a framework for developing and delivering didactic tools for use in statistics teaching. This paper describes VESTAC, a collection of such tools aimed at the visualization of a number of statistical concepts and allowing the user to experiment with them interactively. The collection is freely accessible over the web and covers selected topics from the following areas: distributions and plots, tests and confidence intervals, regression and analysis of variance. BACKGROUND Teachers of statistics encounter a number of didactic problems, especially when teaching the introductory statistics course. Some students experience parts of the material as too abstract, and have difficulty mastering the key concepts. It has been argued that supplementing the traditional material with tools based on a visual approach and a more active form of learning could improve the effectiveness of the teaching (Anderson-Cook & Dorai-Rai, 2001; Cobb, 1992; Marasinghe, Meeker, Cook, & Shin, 1996; Moore, 1997). This paper describes such a tool. It consists of a set of JAVA applets called VESTAC (Visualization of and Experimentation with Statistical Concepts), covering selected topics useful for an introductory course and a second regression and/or ANOVA course. Each applet gives a visual representation of the topic, with ample possibilities to see the asymptotic results build up, or to experiment with the data and the parameters and see the effects immediately. Those topics were selected for which it was thought that an interactive visual applet could have didactic properties exceeding those attainable with more traditional didactic tools. Currently, many computer-based tools are available for statistical teaching. There are interactive textbooks and/or sets of applications, marketed through the traditional textbook channels (e.g. Doane, Mathieson, & Tracy, 1997; Lohninger, 1999; Velleman, 1998). There are also many internet-accessible texts/applications. They all vary greatly in quality, scope and price. In a number of aspects, the VESTAC collection is rather different from most of these. In the section on implementation, we describe some of VESTAC’s specific features. The VESTAC applets can be accessed freely over the web through one of the following URL’s: http://www.kuleuven.ac.be/ucs/java http://fltbw2.rug.ac.be/iloapp/Applets_Home. OVERVIEW The VESTAC collection currently consists of 32 applets. Additional ones are under construction. They cover selected topics from the following four areas: distributions and plots, tests and confidence intervals, regression and analysis of variance. The distribution applets visualize the form and relevant tail areas of the usual univariate distributions and the bivariate normal. They also show how these change when the parameters are changed, allowing them to be used as a visual statistical table. The central limit theorem is illustrated by showing how the mean of samples from different distributions gradually approaches a normal distribution. Other applets let the user experiment with histograms, boxplots and QQplots, and visualize the concept of correlation. The second group of applets deals with the concept of a confidence interval, illustrates one sample, two sample and some non-parametric tests and visualizes power and type I and type II errors. The regression applets deal with the relation between population and sample, and show how the variation of the sample regression line is influenced by the choice of the x-values. It is also shown how fitting a curve according to the least squares criterion relates to finding the minimum of an SSerror surface, in the linear as well as in the non-linear case. The distributions of MSregression, MSerror and their quotient are built up through repeated sampling. The correlation 1
ICOTS6, 2002: Darius et al.
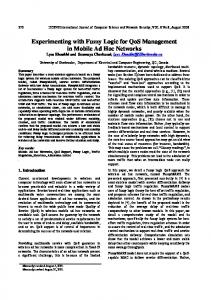
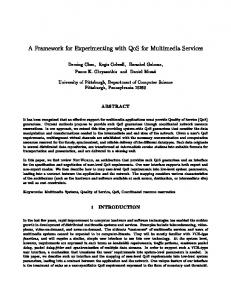
between the estimators for slope and intercept is shown. Confidence bands and prediction intervals are illustrated, residual and normal probability plots, as well as the effect of influential points and outliers. The difference between regressing y on x and x on y is shown (in all these cases the data points can be dragged with the mouse and the effect immediately seen). Other applets illustrate the Box-Cox transformation and the effect of near-multicollinearity on the confidence intervals of the parameters. Finally, a couple of applets visualize permutation tests for small datasets. The ANOVA applets illustrate the relation between population and sample, and allow the effect of changes in the data to be seen on residual and normal probability plots. Another applet shows how the distributions of MStreatment, MSerror and their quotient are built up, when the usual null hypothesis is true, as well as in the case of a user specified alternative hypothesis being true. There is also an applet that shows the mechanism of the permutation test and visualizes the exact randomization distribution. Finally, an applet illustrates the danger of using t-tests for testing hypotheses generated by data snooping. It shows both the distribution of pairwise differences between sample group means under repeated sampling, and the distribution of the difference between the largest and the smallest sample group mean. IMPLEMENTATION In the VESTAC collection, every effort has been made to give the applets, as much as possible, a common “look and feel”. The collection is based on an extensive class library specially written in JAVA to implement certain GUI aspects, repeated random simulation, construction of statistical graphs and statistical computation. All the applets use classes from this library. Wherever applicable, the “Step”, “Walk” and “Run” buttons implement repeated sampling. The “Step” button generates one new sample. The main results of the previous samples (if any) remain visible on the screen. The “Walk” button generates one sample after the other until a specified limit is reached, and does this at a slow rate, allowing the user to see how the final result is built up. The “Run” button generates new samples at the fastest possible rate. Figure 1 illustrates this for the applet visualizing the variability of the sample regression line. It shows the situation after hitting “Step” five times. Shown are: the population regression line (the dark line with intercept 20.0), and (in a different colour, but also dark in Figure 1) the current sample points and the fitted line. The gray lines are the lines fitted on the previous samples. An applet originally appears in a separate window, with default parameter settings applied. This makes it possible to start the applet demonstration quickly (e.g. while teaching in a classroom). The visual elements (e.g. the points on a scatterplot) can, wherever applicable, be manipulated directly by dragging with the mouse. The most important parameters (e.g. the degrees of freedom of a distribution) can be adjusted directly on the screen. All the other parameters can be changed through a pop-up window. The applets not only execute simulations based on settings of population parameters, those for which it is relevant also allow import of an actual dataset. This makes it possible for the applets to use the same datasets as e.g. those in the textbook. However, due to security measures in Internet browsers, this is only possible with datasets stored on the web server. Figure 2 hints at the available possibilities for interactive experimentation. This applet shows a set of points (either obtained by random sampling from a specified population, or from an available dataset), with the fitted regression line and/or prediction/confidence bands. Each of the points can be dragged around with the mouse, and both line and bands are instantly adjusted to the new position. The most interesting learning experience occurs when two or more parameter settings can be compared side by side. To make this possible, all the applets have the following features: upon hitting a “new window” button, a new window appears and the previous windows are resized, so that they are all visible on the screen. Each window now behaves as a separate applet: parameters can be changed on each and computations in each window occur concurrently.
2
ICOTS6, 2002: Darius et al.
Figure 1. Variability of the Sample Regression Line, as Illustrated by Repeated from a Population (see detailed explanation in the text).
Figure 2. Sensitivity of the Fitted Line and the Associated Prediction/Confidence Bands for the Location of Particular Points (see detailed explanation in the text).
3
ICOTS6, 2002: Darius et al.
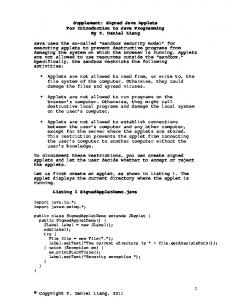
Figure 3. Comparing the Variability of the Fitted Line, for Samples from the Same Population but with Different x-Values (see detailed explanation in the text). Figure 3 shows two windows with the same applet (the one from Figure 1). It illustrates how the x-values of the sample points influence the variability of the fitted line. In both windows, sampling is from the same population. But in each window points are sampled from different xlocations. The user can specify these by dragging the little triangles on the x-axis to the appropriate positions. As in Figure 1, the screen shows the population regression line, the last sample and its fitted regression line, and (in gray) all the lines fitted on the previous samples. Finally the applets contain two types of help: help with the graphical user interface (when the mouse is moved over a part, the explanation is shown) and an explanation of the statistical background. A third type, suggestions for experimenting, is currently under construction. To implement a library with these features, several software environments could have been chosen. In VESTAC, JAVA applets were used because of their apparent advantages from an educational point of view: the software is kept and maintained at one place (the Internet server), and can be executed on any PC with an Internet connection and an Internet browser. No special software is needed on the client PC, yet all the computational work is done there, allowing the server to serve large quantities of clients at the same time. A client server approach could have been used, with a statistical package on the server side. This might slow down the execution speed, especially when a substantial number of users requests access at the same time (a typical situation with guided exercises in a PC-class), and raises license fee issues. JAVA applets also have disadvantages. The download speed of the JAVA code will be a problem when the Internet connection is slow. When its speed is reasonable, we found the download speed of the applets acceptable (only the needed parts of the class library are downloaded). The execution speed was found to be very high, allowing e.g. immediate recalculation of the regression line when points are dragged. The original JAVA version 1.1 implementation proved to be rather stable, and only minor adjustments were required to keep the applets fully operational with new versions of the major
4
ICOTS6, 2002: Darius et al.
Internet browsers. However, since the latest version of the most widely used PC operating system does not include a JAVA virtual machine any more, continued general availability of Internet browsers with the default ability to execute JAVA applets seems uncertain. In the future, the user will probably have to download a JAVA virtual machine – there are several versions freely available on the web (this must only be done once). Or, in the case of PC-classes where permanent downloads are typically impossible, provisions will have to be made to download the virtual machine once to the server, and make it permanently available to the individual PC’s. USING VESTAC IN TEACHING The VESTAC applets have been designed with different types of didactic use in mind. First of all, they were intended for use by the teacher in the classroom. Choice of layout, colors and fonts has been made to ensure good visibility with a computer screen projector. In addition, students can use the applets during practical exercises in a PC classroom, as well as at home. To encourage the latter types of usage, guided exercise sessions for use with each applet are currently under development. The library was conceived as a source of interactive and adaptable illustrations of selected statistical concepts. It should not be regarded as a comprehensive overview of all the important concepts in the areas covered, and certainly not as a learning environment of its own. Hence it should only be used within the context of a (classical) statistics course. Teachers who want to make use of the applets should select only those that fit well into their course, and wherever possible use the applets with the example data from the course. There is a button on the web site that allows teachers to contact the authors, and arrange for datasets to be put on the server and made accessible from within certain applets. The VESTAC applets are currently used in a variety of courses at the authors’ universities, as well as in a number of other institutions. ACKNOWLEDGEMENTS Development of the VESTAC library was financed through grants from the Flemish government (Ministry of Education), the K.U. Leuven Education Council, and Ghent University. Wim Moreau, Andrej Solomin, Brian van de Noortgate and Ruqi Wang contributed substantially to the programming of the library. REFERENCES Anderson-Cook, C.M., & Dorai-Rai, S. (2001). An active learning in-class demonstration of good experimental design. Journal of Statistics Education, 9. Cobb, G. (1992). Teaching statistics. In L.A. Steen (Ed.), Heeding the call for change: Suggestions for curricular action. Washington DC: Mathematical Association of America. Doane, D., Mathieson, K., & Tracy, R. (1997). Visual statistics. Irwin. Lohninger, H. (1999). Teach/Me – Data Analysis. Springer. Marasinghe, M.G., Meeker, W.Q., Cook, D., & Shin, T.-S. (1996). Using graphics and simulation to teach statistical concepts. The American Statistician, 50, 342-351. Moore, D.S. (1997). New pedagogy and new content: the case of statistics. International Statistical Review, 65, 123-165. Velleman, P. (1998). ActivStats. Addison Wesley Interactive.
5