QUT Digital Repository: http://eprints.qut.edu.au/
Mazaheri, Mandana and Johnson, Graham R. and Morawska, Lidia (2009) Application of Bag Sampling Technique for Particle Size Distribution Measurements. Journal of Environmental Monitoring, 11. pp. 2087-2090.
© Copyright 2009 Royal Society of Chemistry
Application of Bag Sampling Technique for Particle Size Distribution Measurements M. MAZAHERI, G.R. JOHNSON, L. MORAWSKA* International Laboratory for Air Quality and Health, Queensland University of Technology, GPO Box 2434, Brisbane, QLD 4001, Australia
Abstract Bag sampling techniques can be used to temporarily store an aerosol and therefore provide sufficient time to utilize sensitive but slow instrumental techniques for recording detailed particle size distributions. Laboratory based assessment of the method were conducted to examine size dependant deposition loss coefficients for aerosols held in VelostatTM bags conforming to a horizontal cylindrical geometry. Deposition losses of NaCl particles in the range of 10 nm to 160 nm were analysed in relation to the bag size, storage time, and sampling flow rate. Results of this study suggest that the bag sampling method is most useful for moderately short sampling periods of about 5 minutes.
*
Phone: 0061 7 3138 2616, Email:
[email protected]
1
1. Introduction Some air pollution studies are conducted based on samples, which are temporarily stored in sampling bags for further analysis and measurement. In general, this method is used when the response of the measuring instrument is too slow to characterize a plume which is only briefly present at the sample intake, such as in exhaust measurements conducted at a distance from a moving aircraft or vehicle. Although the method can be readily applied for gas measurement studies using an inert bag material, deposition behaviour of sampled aerosols during confinement are significant considerations. A number of exhaust plume studies involving aerosol measurements have been conducted using bag sampling, especially for on-road vehicle emission measurements 1-7. The size distribution of particles can be altered during aerosol storage through various processes, including coagulation, size dependant deposition losses due to diffusion, gravitational settling, electrostatic deposition and potentially, in new particle formation, through nucleation 8. Therefore, determination of deposition loss of sampled particles in such bags is necessary, especially for particle size distribution studies. The importance of deposition loss of particles due to diffusion with smaller particle sizes implies that bag sampling techniques will face accuracy limitations at the smallest particle sizes, which may limit their use for nucleation mode studies unless some attempt is made to account for these losses. The most important issues in relation to the deposition loss of particles in sampling bags are the size and shape of the bag, the bag material, mixing processes occurring inside the bag and the particle size distribution. The bag composition has a direct effect on particle loss through its impact on electrostatic deposition, especially for particles in the range 50 nm to 1 μm in diameter, and where high temperature exhaust gases are being sampled 9. These processes should be minimized by using conductive and chemically inert materials, respectively. Bag size and shape also affects deposition processes, with the vertical dimension affecting gravitational losses and the shape determining the surface area to volume ratio and therefore, the diffusion wall deposition loss process
8, 10
. Gravitational deposition is
2
significant for larger particles (> 1 μm) and depends only on the bag dimensions and orientation. Particle losses in the bag must be accounted for in studies that apply the bag sampling technique. The aim of this study was a laboratory based assessment of the bag sampling technique for aerosol measurements. Particle deposition losses that occur during sample confinement in bags were investigated with respect to particle size, sampling flow rate, bag size and storage time. This paper analyses deposition losses of NaCl aerosol as a function of particle size in bags commonly used for sample storage.
2. Experimental Method The general approach of the bag sampling technique is to collect and conduct on-line aerosol size distribution measurements in the shortest possible storage time to minimize the particle loss. Aerosol samples were stored in the sampling bags for up to 20 minutes to examine the storage duration effect on particle loss as a function of particle size.
2.1. Sampler Description The current study examines particle depositions in VelostatTM bags when installed in the Plume Capture Device (PCD). The PCD consists of a rigid opaque polyethylene enclosure which confines and protects the bag and imposes a cylindrical shape on the inflated bag. The PCD can be used as part of a mobile laboratory for emission measurements, as used in the Plume Capture and Analysis System (PCAS) which has been described in detail and utilized in a series of comprehensive aircraft emissions studies where the plume sample is only available for about 15 s 11, 12. Electrically conductive (VelostatTM) sampling bags are made of opaque, volume conductive, carbon impregnated polyolefin. According to the manufacturer, humidity and age have no impact on their electrical characteristics and therefore have been recommended for sampling and short term storage in aerosol measurement studies
13, 14
.
The PCD imposes a fixed cylindrical geometry on the bag when inflated, provided the bag is not permitted to deflate by more than about 15% during sample analysis. These
3
criteria led to the choice of two PCD sizes with 200 litre and 100 litre volumes. The dimensions (Length and Diameter) of the two PCDs used in this study are 80 cm × 40 cm and 90.7 cm × 53 cm, for the smaller and larger ones respectively.
2.2. Instrumentation Two sets of Scanning Mobility Particle Sizer (SMPS, TSI 3934) were used for size distribution measurements of particles. The SMPSs consisted of two different combinations of Electrostatic Classifier and Condensation Particle Counter (TSI EC 3071A/ TSI CPC 3010) and (TSI EC 3080/ TSI CPC 3022) covering 14.6 – 710 nm, and 4.53 – 160 nm respectively. CPC (TSI 3025) was used to measure the total particle number concentrations of particles larger than 3 nm in the bag.
2.3. Sample Preparation and Measurements In order to study the influence of bag size on the deposition, two bag sizes (VelostatTM, 200 litre and 100 litre) were tested using dry NaCl particles in the range from 10 - 160 nm. The impact of sampling flow rate on particle loss in the bag was also examined for 20 nm-NaCl particles. These tests were conducted at 0.3 LPM, 3 LPM, 6 LPM, and 12 LPM sampling flow rates. The impact of particle neutralization was tested for 20 nmNaCl particles. For this purpose, NaCl particles were passed through a neutralizer (Kr85), prior entering the bag. NaCl aerosols with diameters in the range from 20 to 160 nm were produced by passing filtered compressed air through an atomizer containing NaCl solution. The resulting droplets then passed through a silica gel diffusion dryer, where they were dried to about 15% relative humidity (RH) to produce a dry NaCl aerosol for injection into the bag. Filtered ambient room air was then used to dilute the sample. The RH of the resulting aerosol was in the range 50-60%. NaCl effloresces at 45% RH and deliquesces at 75% RH
15
. The NaCl particles therefore remained within the dry crystalline phase, and
hygroscopic growth was not an issue. In order to generate NaCl particles with diameters less than 20 nm, a furnace with temperature of 600 and 640 °C was used.
4
In order to prepare a sample, the bag was first filled and emptied three times with filtered air to eliminate any remaining aerosol. It was then half filled with filtered air. In the next step, aerosol was injected into the bag after which the remaining volume of the bag was filled with filtered air. The resulting turbulence was relied on to mix the aerosols uniformly throughout the entire bag volume. The sample was then immediately examined using the SMPS system. Measurement of particle deposition was conducted using very low particle concentrations to minimise the coagulation effect. The initial particle number concentration was measured immediately after filling the bag, using the CPC. The decay of the size classified particle number concentration was recorded for about 20 minutes. Size classification was performed by setting the EC voltage to the corresponding particle diameter. In this way a large number of concentration measurements were able to be conducted for a specific particle size without performing repeated size distribution scans. A final SMPS scan was recorded to assess the evolution of particle size distribution over time in the bag. Low concentrations of the order of 104 cm-3 or less were used thereby ensuring that coagulation had negligible effect on the concentration over the times considered 3, 16.
3. Particle Loss Mechanisms The concentration of particles in the bag decreased over time, as a result of the particle losses. Considering the particle size range studied in this research, diffusion and coagulation can be expected to be the two main potential causes of particle number concentration decay in the sampling bag. Thermophoretic effects were not an issue throughout the experiments because the air temperature remained constant. The particle deposition loss coefficient due to diffusion in the bag is given based on the exponential decay assumption for a well-mixed vessel of arbitrary shape according to Equation 1
17
. A similar model has also been used by Kim et al. to investigate rate of
diffusion deposition of particles 16.
5
Equation 1: Definition of the Particle Deposition Loss Coefficient
∂n(v, t ) = − β ( v ) n ( v, t ) ∂t Here, n(v,t) is the continuous size distribution function at time t, β(v) is the sizedependent particle deposition loss coefficient and is a characteristic of the bag, which can be calculated from a size distribution measurement conducted at the time of capture (t = 0) and at time t.
4. Results and Discussion
Each experimental result is presented here as an average over at least three experiments, and error bars show relevant standard error of the mean.
4.1. Particle Loss Rate due to Deposition and Coagulation
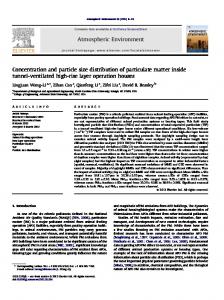
Size distributions of high and low concentrations of NaCl particles in the 200 litre bag were measured using the SMPS. Typical evolution of size distributions of NaCl particles in the 200 litre bag after 20 minutes are shown in Figure 1 for high (a) and low (b) tested concentrations. The results showed that particle number concentrations gradually decrease with time. The average change in total NaCl number concentrations in 200 litre bag was 28.02% after 20 minutes and less than 10% after 5 minutes.
dN/dLogD (cm-3)
1.0E+05
t=0 t = 20 min
(a) 5.0E+04
0.0E+00 10
100
1000
dN/dlogD (cm-3)
3.0E+03
(b)
2.0E+03
t=0 t = 20 min
1.0E+03
0.0E+00 10
100
1000
Particle Diameter (nm)
6
Figure 1 Typical polydisperse size distribution of NaCl aerosols measured from the 200 litre VelostatTM sampling bag for high (a) and low (b) concentrations.
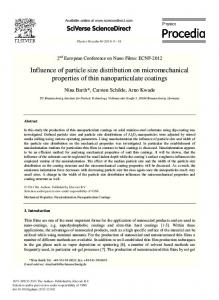
The measured NaCl particle loss coefficients as a function of particle size using CPC data are shown in Figure 2 over a range of sample concentrations showing exponential decays. Fitted curves for different particle sizes flatten out at concentrations of the order of 104 cm-3 or less, supporting the expectation that coagulation becomes negligible for low particle number concentrations and suggesting that losses were dominated by the deposition loss mechanism (even for the smallest particle size, 10 nm). The fitted exponential curves appear to converge to nearly zero as particle diameter increases, which confirms the expected increase in diffusion deposition losses for smaller particles due to the increased diffusion effect.
2.0E-03
10 nm 20 nm 40 nm 160 nm
1.5E-03
(s-1)
Particle Loss Coefficient
2.5E-03
1.0E-03
5.0E-04
0.0E+00 1000
10000
100000 -3
Bag Initial Particle Number Concentration (cm )
Figure 2 Particle loss coefficient versus initial concentration of size-selected NaCl particles in the 200 litre bag.
4.2. Effect of Experimental Conditions on Particle Loss due to Deposition
The effect of bag size and sampling flow rate on deposition losses for the size-selected particles was examined using NaCl aerosols and CPC data. Deposition loss of particles is a bag characteristic, as it depends on bag size and shape, while coagulation depends strongly on particle concentration. In order to investigate the particle losses due only to deposition, particle loss coefficients were measured in two different bag sizes using low
7
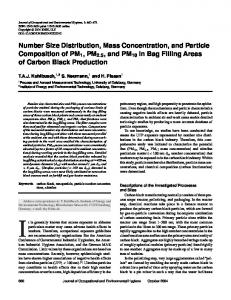
particle concentrations (of the order of 104 cm-3 or less) to effectively eliminate coagulation. The fitted curves in Figure 3 show distinctly the difference between particle deposition coefficients in the two bag sizes. The results support the expectation of higher deposition losses in the smaller bag due to the greater wall surface area to volume ratio.
Figure 3 Derived NaCl particle deposition loss coefficient as a function of particle diameter in two bag sizes (100 and 200 litre).
The potential impact of different sampling flow rates on particle loss in the 200 litre bag was examined using 20 nm NaCl particles, to represent nucleation mode particles (Figure 4). Results of these experiments showed that the particle loss rate due to deposition for these particles was independent of the sample flow rate and aerosol neutralization within the tested range of flow rates and experimental error.
8
Figure 4 Derived 20nm NaCl particle deposition loss coefficient as a function of sampling flow rate in the 200 litre bag.
5. Summary and Conclusions
In this study, particle losses in VelostatTM sampling bags, which are commonly used in aerosol sampling measurements, have been examined for NaCl aerosol. Particle losses in the range of 10 nm to 160 nm were measured and discussed with respect to the particle size, sampling flow rate, aerosol neutralization, bag size and storage time. The studied size range of particles is important because they comprise a large fraction of particle number concentrations in vehicle emissions. Laboratory based assessment of the method showed that the particle number deposition loss rate was significantly reduced when a larger bag is used. Decay in the observed particle number concentrations was less than 10% in the bags for short-term sample storage, about 5 minutes, which is sufficient to complete two SMPS scans for measuring size distribution of the sampled particles. Provided that the measurement begins immediately after sample capture, the resulting size distribution is not significantly affected by the storage, if the size distribution scans start with the smallest particle sizes. Therefore, the bag sampling technique can be used to accurately measure particle emissions (e.g. particle number and size distribution). The results of this study are relevant in exhaust plume studies, where a sample is briefly available for size distribution measurement or further air quality analysis. 9
Acknowledgments
The authors would like to thank Mr Jim Drysdale and Mr Bob Organ from the Faculty of Science Workshop, Queensland University of Technology for their efforts in making the PCD.
References
1. 2. 3. 4. 5. 6. 7. 8. 9. 10. 11. 12. 13. 14. 15. 16. 17.
E. R. Jayaratne, L. Morawska, Z. D. Ristovski and G. R. Johnson, Atmos Environ, 2005, 39, 6812-6821. D. B. Kittelson, J. P. Johnson, W. F. Watts, Q. Wei, M. Drayton, D. Paulsen and N. Bukowiecki, Diesel Aerosol Sampling in the Atmosphere 2000–01-2212, SAE, Washington, D.C., 2000. D. B. Kittelson, W. F. Watts and J. P. Johnson, Diesel Aerosol Sampling Methodology - CRC E-43, Technical Summary and Conclusions, University of Minnesota, Department of Mechanical Engineering, 2002. D. B. Kittelson, W. F. Watts and J. P. Johnson, J Aerosol Sci, 2006a, 37, 913-930. D. B. Kittelson, W. F. Watts, J. P. Johnson, J. J. Schauer and D. R. Lawson, J Aerosol Sci, 2006b, 37, 931-949. L. Morawska, Z. D. Ristovski, G. R. Johnson, E. R. Jayaratne and K. Mengersen, Environmental Science and Technology, 2007, 41, 574-579. D. R. Cocker, S. D. Shah, K. Johnson, J. W. Miller and J. M. Norbeck, Environmental Science & Technology, 2004, 38, (2182-2189. P. A. Baron and K. Willeke, Aerosol Measurement: Principles, Techniques, and Applications, Second Edition edn., John Wiley & Sons, New York, 2001. P. H. McMurry and D. J. Rader, Aerosol Sci Tech, 1985a, 4, 249-268. J. G. Crump, R. C. Flagan and J. H. Seinfeld, Aerosol Sci Tech, 1983, 2, 303-309. G. R. Johnson, M. Mazaheri, Z. D. Ristovski and L. Morawska, Environmental Science and Technology, 2008, 42, 4850-4856. M. Mazaheri, G. R. Johnson and L. Morawska, Environmental Science & Technology, 2009, 43, 441-446. 3M Worldwide, 3M ™ Velostat ™ Bag, http://www.3m.com/product/information/Velostat-Bag.html, Accessed 31 October, 2006. A. Lecinski, Journal of Applied Meteorology, 1980, 19, 895-897. G. Biskos, A. Malinowski, L. M. Russell, P. R. Buseck and S. T. Martin, Aerosol Sci Tech, 2006, 40, 97–106. D. S. Kim, S. H. Park, Y. M. Song, D. H. Kim and K. W. Lee, J Aerosol Sci, 2003, 34, 859-868. J. H. Seinfeld and S. N. Pandis, Atmospheric Chemistry and Physics: from Air Pollution to Climate Change, 2nd edn., John Wiley & Sons, Hoboken, New Jersey, USA 2006.
10