Ecological Informatics 5 (2010) 140–146
Contents lists available at ScienceDirect
Ecological Informatics j o u r n a l h o m e p a g e : w w w. e l s e v i e r. c o m / l o c a t e / e c o l i n f
Application of classification trees and support vector machines to model the presence of macroinvertebrates in rivers in Vietnam Thu Huong Hoang a, Koen Lock a,⁎, Ans Mouton a,b, Peter L.M. Goethals a a b
Ghent University, Laboratory of Environmental Toxicology and Aquatic Ecology, Belgium Research Institute for Nature and Forest (INBO), Brussels, Belgium
a r t i c l e Keywords: Bioassessment Ecological modelling River management
i n f o
a b s t r a c t In the present study, classification trees (CTs) and support vector machines (SVMs) were used to study habitat suitability for 30 macroinvertebrate taxa in the Du river in Northern Vietnam. The presence/absence of the 30 most common macroinvertebrate taxa was modelled based on 21 physical-chemical and structural variables. The predictive performance of the CT and SVM models was assessed based on the percentage of Correctly Classified Instances (CCI) and Cohen's kappa statistics. The results of the present study demonstrated that SVMs performed better than CTs. Attribute weighing in SVMs could replace the application of genetic algorithms for input variable selection. By weighing attributes, SVMs provided quantitative correlations between environmental variables and the occurrence of macroinvertebrates and thus allowed better ecological interpretation. SVMs thus proved to have a high potential when applied for decision-making in the context of river restoration and conservation management. © 2009 Elsevier B.V. All rights reserved.
1. Introduction Modelling running waters based on ecological knowledge and monitoring data has proven to considerably facilitate and improve the assessment of habitats and the determination of the relationship between environmental variables and the occurrence of certain organisms. The availability of reliable data and suitable modelling techniques, which are able to handle the nonlinear and complex nature of ecosystems, resulted in the development of models with a high reliability (Recknagel, 2006). Different modelling techniques have been applied to running waters, mainly focussing on the environmental responses of river communities to specific disturbances. Modelling the distribution of taxa as a function of the abiotic environment, often called habitat suitability modelling, has been recognised as a significant component of conservation planning (Austin, 1998, 2002; Guisan and Zimmermann, 2000). Artificial intelligence has played a crucial role in studying these relationships. More recently, a range of modelling techniques has been applied for the assessment of running waters based on the distribution of macroinvertebrates. Artificial neural networks (Hoang et al., 2001; Dedecker et al., 2007; Goethals et al., 2007), fuzzy logic (Adriaenssens et al., 2004a; Mouton et al., 2009), classification trees (Dzeroski et al., 2000; Goethals et al., 2002; Dakou et al., 2007) and Bayesian belief networks (Adriaenssens et al., 2004b) have proven to ⁎ Corresponding author. Ghent University, Laboratory of Environmental Toxicology and Aquatic Ecology, J. Plateaustraat 22, 9000 Gent, Belgium. Tel.: +32 9 2643996; fax: +32 9 2643766. E-mail address:
[email protected] (K. Lock). 1574-9541/$ – see front matter © 2009 Elsevier B.V. All rights reserved. doi:10.1016/j.ecoinf.2009.12.001
have a high potential in macroinvertebrate habitat suitability analysis, as they combine reliable classifications with transparency. Habitat suitability models aim to relate the presence or abundance of a species at a site to environmental variables that describe their general habitat. River management can benefit from such predictive models as decision support tools to improve the efficiency of monitoring and assessment, for example by choosing the most optimal restoration measure from a set of given river restoration scenarios by predicting the effect of these different scenarios on the habitat suitability (Guisan and Zimmermann, 2000). Support vector machines (Vapnik, 1995) belong to a generation of inductive modelling techniques that has been inspired by aspects of biological information processing. Multi-class problems are solved using pairwise classification with this technique (Witten and Frank, 2005). They have the ability to extract temporal or spatial patterns and to describe highly nonlinear and complex data. In the past few years, there has been a lot of interest in support vector machines (Vapnik, 1995; Burges, 1998; Keerthi et al., 2001) because they have yielded excellent generalization performance on a wide range of problems (Keerthi et al., 2001). SVMs produce very competitive results when compared with the best accessible classification methods and they need only the smallest amount of model tuning because there are only a few parameter settings that need to be adjusted (Decoste and Scholkopf, 2002; Guo et al., 2005). SVMs have yielded excellent generalization performance on a wide range of problems and have been successfully employed to solve many nonlinear regression and time series problems. However, there is still not much experience with or application of SVMs in ecology (Shan et al., 2006; Sanchez-Hernandez et al., 2007; Ribeiro and Torgo, 2008).
T.H. Hoang et al. / Ecological Informatics 5 (2010) 140–146
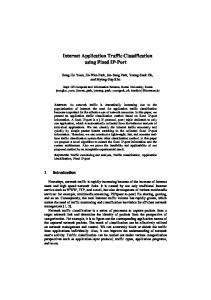
The aim of the present study was to develop models that could predict the presence of macroinvertebrates in the Du river in Vietnam using classification trees (CTs) and support vector machines (SVMs) and to compare the performance of both modelling techniques. These two techniques were chosen because they can both be used when only a small datasets is available. In addition, it was tested if input variable selection by genetic algorithms could improve model performance. The models developed in the present study will allow selection of important variables for river restoration and thus may provide critical information to support the implementation of integrated river management in Vietnam. More specifically, this kind of models can for example be used to select parameters that should be monitored, but they can also indicate priorities for river restoration and with the help of a cost–effect analysis, an integrated river management plan can be initiated. 2. Material and methods 2.1. Study area The Du river is one of the main tributaries of the upstream part of the economically important Cau river, which is one of the most polluted river basins in Vietnam. The Du river is a medium-sized river with a length of 44 km and a catchment area of 360 km2. It runs across populated areas and is impacted by domestic, agricultural and especially industrial (metal ore extraction) and coal mining activities at the Phan Me coal mine (Thai Nguyen DONRE, 2006). The river originates in the highland of Northern Vietnam and discharges into the Cau river basin in Son Cam. In the Du river basin, 15 sites were chosen for investigation (Fig. 1). The site selection was based on variations in natural characteristics as well as anthropogenic influences, while distribution over the entire river basin and accessibility were also selection criteria. 2.2. Data collection The 15 sites were sampled during seven campaigns from 2006 to 2008, which resulted in 104 instances, because one site was added after the first campaign. In total, 21 environmental variables were measured including habitat characteristics as well as chemical measurements.
141
The assessed habitat characteristics were altitude (m a.s.l.; topographical map 1/50,000), water temperature (°C), flow velocity (m/s), river width (m), river depth (m), Pool/Riffle (P/R) class and dominating riverbed substrate. Water temperature, water level, width and flow velocity were measured according to the AQEM guideline (AQEM, 2002). The Pool/Riffle pattern (P/R) class classifies the deep/ shallow variation of a site in categories from 1 (well developed) to 6 (absent), while the dominant substrate was identified visually. Chemical analysis included pH (OAKTON 35632), dissolved oxygen (WTW Oxi 330), conductivity, turbidity (WTW 249 electrode), COD (TCVN 6491:1999, ISO 6060:1989), BOD5 (closed bottle test, TCVN 6828:2001, ISO 10707:1994), Kjeldahl nitrogen in the water column and in the sediment (TCVN 5987:1995, ISO 5663:1984), − − (liquid chromatography, TCVN total phosphorus, PO3− 4 , N-NO2 , Cl 6494-2:2000 ISO 10304-2:1995), and total Fe (flame AAS method, TCVN 6193:1996, ISO 8288:1986) (Table 1). Macroinvertebrates were collected by kicksampling and identified up to family level, except Oligochaeta and Hydrachnida that were identified to class and suborder level, respectively. Presences or absences of the 30 macroinvertebrate taxa having the highest prevalence in the Du river were selected as output variables of the models. 2.3. Model development First, models were developed based on Classification trees (CTs) and Support vector machines (SVMs) using all 21 variables, while in a next step, these models were each combined with genetic algorithms (GAs), which were used to select the most relevant input variables. CTs predict the value of a discrete dependent variable with a finite set of values (class) from the values of a set of independent attributes (Quinlan, 1986). These attributes can be continuous or discrete variables. The ‘Top-Down Induction of Decision Trees’ (TDIDT, also called C4.5 algorithm) is one of the most widely used classification tree induction methods. Tree construction proceeds recursively starting with the entire set of training examples. At each step, the most informative attribute is selected as the root of the tree and the current training set is split into subsets according to the values of the selected attributes. For discrete attributes, a branch of the tree is typically created for each possible attribute value. For continuous ones, a threshold is selected and two branches are created based on that threshold. For the subsets of training
Fig. 1. Sampling sites in the Du river basin, Vietnam.
142
T.H. Hoang et al. / Ecological Informatics 5 (2010) 140–146
Table 1 Observed river characteristics in the Du river basin during the sampling period 2006–2008. Variable
Unit
Min
Max
Mean
Standard deviation
Altitude Pool/Riffle Flow Width Depth Dissolved oxygen pH Conductivity Turbidity Water temperature BOD5 COD Kjeldahl N NO− 2 -N Total P PO3− 4 -P Cl− Total Fe Total N sediment
m, a.s.l. category m/s m m mg/l – µS/cm NTU °C mg/l mg/l mg N/l mg N/l mg/l mg P/l mg/l mg/l mg/kg
106 1 0 0.63 0.05 1.0 3.10 0 0 14 2 2.7 0.1 0.01 0.002 0.001 3.9 0.014 0.11
380 5 0.95 28.9 0.95 9.2 8.36 660 441 36 20 82.1 14.8 0.78 5.65 0.37 42.6 27.00 4.98
217 2.9 0.27 7.51 0.29 6.7 6.93 250 40 25 8 23.7 3.2 0.08 0.64 0.08 17.1 2.30 1.20
81 1.3 0.21 6.54 0.16 1.4 1.15 120 93 5 3.7 15.2 2.2 0.13 0.85 0.09 6.9 4.04 0.94
examples in each branch, the tree construction algorithm is called recursively. Tree construction stops when all examples in a node are of the same class or if some other stopping criterion is satisfied. Such nodes are called leaves and are labelled with the corresponding values of the class (Quinlan, 1993). The J48 algorithm is a Java re-implementation of C4.5 and is a part of the machine learning package WEKA (Witten and Frank, 2005). In the current study, the J48 algorithm with binary splits was applied to induce classification trees. Standard settings were used except for pruning confidence factors (PCF). Tree pruning was applied to optimise model performance by changing confidence factor values. Models with different intensities of pruning were induced by changing the confidence factor into 0.01, 0.1, 0.25 and 0.5. The model training and validation were based on three-fold cross validation. SVMs implement Platt's sequential minimal optimisation algorithm for training a support vector classifier (Keerthi et al., 2001). This implementation replaces all missing values and transforms nominal attributes into binary ones. Multi-class problems are solved using pairwise classification (Witten and Frank, 2005). They consist of input and output layers connected with weight vectors. The arrangements of neurons in the input layer control the input vectors while the output layer comprises a two-dimensional network of neurons arranged on a hexagonal net. Support vector machines have been designed for two-class problems including positive and negative objects (Guo et al., 2005). SVMs can be used for classification and regression. A complete analysis of SVMs entails three steps: model selection, fitting and validation. The basic idea of SVMs is to transform the data in such a way that they become more or even completely linearly separable and subsequently to perform a linear separation or a kernel function for nonlinear separation. The maximum margin hyperplane is the one that gives the greatest separation between the classes. The instances that are closest to the maximum margin hyperplane are called support vectors. There is always at least one support vector for each class and often there are more. The set of support vectors uniquely defines the maximum margin hyperplane for the learning problem. The Platt's sequential minimal optimisation algorithm is also a part of the machine learning package WEKA (http://www.cs.waikato.ac.nz/ml/weka; Witten and Frank, 2005). The polynomial kernel was applied instead of a radial basis function (RBF). The parameter settings in the WEKA toolbox were default values except for the exponents of the polynomial Kernel. To obtain the optimal results regarding predictive performances, the SVMs were optimised based on the application of different exponents from one to five. The model with the best performing exponent was run five times after randomisation to check robustness and reproducibility.
To allow input variable selection, CTs and SVMs were combined with genetic algorithms (GAs). Genetic algorithms are general search algorithms inspired by Charles Darwin's principle ‘survival of the fittest’ to solve complex optimisation problems. In comparison with more traditional techniques, GAs are in general good to find the absolute minimum in a reasonable time on the basic of intelligent recombination (determined by the level of allowed cross-over) of the best intermediate models in combination with mutation to avoid getting trapped in local minima (Goldberg, 1989). A popular approach is the use of GAs as an optimisation tool for resetting the parameters in other classifiers such as SVMs and CTs, especially in the field of river ecology (D'heygere et al., 2006). The 21 input variables were presented to the GA as a chromosome to determine the important variables for the prediction of the presence/absence of 30 selected benthic macroinvertebrate taxa in the macroinvertebrate samples. CTs and SVMs were then constructed with variables, which were selected as driving variables for most abundant taxa, in order to improve the comprehensiveness of the CTs and performance of the SVMs (D'heygere et al., 2003). Paired Student's t-tests were conducted for the comparison of the predictive performance of models based on the J48 algorithm and support vector machines before and after selection of inputs by GAs. Performance criteria applied to evaluate the models were the percentage of Correctly Classified Instances (CCI) and the Cohen's kappa statistic (K; Cohen, 1960). CCI is calculated as the percentage of the true positive and true negative predictions. However, CCI is affected by the frequency of occurrence of the taxon being modelled (Fielding and Bell, 1997; Manel et al., 2001). K is therefore recommended to be used as a more reliable performance measure. K is a derived statistic that
Table 2 Macroinvertebrate taxa used for modelling based on classification trees (CTs) and support vector machines (SVMs) with and without Genetic Algorithms (GA), prevalence (%) and model performance quantified by percentage Correctly Classified Instances (CCI) and Cohen's Kappa (K). Classification trees
Support vector machines
No GA
With GA
No GA
With GA
Prevalence, %
CCI, %
K
CCI, %
K
CCI, %
K
CCI, %
K
44 25 31 57 19 65 51 61 39 37 18 64 62 65 72 21 15 57 21 26 49 54 69 25 51 40 46 12 34 39
61 73 64 74 80 77 64 76 67 75 80 75 74 73 83 81 86 76 76 72 60 70 79 76 59 67 66 94 63 77
0.22 0.04 0.12 0.44 0.24 0.48 0.28 0.48 0.28 0.46 0.04 0.38 0.44 0.34 0.51 0.34 0.34 0.51 0.13 0.02 0.21 0.40 0.43 0.34 0.17 0.32 0.32 0.67 0.14 0.53
64 74 69 79 82 79 69 73 67 73 82 77 79 78 84 85 88 73 78 74 67 69 82 80 61 78 64 95 64 78
0.26 0.01 0.24 0.55 0.25 0.51 0.38 0.35 0.29 0.43 0.00 0.40 0.54 0.42 0.54 0.49 0.39 0.45 0.04 0.00 0.35 0.37 0.49 0.45 0.22 0.53 0.27 0.71 0.02 0.54
71 81 83 77 84 82 70 74 73 71 81 75 82 76 84 82 85 74 81 75 73 72 81 75 72 80 67 91 67 76
0.42 0.36 0.59 0.53 0.26 0.58 0.40 0.43 0.40 0.35 0.19 0.38 0.59 0.41 0.53 0.33 0.50 0.46 0.31 0.17 0.46 0.44 0.49 0.25 0.44 0.57 0.34 0.58 0.20 0.49
70 80 79 73 82 80 66 76 64 69 80 74 81 77 82 82 85 71 80 73 70 74 80 78 64 78 65 91 70 74
0.38 0.31 0.49 0.45 0.13 0.55 0.33 0.47 0.24 0.30 0.03 0.32 0.56 0.42 0.43 0.33 0.00 0.40 0.29 0.11 0.41 0.46 0.42 0.32 0.28 0.54 0.31 0.55 0.30 0.46
Taxa
Oligochaeta Hirudinidae Glossiphoniidae Corbiculidae Corallanidae Pachychilidae Thiaridae Viviparidae Stenothyridae Planorbidae Lymnaeidae Palaemonidae Atyidae Parathelphusidae Chironomidae Mesoveliidae Aphelocheiridae Gerridae Veliidae Psephenidae Elminthidae Caenidae Baetidae Leptophlebiidae Hydropsychidae Gomphidae Coenagrionidae Amphipterygidae Libellulidae Corydalidae
T.H. Hoang et al. / Ecological Informatics 5 (2010) 140–146
measures the proportion of all possible cases of the presence or absence that are predicted correctly by a model after accounting for chance predictions. Models with CCI higher than 70% and K higher than 0.4 were considered reliable (D'heygere et al., 2006; Dakou et al., 2007; Goethals et al., 2007). Landis and Koch (1977) attempted to indicate the degree of agreement that exists when the Cohen's kappa is found to be in various ranges: ≤0 (poor); 0–0.2 (slight); 0.2–0.4 (fair); 0.4–0.6 (moderate); 0.6–0.8 (substantial); and 0.8–1 (almost perfect). 3. Results and discussion 3.1. Model performance Habitat suitability models were developed to predict presence/ absence of 30 selected macroinvertebrate taxa in the Du river. The optimal confidence level of pruning was different for models predicting the habitat suitability of different taxa. The value of PCF = 0.1 was the optimal confidence level for 24 out of 30 models constructed, exceptions were Hirudinidae, Lymnaeidae, Aphelocheiridae, Psephenidae, Veliidae and Libellulidae. This value was therefore
143
selected for further development of all CTs. SVMs were optimised based on the application of different exponents between one and five. The best performance was obtained using an exponent of one. In general, support vector machines performed significantly better (p b 0.001 for both CCI and K) compared to the classification trees (Table 2). According to the aforementioned CCI and K thresholds, only for 10 taxa, the presence/absence could be predicted reliably by the CTs. The SVMs, however, provided good prediction for 20 taxa in terms of both criteria CCI and K. The results illustrate the performance of models obtained by CTs and SVMs. The average CCI (±standard deviation) for both CTs (73 ± 8.1%) and SVMs (77 ± 5.7%) was higher than the criteria for good model performance. However, the mean value of K obtained by the CTs (0.32 ± 0.16) is lower than 0.4, while the mean value obtained by the SVMs (0.42 ± 0.12) is higher than this threshold. For 25 taxa, better predictions were obtained with SVMs, while only for Viviparidae, Mesoveliidae, Gerridae, Leptophlebiidae and Corydalidae, K was slightly higher for CTs. These results showed that even with a small dataset, support vector machines can provide a good predictive performance. Based on the CCI, the predictions of the presence/absence seemed satisfying for almost all families. However, lower values of K indicated
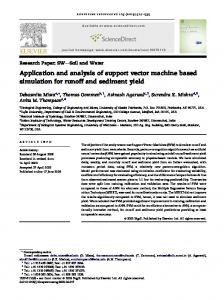
Fig. 2. Number of runs in which input variables were selected by classification trees with genetic algorithms (a) and number of times that input variables were selected as important in SVM models (b).
144
T.H. Hoang et al. / Ecological Informatics 5 (2010) 140–146
that the developed models were not as good as could be supposed based on the CCI values, because high CCI values can be achieved just based on chance when predicting taxa with a low prevalence (D'heygere et al., 2006). Except for Aphelocheiridae and Amphipterygidae, low values of K were obtained from the prediction of relatively rare taxa with a prevalence of less than 30%.
3.2. Optimisation by genetic algorithms A selection of the most relevant input variables is important to improve the predictive performance of the models (D'heygere et al., 2003, 2006). Genetic algorithms selected different inputs for different taxa. Results of input selection by the 3-fold cross validation for the 30 selected taxa are shown in Fig. 2. The number represents how many times of the five runs of the 30 predictive models (150 runs in total) a particular variable was considered relevant for the prediction of the occurrence of the macroinvertebrate taxa. Fig. 3 reveals that for the prediction of these selected macroinvertebrate taxa in the Du river, elevation, substrates, seasons, P/R class, water width, pH, BOD5, N-NO2 and total Fe were the most explanatory variables. These nine variables were subsequently used for the development of CTs and SVMs. Performances of both CTs and SVMs before and after input selection are shown in Figs. 3 and 4, respectively.
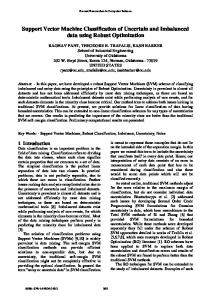
The results indicated that input selection by GA improved performance of the CTs according to both evaluation criteria CCI (mean CCI = 75.4 ± 7.9%) and K (mean K = 0.35± 0.17). Better performances were achieved by 24 models based on CCI but only by 20 models in terms of K. The performance of SVMs with these 9 selected input variables was better than that of CTs (mean CCI = 76 ± 6.4% and mean K = 0.35 ± 0.15). However, the performance was worse than that of the SVMs constructed for the whole set of input variables. This may be explained by the fact that elimination of inputs can result in the loss of meaningful information about the impact of environmental variables on macroinvertebrate occurrence. The selection of input variables by GA can thus be recommended for CTs as it improves their performance, however, because SVMs can better deal with a high number of variables, they need no input variable selection and doing so can even lead to a loss of meaningful information. 3.3. Weighing attributes Another advantage of SVMs is that these models provide attribute weights for all input variables. The attribute weights were different for each taxon. Fig. 2 indicates in how many cases each variable was the most important one in the model. A variable was considered important if it obtained an absolute weight value greater than 0.5. The variables considered most important include altitude, substrate, P/R
Fig. 3. Correctly Classified Instances (CCI) (a) and Cohen's kappa (b) of classification trees for 30 modelled benthic macroinvertebrate taxa before (dashed bars) and after (black bars) variable selection.
T.H. Hoang et al. / Ecological Informatics 5 (2010) 140–146
145
Fig. 4. Correctly Classified Instances (CCI) (a) and Cohen's kappa (b) of support vector machines for 30 modelled benthic macroinvertebrate taxa before (dashed bars) and after (black bars) variable selection.
class, flow velocity, water width, pH, Total Fe, BOD5 and N-NO− 2 . Compared to the inputs selected by GA, SVMs provided similar result, with flow velocity as an exception, which could be in fact an important driving variable. Consequently, these weights may provide useful information to relate the presence of macroinvertebrates to the water quality, because driving variables can be derived and ecological meaningful information can be extracted for practical application in river management.
3.4. Applications CTs have been applied previously for practical applications in water management (D'heygere et al., 2002; Goethals et al., 2002; Dakou et al., 2007). These studies also illustrated that CTs with GA application can be a useful tool for water management. SVMs could be even more suitable to get insight in the effect of environmental variables because they are able to simultaneously assess the effect of all driving variables on the presence/absence of macroinvertebrates, while CTs only consider one variable at each branch of the tree. This advantage makes SVMs also potentially useful to support river restoration and conservation strategies. More detailed studies on specific macroinvertebrate taxa may also provide better insight in environmental impacts because proper and sound ecological studies are the best basis for successful ecological modelling.
In the present study, several key parameters were indicated by CTs and SVMs. Parameters such as altitude, flow velocity and water width are of course related to the position in the watershed: less affected upstream sites contain more taxa, whereas more degraded downstream sites contain less taxa. Due to metal extractions workshops, two sites were characterised by a very low pH and high metal concentrations and therefore hardly contained any macroinvertebrate taxa, which explains the importance of these parameters in the models. Sanitation of these point sources is therefore needed to restore the water quality at these sites. Finally, also BOD and nutrient concentrations were key factors affecting the presence of macroinvertebrates. Therefore, wastewater treatment should be performed in densely populated areas, while the installation of riparian buffer zones can help to decrease agricultural runoff. 4. Conclusion The present study developed models to explore the habitat suitability of 30 macroinvertebrate taxa in the Du river in Northern Vietnam. Performance of the SVMs and CTs were compared, both with and without genetic algorithms. The results of the present study revealed that the developed models using SVMs outperformed CTs and the provided attribute weights of SVMs may be a suitable alternative to GAs to select input variables. Monitoring strategies should at least include these selected input variables, because these
146
T.H. Hoang et al. / Ecological Informatics 5 (2010) 140–146
key variables indicate if favourable habitat conditions are present for macroinvertebrates. Comparison between monitoring results of sites with similar physical habitat conditions can indicate the pollution status of these sites. Moreover, detailed studies on specific macroinvertebrates may improve insight into the complex relation between the occurrence of macroinvertebrate and environmental impacts. The results of this study suggest that SVMs allow to reveal the key variables to predict macroinvertebrate occurrence and may be a promising tool for river management. Acknowledgements This research was undertaken with financial aid from the Belgian Technical Cooperation (BTC). Koen Lock is currently supported by a post-doctoral fellowship from the Fund for Scientific Research (FWOVlaanderen, Belgium). The authors also acknowledge the R&D Lab on Environmental Technology in Hanoi University of Technology for the facilities and the technical help during monitoring and analytical work. All experiments comply with the current laws of Vietnam. References Adriaenssens, V., De Baets, B., Goethals, P.L.M., De Pauw, N., 2004a. Fuzzy rule-based models for decision support in ecosystem management. Sci. Total Environ. 319, 1–12. Adriaenssens, V., Goethals, P.L.M., Charles, J., De Pauw, N., 2004b. Application of Bayesian belief networks for the prediction of macroinvertebrate taxa in rivers. Ann. Limnol.-Int. J. Limnol. 40, 181–191. AQEM Consortium, 2002. Manual for the application of the AQEM system. A Comprehensive Method to Assess European Streams Using Benthic Macroinvertebrates, Developed for the Purpose of the Water Framework Directive. Version 1.0. Project report. www.aqem.de. Austin, M.P., 1998. An ecological perspective on biodiversity investigations: examples from Australian eucalypt forest. Ann. Mo. Bot. Gard. 85, 2–17. Austin, M.P., 2002. Spatial prediction of species distribution: an interface between ecological theory and statistical modelling. Ecol. Model. 157, 101–118. Burges, C.J.C., 1998. A tutorial on support vector machines for pattern recognition. Data Min. Knowl. Disc. 2, 121–167. Cohen, J., 1960. A coefficient of agreement for nominal scales. Educ. Physiol. Meas. 20, 37–46. Dakou, E., D'heygere, T., Dedecker, A.P., Goethals, P.L.M., Lazaridou-Dimitriadou, M., De Pauw, N., 2007. Decision tree models for prediction of macroinvertebrate taxa in the river Axios (Northern Greece). Aquat. Ecol. 41, 399–411. Decoste, D., Scholkopf, B., 2002. Training invariant support vector machines. Mach. Learn. 46, 161–190. Dedecker, A., Van Melckebeke, K., Goethals, P.L.M., De Pauw, N., 2007. Development of migration models for macroinvertebrates in the Zwalm river basin (Flanders, Belgium) as tools for restoration management. Ecol. Model. 203, 72–86. D'heygere, T., Goethals, P.L.M., De Pauw, N., 2002. Optimization of the monitoring strategy of macroinvertebrate communities in the river Dender, in relation to the EU Water Frame Directive. Sci. World J. 2, 607–617.
D'heygere, T., Goethals, P.L.M., De Pauw, N., 2003. Use of genetic algorithms to select input variables in decision tree models for the prediction of benthic macroinvertebrates. Ecol. Model. 160, 291–300. D'heygere, T., Goethals, P.L.M., De Pauw, N., 2006. Genetic algorithms for optimisation of predictive ecosystem models based on decision trees and neural networks. Ecol. Model. 195, 20–29. Dzeroski, S., Demsar, D., Grbovic, J., 2000. Predicting chemical parameters of river water quality from bioindicator data. Appl. Intell. 13, 7–17. Fielding, A.H., Bell, J.F., 1997. A review of methods for assessment of prediction errors in conservation presence/absence models. Environ. Conserv. 24, 38–49. Goethals, P.L.M., Dedecker, A.P., Gabriels, W., De Pauw, N., 2002. Development and application of predictive river ecosystem models based on classification trees and artificial neural networks. In: Recknagel, F. (Ed.), Ecological Informatics: Understanding Ecology by Biologically-Inspired Computation. Springer-Verlag, Berlin, pp. 91–107. Goethals, P.L.M., Dedecker, A.P., Gabriels, W., Lek, S., De Pauw, N., 2007. Applications of artificial neural networks predicting macroinvertebrates in freshwaters. Aquat. Ecol. 41, 491–508. Goldberg, D.E., 1989. Genetic Algorithms in Search, Optimisation and Machine Learning. Addison-Wesley Publishing Company, Reading, MA. 412 pp. Guisan, A., Zimmermann, N.E., 2000. Predictive habitat distribution models in ecology. Ecol. Model. 135, 147–168. Guo, Q., Kellya, M., Graham, C.H., 2005. Support vector machines for predicting distribution of Sudden Oak Death in California. Ecol. Model. 182, 75–90. Hoang, H., Recknagel, F., Marshall, J., Choy, J., 2001. Predictive modelling of macroinvertebrate assemblages for stream habitat assessments in Queensland (Australia). Ecol. Model. 146, 195–206. Keerthi, S.S., Shevade, S.K., Bhattacharyya, C., Murthy, K.R.K., 2001. Improvements to Platt's SMO algorithm for SVM classifier design. Neural Comput. 13, 637–649. Landis, J.R., Koch, G.G., 1977. The measurement of observer agreement for categorical data. Biometrics 33, 159–174. Manel, S., Williams, H.C., Ormerod, S.J., 2001. Evaluating presence–absence models in ecology: the need to account for prevalence. J. Appl. Ecol. 38, 921–931. Mouton, A.M., De Baets, B., Goethals, P.L.M., 2009. Knowledge-based versus data-driven fuzzy habitat suitability models for river management. Environ. Model. Softw. 24, 982–993. Quinlan, J.R., 1986. Induction of decision trees. Mach. Learn. 1, 81–106. Quinlan, J.R., 1993. C4.5: Program for Machine Learning. Morgan Kaufmann Publishers, San Francisco. 302 pp. Recknagel, F., 2006. Ecological Informatics: Understanding Ecology by BiologicallyInspired Computation. Springer-Verlag, Berlin. 496 pp. Ribeiro, R., Torgo, L., 2008. A comparative study on predicting algae blooms in Douro River, Portugal. Ecol. Model. 212, 86–91. Sanchez-Hernandez, C., Boyd, D.S., Foody, G.M., 2007. Mapping specific habitats from remotely sensed imagery: support vector machine and support vector data description based classification of coastal saltmarsh habitats. Ecol. Inform. 2, 83–88. Shan, Y., Paull, D., McKay, R.I., 2006. Machine learning of poorly predictable ecological data. Ecol. Model. 195, 129–138. Thai Nguyen Department of Natural Resources and Environment (DONRE), 2006. Report on Environmental Status in Thai Nguyen Provinces 2004–2005. Thai Nguyen. 138 pp. Vapnik, V., 1995. The Nature of Statistical Learning Theory. Springer-Verlag, New York, NY. 187 pp. Witten, I.H., Frank, E., 2005. Data Mining: Practical Machine Learning Tools and Techniques (Second Edition). Morgan Kaufmann Publishers, San Francisco. 371 pp.