Towards Parallel Application Classification using Quantitative Metrics Alexander S. van Amesfoort
Ana Lucia Varbanescu
Department of Software Technology, Delft University of Technology, 2628 CD Delft, The Netherlands
[email protected] [email protected]
Henk J. Sips
[email protected]
Keywords: parallel programming, application characterization, performance behavior
Abstract When computer architects re-invented parallelism through multi-core processors, application parallelization became mandatory. The challenge of “mass-parallelization” forced the software community to react quickly. Unfortunately, instead of tackling such a large-scale problem in a systematic way, we have rather experienced various random search, non-portable and non-reusable approaches. We believe that the way to effectively address the problem is to limit its scale by splitting the potentially infinite application space into a limited set of application classes. This idea is not entirely new, as a similaritybased taxonomy has been recently proposed. However, in this paper, we purpose a different approach that focuses on a mostly quantitative application characterization. We introduce a set of metrics to characterize applications and we show how they can be evaluated for three case-studies. Once a wide range of applications have been characterized, we can identify a limited number of application classes. Next, for these classes, dedicated programming tools can be used to write high-performance parallel software in a productive way.
1
Introduction
As an answer to the constant requests for increased performance, computer architects re-invented parallelism, this time by embedding multiple programmable cores on a single chip. As a consequence of this direction, application parallelism became mandatory. Faced with a large-scale problem - virtually every application will have to be parallel sooner or later - the software community came up with various solutions for specific cases, but a systematic, generalized approach has not appeared, and we see no convergence on the horizon.
Therefore, we propose to tackle the problem differently, using a systematic approach that starts with a very pragmatical question: how many different applications will be out there? Is it really impossible to split them into a limited number of classes? We believe, like others [1], that the entire space of parallel applications can be split into a limited number of classes. We argue that once this classification is in place, the parallel programming community can focus on developing dedicated tools for each class, leading to efficient parallel execution and simpler programming. Such a classification could also allow for a (semi-)automatic methodology for choosing “the right platform” for a given application, replacing the educated-guess practices used now. Thus, we propose a systematic, three-phase approach to parallel programming. First, a new application has to be analyzed and fitted into the right class. Second, using class-specific tools and algorithms, the application is parallelized for one or several hardware platforms. Finally low-level, hardware specific optimizations can be manually applied to boost performance further, if needed. To make this approach feasible, we need practical answers to four fundamental questions: (1) What application classes are available, and what are their characteristics? (2) How does an application specification fit into a class? (3) Which programming templates must be provided to properly cover the application classes and how are they combined? (4) How can one choose the best algorithm when given an application specification? Note that the first two questions address application analysis, while the last two address parallel application design and implementation. Consequently, the last two questions can only be answered reliably once consensus emerges on (some) application classification.
1.1
Related Work
Classification of parallel applications has been very superficial for a long time. For example, functional classifications, directly inherited from the classification of sequential algorithms (e.g. parallel sorting or searching), are incomplete and too coarse for our purposes. Classifications based on implementation methods, such as backtracking or divide-andconquer, associate an application with a method (and, consequently, to a class) by a more or less arbitrary choice for its implementation. As we look for ways to methodically choose a method based on application behavior, this approach is rather a validation than a starting point for our reasoning. Application domain classifications, like embedded systems, streaming, general-purpose, or high-performance computing (HPC), mainly restrict application requirements without really characterizing it. Although sane, and used for years to classify parallel applications, these “traditional” approaches do not fulfill the requirements for our application characterization because (1) they are too coarse-grain to capture the multiple parallelism layers of multi-core processors, and (2) they are not specific enough to derive disjoint classes that can be solved with dedicated programming patterns and/or strategies. A novel classification, much closer to these goals, is presented in [1], where a similarity-based taxonomy of applications has been proposed. While this sounds plausible, it is unclear to us how complete, redundant, or overlapping these classes are. Furthermore, given the complexity of some of the identified patterns, it is also unclear if there is a systematic way for “pattern matching” a new application into the correct class. This effort continues into studies on patterns. A pattern is a commonly encountered problem with an by experts agreed on solution along with descriptions when the pattern applies. A collection of closely related patterns that provide solutions to parallelization can be defined in a pattern language for parallel programming, such as OPL [2, 3]. Since then, a large number of patterns are being identified, but the way to select patterns based on evaluating trade-offs (balancing forces) is somewhat under-covered. A qualitative pattern selection [4] was looked into with many relations other than performance behavior. Also arguing towards a more structured approach, an article recently appeared [5] that proposes a programming model based on patterns with some analogies drawn to the the structured programming developments in the 1960s and 1970s. It features seven “parallel computation patterns” (operations on data values), and six “parallel data management patterns” (organize access to data). This bottom-up approach is closer to actual implementation, rather than identification of (abstract) problems, solutions and trade-
off evaluations. It may be more pragmatic, but we are not yet convinced it covers all parallelization issues, especially at the architecture and design levels. More fine-grained approaches to classify applications close to program execution can be found in the area of workload characterization [6]. The communication patterns of various message passing applications were already studied a long time ago [7] and can provide support for the definition of communication metrics. Another long-standing area of application/platform study using performance metrics is in early design space exploration for embedded system. There have been many embedded system design studies based on instrumentation-based profiling to design optimal hardware for a narrow set of applications. However, workload studies analyze application behavior on specific platforms where the application is already implemented and optimized. Our approach aims at higher abstraction levels, when the application is still in the design or even architecture phase. We propose an alternative, metricbased application classification, independent of hardware platform properties. Our application characterization is based on evaluating a set of quantitative metrics that capture and differentiate application behavior at different layers of granularity. Different application classes are defined by their members, and are disjoint by construction. Later on, different behavior classes should be associated with suitable algorithms, parallelization strategies, and hardware platforms. Closer to our approach was the “Application Performance Characterization Project” (Apex). It is geared towards hardware independent scientific application characterization focussing on data accesses [8]. Once characterized, the obtained parameters can be fed into a synthetic benchmark to simulate performance behavior on various platforms. Especially of interest to us are the from our metrics differing (quantitative) metrics in their characterization approach, such as spatial and temporal locality, and register pressure (among others). Following this introduction, we discuss the context of our study, present our metrics, and demonstrate them on a few case studies.
2
Application Characterization
For our characterization, we are looking for application features that impact the way we solve, parallelize, implement, and optimize a given problem specification.
2.1 Application Hierarchy For the sake of our discussion, we introduce a set of loose terminology definitions. • An application specification is a tuple of (1) a
Application Specification
L1: Problem Description
Domain Algorithm A
L2: Algorithm Description
L3: High Level Architecture
L4: Program Design
L5: Implementation
Domain Algorithm B
Domain Algorithm C
Arch. A.2
Arch. A.3
Arch. A.1
Design A.2.1
A.2.2.a
A.2.2.b
Design A.2.2
A.2.2.c
Design A.2.3
Final Impl.
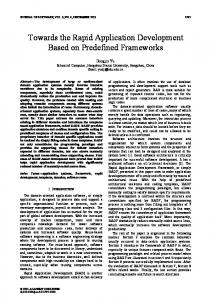
Figure 1: A tree-like approach for parallel application development
problem to solve computationally, (2) representative input data sets or their properties, and (3) the performance requirements (throughput- and latency-wise). • A domain algorithm is the (mathematical) algorithm designed by domain experts that solves the problem. • A (parallel) architecture is a sketch outlining the high-level structure of a program as a composition of computational units (tasks). Each task has to be recursively decomposed until wellknown computational units appear to expose the architecture and parallelism opportunities at all application granularity layers. This may resemble a (hierarchical) dependency graph, but for some tasks dependencies become only known at run-time (Section 2.2). • A (parallel) design describes how tasks at various layers will be implemented, including which parallelism will be exploited in what way, and which data structures will be used. Agglomerating tasks and data with optimal locality happens bottom-up. During design each architectural layer can be mapped to a layer in the hardware platform hierarchy and scheduling policies can be selected. • A (parallel) implementation is a translation of a design into code, possibly with test routines to verify output correctness and performance. To further optimize performance, problem and/or hardware specific optimizations can be applied. Figure 1 shows the multi-level parallel problem solving tree. In principle, a node can have infinite alternatives to consider. Application classification limits the choices, mostly at the architectural level, by first fitting (tasks of) a new application into a class of similar applications, such that then the same solution as
appropriate for a known class representative can be selected. Characterization using quantitative metrics is intended to evaluate trade-offs at the design level, such that the right alternative can be selected there as well. In our opinion, these ways to systematically navigate through the solution space fit well into the ongoing pattern (language) studies. The border between the field of the problem and computer science lies between the algorithm and architecture levels. However, be aware that the selection of an algorithm at the domain level already can have a profound impact on the performance of the final solution. Some algorithms imply program behavior that simply cannot be executed efficiently on modern hardware. This can be hard to predict for domain experts. In particular, conventional algorithmic descriptions focus on computation, not on data. With a good understanding of the performance impact of various characteristics, computer scientists should push this knowledge to domain experts. For the remainder of this paper, we focus on finding a set of suitable metrics that could guide a systematic search.
2.2 Characterizing Applications with Irregularities Metric evaluation is substantially harder for applications with irregularities, because behavior becomes only apparent at run-time and depends on input data and possibly on scheduling decisions. However, systematic development is just as important for irregular programs when high-performance is required. This means that the input data must be analyzed, or a simplified version of a task must be simulated on representative input data to retrieve (a profile of) run-time behavior. Behavior analysis may indicate the type of load balancing that is needed, where major optimizations opportunities lie, or that two separate designs for a task or execution phase must be made, something that is otherwise hard to conclude early on. However, one must be careful not to propose too complicated analysis, especially at lower granularity layers, as otherwise the possible performance impact to the entire application is too low to warrant the work. We distinguish three types of irregularities that an application can (all) have, differing in amount of analysis to evaluate metrics. Input data values can influence: • whether operations must be executed (at all or again). An important goal here can be to improve result precision (e.g. in an iterative solver). • which data is transferred (equivalent to from/to which location). This occurs when having variable length input or output (e.g. in compression or in sparse linear algebra computations).
• dependencies between work units (e.g. in parallel graph operations in discrete event simulation). Since dependencies are so vital to parallel execution and locality, this is the most difficult type of irregularity that needs most care [9].
3
performed at a specific granularity layer, but the metric set can be used to characterize at any layer. Most of the metrics we define are not entirely new, but they have not yet been grouped and used as a system for application classification or quantitative design tradeoff.
Metrics
We first discuss metric definition considerations, followed by the descriptions of our metrics.
3.1
Metric Set Definition Considerations
A metric expresses an application property highly relevant to execution speed for some (parallel) programs. The set of metrics has been created with the following considerations in mind. • Each metric characterizes a single property only and different metrics do not cover closely related or “sub-classes” of the same property. • Each metric is evaluated without taking hardware platform properties into account. • It must be clear how each metric can be estimated or measured. It may seem appealing to estimate in terms of input parameters (e.g. size), but we rather specify and estimate with constants or a range. • To be able to make design trade-offs, we are pushing for quantitative metrics. • Each metric should be defined such that they are applicable at multiple granularity layers. In that way, quantities established at lower layers can be aggregated to higher layers where they can also be used to make trade-offs. • For each metric, there is a platform “countermetric” to determine application-to-platform “fit” by comparing supply and demand. For some comparisons, multiple metrics and platform properties must be combined first. This paper focuses exclusively on the application side, so we will not compare to platform metrics. As more and more applications are being characterized, uncaptured properties or sub-optimal metric specifications can be resolved. For application classification in particular, we expect that we need to capture more qualitative properties that do not have a platform counter-metric.
3.2
Our Set of Metrics
In the following paragraphs, we introduce eleven metrics in the categories Computation, Communication, and Synchronization. Each characterization is
3.2.1 Computation On the computation side we propose four metrics that concentrate on type, amount and size of the computations. Available Concurrency (Conc) is defined as the number of independent computations that may execute in parallel. This can be any type of parallelism, used for any purpose, such as running in parallel or to overlap communication stalls. Designs may sequentialize independent work items to improve other metrics at the cost of a lower Conc. Conc can be a dynamic metric, as the Conc of an algorithm varies with time due to input data and scheduling decisions. To show available concurrency in irregular applications, a profiling simulation can be used. Arithmetic Intensity (AI) [10], measured in operations per byte, is a measure of data processing locality. At lower granularity layers, AI is estimated by dividing the number of arithmetic operations by the external reads/writes they require. At more abstract layers, the AI can be derived from lower layers or derived from the algorithm itself, e.g., single precision matrix addition has an algorithmic AI of 1/12. Many applications have an inherent upper bound to AI, as they do not combine more data with some data element when scaling up the input size. This upper bound can sometimes already be determined from the domain algorithm, for example, a particle simulation that models the effect of gravity inherently has an AI that scales with the number of particles, while modelling the effect of collisions has it only up to some degree. Platforms limit AI by the size of local memories up to the assessed level, and by the amount of external, new reads and final writes (compulsory transfers). Operation mix (OpM ix) is a metric to characterize instruction throughput bound kernels, where it can be applied to express the ratios between the types of performed operations. Other metrics being equal, implementations that require more operations of a certain type than the platform provides natively will perform worse. A mix that makes sense can be chosen based on the application. A typical mix is based on the distinction that most programming languages and hardware architectures already make, such as integer arithmetic/logic, data-dependent conditional
branches, and floating point. More detailed classification could be used to distinguish between single and double precision floating-point operations.
Memory Footprint (M emF t) of a task is the amount of (local) memory in bytes the unit needs to operate. It may be specified as a list or range of values, but always with a maximum. Tasks must always fit in memory. To estimate M emF t for a node, one has to sum the sizes of the input and output data buffers, as well as the sizes of the other local buffers/variables. At the implementation level, these sizes are mostly known, and therefore M emF t is easier to compute. At the algorithm level, however, theoretical estimates are acceptable. Note that M emF t(node) has a crucial role in mapping the application onto a given platform, and inaccurate estimates may lead to significant (useless) efforts in algorithm redesign.
3.2.2 Communication The Communication metrics characterize the access patterns of communication and are also applicable at any granularity layer. We consider reading/writing data from/to memory, other nodes, or storage (I/O) all as a form of communication that can be characterized by the same metrics. At the lower layer this involves memory transfers. At higher layers it involves transfers to distributed memory in the same node, or to other nodes over a local or wide-area network. It is important to characterize access patterns, because different access patterns have radically different transfer efficiency. Different message types (functionalitywise) should be characterized separately. Typically, there are not that many different message types per granularity layer. Estimates can be a (list of) value(s) or a range. The unit of measurement is in values of the data type that the application operates on. We treat synchronization operations separately in other metrics, so their small transfers can be ignored here. Count (Cnt) indicates the number of transfers for this type. Direction (R/W ) indicates the direction of transfer, read, write or both (update). Length (Len) indicates transfer length (in values). Small transfers are often inefficient, especially at higher layers. To determine Len, non-contiguous but nearby transfers can be considered as one large transfer. If a value range is used, it must have a maximum. Aggregating all read and write sizes into totals and a read/write ratio can be useful derived metrics. Alignment (Align) indicates if accesses are aligned naturally. Natural alignment is specified with 0, while mis-alignment is specified in bytes.
3.2.3 Synchronization Actual contention cannot be characterized purely by application metrics, as the amount of contention is also influenced by all kind of hardware properties. We propose the following three metrics on the application side. Local Synchronizations (LSyncs) specifies the number of local synchronization operations covering read-after-write hazards and local barrier synchronizations (rare). Global Synchronizations (GSyncs) specifies the number of synchronization operations performed by all units of execution covering read-after-write hazards and explicit and implicit barrier synchronizations. Global synchronization is costlier than multiple local synchronizations with the same number of nodes, and therefore deserves a separate metric. Update Conflicts (U pdCf ) specifies how many concurrent data updates at conflicting locations need to be serialized. To estimate U pdCf , count the number of values from independent work items (as counted in Conc) that are used to update conflicting storage locations. Write conflicts should be avoided in hot spots, because they are tough to handle efficiently and thus drastically degrade scalability. Locations (often) written to by multiple threads should be either partitioned, or replicated followed by a reduction.
4
Demonstrating the Metrics
In this section, we demonstrate how the proposed set of metrics can be evaluated for three examples: Radio Astronomy Correlation, Successive OverRelaxation, and Histogram Generation. Since we do not yet have characterized enough applications for a full classification, we show the metric evaluations in various ways and at various layers. We also list the derived metrics T otOps for the total number of computational operations, and T otComm for the total amount of communication in bytes. Dividing the two gives the AI.
4.1 Case Study 1: Correlation
Radio Astronomy
In radio-astronomy, signals from multiple antennas have to be cross-correlated. This involves one single precision complex multiplication on a data sample with a conjugated data sample, and integration of hundreds (here 768) of results over time. There are four combinations of two polarizations to process, and many thousands of frequency bands (here 16384).
Correlation is performed between all pairs of stations (“baselines”) (here 64). Application context and implementation details are described in [11]. Table 1 shows the characterization of the correlator at the highest layer. The M emF t is based on having all input and output data in memory, but a smaller size is plausible when streaming different channels into different memories; the AI stays the same. The input chunks are per channel, the output chunks per baseline. Briefly in words, we characterize correlation as a streaming application, that features lots of independent, single precision multiply and add operations in various granularities. The main parallelization challenges are mapping, streaming while computing, and at lower layers, register/cache blocking.
4.2
Case Study 2: Successive OverRelaxation (SOR)
SOR is an iterative solver algorithm, derived from the Gauss-Seidel method, to solve a linear system of equations with fast convergence. For this example, we study a red/black algorithm variant, where computations operate on the grid in a checkerboard pattern. Each round, first the red and then the black values are refined in two separate sweeps, followed by a termination check that checks if the global, maximum refinement difference is below a certain threshold. A value is refined using 9 double precision floating point operations on itself and four opposite color neighbor values. For this example, we choose a grid size of 4096 × 4096 points, partition the grid among eight nodes and claim to have found out that in most cases our algorithm terminates after 5 rounds. Every update sweep is preceded by boundary row exchanges between two neighbor nodes. Other communication is in initial data distribution from and final collection to a single node. We execute the refinement computations per tile and show both layers: the partition refinement layer in Table 2 mapped to a node, and the tile refinement layer in Table 3, where we choose a tile size of 34 kB (64 × 64 plus 256 edge doubles). Compared to the amount of floating point math, the single data dependent branch is too insignificant to show up in the OpM ix. If the grid data would be generated and the solution required in a distributed way, the AI of the upper layer would be 14.4. The AI upper bound at the lower layer is 1.125 (9 ops per 8 bytes). Briefly in words, we characterize SOR as a grid based numerical solver with a regular, 2D stencil access pattern. If the number of iterations is small, data distribution and collection dominate. Otherwise, the way the stencil operation is defined limits the AI severely.
4.3 Case Study 3: Histogram Generation To generate a histogram from a number of values, the index of the target bin has to be computed for every input value (here 4 byte integer) using one division. Then the corresponding bin counter can be incremented. In this example we have 100 M integers (of 4 byte each), 256 bins, and we claim that we cannot find a pattern in the input such that by partitioning the input we can avoid the bulk of the update conflicts. We characterize three parallel designs at the complete application layer: the default shared bins design in Table 4, the replicated bins design in Table 5 that also needs to sum the replicated bins (Table 6), and the partitioned bins design in Table 7. For the first two cases we partition the input; when partitioning the bins all executions work on all input values also checking if an input value will be processed elsewhere. Briefly in words, we characterize histogram generation as a statistics application with little computation, where the main parallelization challenge lies in getting around the data-dependent write conflicts. When all bins are replicated with a final summing phase, less communication is required to load the data. However, if (portions of the) input data can be efficiently shared (e.g. on-chip), partitioning all bins may be just as fast and is easier to implement.
5
Conclusions and Future Steps
Parallel programming has become a necessity when multi-core processors have emerged as the solution for the multiple walls that computer architects kept hitting. Therefore, productivity and efficiency of parallel programming must be improved, or else we will be unable to exploit the new multi-core platforms, wasting time and performance. Businesses and consumers will simply stop investing in “faster” equipment that does not run their applications faster than what they already have. We believe that high-performance application development requires specialized toolchains. For that, one has to first analyze which application classes need to be supported and how their behavior can be characterized. To analyze application characteristics, we proposed a metrics-based methodology. Essentially, we show how the major application features that influence performance can be captured by evaluating a small set of metrics. After evaluating these metrics for a large number of applications, an application classification can be extracted, that can be used to devise specialized tools that exploit specific application behavior. Our current work is focused on characterizing as many applications as possible. Once we reach the critical mass for a few application classes, we aim to extract those characteristics that make classes sig-
Table 1: AI 219 R/W R W
Characterization of correlation at the top layer OpM ix M emF t T otOps T otComm 0:0:1 7 GB 1.5 T 7 GB Len Align LSyncs 384 kB 0 0 256 kB 0
T ransf er input output
Conc 256 M Cnt 16384 4096
GSyncs 0
U pdCf 0
T ransf er grid distr xchg rows xchg rows grid collec
Table 2: SOR characterization at the partition refinement layer Conc AI OpM ix M emF t T otOps T otComm 512 0.54 0:0:1 16 MB 18 M 33.25 MB Cnt R/W Len Align LSyncs GSyncs 1 R 16 MB 0 10 5 20 R 32 kB 0 20 W 32 kB 0 1 W 16 MB 0
U pdCf 0
T ransf er tiles in tiles out
Conc 4096 Cnt 66 66
T ransf er input bins
Conc 100 M Cnt 1 1–100M
T ransf er input bins
Table 3: SOR characterization at the tile refinement layer AI OpM ix M emF t T otOps T otComm 0.53 0:0:1 34 kB 36 k 68 kB R/W Len Align LSyncs GSyncs R 528 B 0 0 0 W 528 B 0 Table 4: Histogram generation using shared bins AI OpM ix M emF t T otOps T otComm 0.17 1:0:0 400 MB 200 M 400MB–1200MB R/W Len Align LSyncs R 400 MB 0 0 RW 4B 0
U pdCf 0
GSyncs 0
Table 5: Histogram generation using replicated bins - binning Conc AI OpM ix M emF t T otOps T otComm 100 M 0.5 1:0:0 400 MB 200 M 400 MB Cnt R/W Len Align LSyncs GSyncs 1 R 400 MB 0 0 0 2 RW 256 B 0
U pdCf 0–100M
U pdCf 0
Table 6: Histogram generation using replicated bins - summing
T ransf er input output
Conc 256 Cnt nprocs 1
AI 0.125–0.25 R/W R W
OpM ix 1:0:0 Len 4B–1MB 8B–2MB
M emF t 8B–2MB Align 0 0
T otOps 256*nprocs
T otComm 1024*nprocs LSyncs 0
GSyncs 1
U pdCf 0
Table 7: Histogram generation using partitioned bins
T ransf er input bins
Conc 100 M Cnt nprocs 1
AI 0.75–0.5 R/W R W
OpM ix 1:0:0 Len 400 MB 4B–1MB
M emF t 400MB Align 0 0
T otOps 300 M
T otComm 400MB–nprocs*400MB LSyncs 0
GSyncs 0
U pdCf 0
nificantly different, and use those (1) to “fit” applications to suitable hardware platforms, and (2) design toolchains/frameworks for effective application development.
6
Acknowledgments
This work was funded by NWO-STARE and STWProgress.
References [1] Krste Asanovic, Rastislav Bodik, James Demmel, Tony Keaveny, Kurt Keutzer, John Kubiatowicz, Nelson Morgan, David Patterson, Koushik Sen, John Wawrzynek, David Wessel, and Katherine Yelick. A view of the parallel computing landscape. Communications of the ACM, 52(10):56–67, 2009. [2] Kurt Keutzer, Berna Massingill, Tim Mattson, and Beverly Sanders. A design pattern language for engineering (parallel) software: Merging the plpp and opl projects. In Workshop on Parallel Programming Patterns (ParaPLoP), March 2010. [3] Kurt Keutzer and Tim Mattson. Our pattern language (opl): A design pattern language for engineering (parallel) software. In Workshop on Parallel Programming Patterns (ParaPLoP), June 2009. [4] Celina Gibbs and Yvonne Coady. May the force(s) be with you: A systematic approach to pattern selection. In Workshop on Parallel Programming Patterns (ParaPLoP), March 2010. [5] Michael D. McCool. Structured parallel programming with deterministic patterns, May 2010. [6] Andrew Kerr, Gregory Diamos, and Sudhakar Yalamanchili. A characterization and analysis of PTX kernels. In IEEE Intl. Symp. on Workload Characterization, pages 3–12. IEEE Press, Oct 2009. [7] JunSeong Kim and David J. Lilja. Characterization of communication patterns in messagepassing parallel scientific application programs. In Proc. of the Workshop on Communication and Architecture Support for Network Based Parallel Computing, pages 202–216, Feb 1998. [8] Erich Strohmaier and Hongzhang Shan. Architecture independent performance characterization and benchmarking for scientific applications. In Intl. Symp. on Modeling, Analysis and Simulation of Computer and Telecommunication Systems, Oct 2004.
[9] M. Kulkarni, M. Burtscher, R. Inkulu, K. Pingali, , and C. Cascaval. How much parallelism is there in irregular applications? In Principles and Practices of Parallel Programming, pages 3–14, 2009. [10] Samuel Williams, Andrew Waterman, and David Patterson. Roofline: an insightful visual performance model for multicore architectures. Communications of the ACM, 52(4):65– 76, 2009. [11] Rob van Nieuwpoort and John W. Romein. Using many-core hardware to correlate radio astronomy signals. In ICS, pages 440–449. ACM, Mar 2009.