International Journal of Materials Science and Applications 2015; 4(3): 149-158 Published online April 22, 2015 (http://www.sciencepublishinggroup.com/j/ijmsa) doi: 10.11648/j.ijmsa.20150403.12 ISSN: 2327-2635 (Print); ISSN: 2327-2643 (Online)
Application of Multi-Criteria Decision Making Optimization Tool for Determining Mild Steel Weld Properties and Process Parameters Using the TOPSIS Joseph Achebo, Monday Omoregie Department of Production Engineering, University of Benin, Benin City, Edo State, Nigeria
Email address:
[email protected] (J. Achebo),
[email protected] (M. Omoregie)
To cite this article: Joseph Achebo, Monday Omoregie. Application of Multi-Criteria Decision Making Optimization Tool for Determining Mild Steel Weld Properties and Process Parameters Using the TOPSIS. International Journal of Materials Science and Applications. Vol. 4, No. 3, 2015, pp. 149-158. doi: 10.11648/j.ijmsa.20150403.12
Abstract: Several different processes and models have been adopted for the optimization of weld deposit quality of mild steel joints. These various processes and models have been used continually over the decades to find new ways of improving weld deposit quality, with the ultimate aim of improving the service life of the resulting weld joints. This quest to find ways of improving weld deposit quality has resulted in the use of Technique for Order Preference by Similarity to Ideal Solution (TOPSIS). TOPSIS is one such technique used for solving multi criteria problems. It is based on the concept that the optimal alternative should have the shortest distance from the positive ideal solution, and the farthest distance from the negative ideal solution. From applying the TOPSIS technique, it was found that weldment 9 has the best weld mechanical properties with a Brinell hardness number (BHN) of 216, Ultimate tensile strength (UTS) of 600MPa, Charpy V-notch (CVN) impact energy of 90J, and a percentage elongation of 23%. Also the relationship between the input parameters and the output parameters was examined. It is therefore, concluded that TOPSIS has successfully optimized the input process parameters which has produced the most desired mechanical properties. In this study a step by step approach for the application of the TOPSIS technique is adopted. Keywords: TOPSIS, Weld Bead, Mechanical Properties, Process Parameters, Weld Joints
1. Introduction The unwarranted failure of structural materials is a major problem facing the manufacturing sector. Research has shown that as the world advances in technology, manufactured products and other structures, particularly those comprising of welded joints, tend to be subjected to heavier loads, often beyond the designed load capacity of certain currently used materials. This situation has compelled engineers and scientists to continually find new ways of optimizing welding process parameters and properties geared towards improving the integrity of such welded joints. The strength of these welded joints is of particular importance which should take priority in all engineering endeavours because actual challenges to strength property feature prominently in material failure reports. Failures in most cases tend to commence at welded joints since such welded joints are not as strong as the parent metal in terms of strength and other related properties. Bearing
in mind the total weldment forming process during a welding operation, selected process parameters could either facilitate or hinder the desired end result of the weld deposit. During the welding process the different weld elements combine and melt, or mix to form the molten weld pool, generally comprised of the parent metal, the electrode (coated electrode or bare electrode), and atmospheric air. For instance, the presence of surrounding atmospheric air, in significant quantities, can alter the delicate balance within the weldpool, thereby negatively affecting the strength quality of the eventual weld. What happens is that air entrapment present in the weld deposit can create macroscopic pores which are the actual culprits detrimental to its strength quality. Therefore, the selection of appropriate welding process parameters adapted to overcome these and similar challenges is of great importance. These challenges have opened the door for various process optimization tools used to find new ways of improving weld
150
Joseph Achebo and Monday Omoregie: Application of Multi-Criteria Decision Making Optimization Tool for Determining Mild Steel Weld Properties and Process Parameters Using the TOPSIS
properties. Welding process parameters and weld properties are very important variables used for assessing the quality as well as the integrity of welded joints. Welding process parameters are applied in making weld deposits and the integrity of such weld deposits are evaluated by determining their actual weld properties. The weld deposit also known as the weld bead, and the bead geometry which comprises the bead penetration, bead height, bead width, can be measured from the weld deposits. Weld properties are the responses or results of both chemical and mechanical tests conducted on the weld deposits, such as the weld microstructure, tensile test, impact test, hardness test, creep test, fatigue test etc. These attributes of the weld properties are measures of the welding performance. Deriving acceptable weld process parameters and their corresponding weld properties, demands the application of a suitable optimization tool or process. Optimization processes enable the researcher to find the most cost effective and suitable method of arriving at the most economic process parameters and properties that best define the weld integrity. Several optimization methods have been adopted by researchers for determining weld process parameters which have produced desirable weld properties. These include Kolahan and Heidari [1] who developed an approach to predict and optimize weld bead geometry in Gas Metal Arc Welding (GMAW). They conducted experiments based on Taguchi’s experimental matrix design. They developed mathematical models for weld bead height, width and penetration. They optimized the process parameters using simulated annealing technique. Achebo [2] used the Vogel Approximation method as the optimization tool to select five mild steel weldments with denotations spanning from W1 to W5, along with their fluence energies and corresponding UTS. The five weldments’ chemical composition analysis, microstructural analysis, BHN, CVN, and weld factor, were carried out. Weldment W2 was found to have the best mechanical properties, chemical composition, as well as microstructure. Benyounis and Olabi [3] cited in their paper the following Authors who have researched this area of study. These Authors include the following: Murugan and Parmar [4] who developed mathematical models using response surface methodology (RSM) to study the direct and interaction effects of SAW parameters (open circuit voltage, wire feed rate, welding speed and nozzle-to-workpiece distance) on the cladding geometry (depth of penetration, height of reinforcement, weld width and dilution %). The process parameters obtained from the developed models were employed to clad IS2062 structural steel plate of 20-mm thickness using 316L stainless steel wire of 3.15 mm diameter. They concluded that a low dilution of 22.57% can be produced by both high voltage and high welding speed or by low voltage and low welding speed. It was reported that the hardness of the existing martensitic structures at the intermediate mixed zones in overlays was below 400 VHN, due to low carbon content in the cladding. Yamaguchi et al [5] have investigated the friction welding process of 5056 aluminium alloy using RSM. Their aim was to find the optimal welding conditions that would
yield maximum tensile strength of the weld. The process input parameters were friction pressure, up-set pressure, friction time, rotating speed and braking time. It was reported that the successful welds showed 89.2% joint efficiency in tensile strength. Benyounis et al [6] have proposed models using RSM to investigate the effect of welding parameters in SAW (welding current, arc voltage and welding speed) on the impact strength at two testing temperatures of 50 °C and 27 °C. The aim was to predict and optimize the impact strength of the spiral-welded joints with respect to the process parameters. It was observed that the welding current was the most significant factor associated with the impact strength, then the welding speed, whereas the welding voltage had no significant effect within the factors domain investigated. They listed the optimal welding conditions that would lead to acceptable impact strength with improving the process productivity. Sen et al [7] developed a mathematical model using a multiple linear regression analysis in MINITAB 13.1 to predict the weld bead geometry and the authors also checked for the adequacy of the model by conducting ANOVA. It was found from their study that the predicted optimum bead geometry correlates very well with the confirmation test result. Okuyucu et al [8] developed a model using ANN for the analysis and simulation of the correlation between friction stir welding (FSW) parameters of aluminium plates and mechanical properties of the welded joint. The process parameters consist of welding speed and tool rotation speed versus the output mechanical properties of weld joint, namely: tensile strength, yield strength, elongation, hardness of WZ and hardness of HAZ. Good performance of the ANN model was achieved and the model can be used to calculate mechanical properties of the welded plates as a function of process parameters. Also, it was found that the correlation between the measured and predicted values of tensile strength, hardness of HAZ and hardness of weld metal were better than those of elongation and yield strength. Factors that affect weld mechanical properties (oxygen, nitrogen, carbon, hydrogen and iron contents in the weld joint as well as the cooling rate) of commercially pure titanium have been investigated by Wei et al [9]. ANNs techniques were used, to predict the ultimate tensile strength, yield strength, elongation, reduction of area, Vickers hardness, and Rockwell B hardness. The input data were obtained from mechanical testing of single-pass autogenous welds. The ANN models were developed. An oxygen equivalent equation (OEE) was also used to predict the mechanical properties of CP titanium welds; a good agreement was found between both ANN and OEE. The results obtained indicated that both oxygen and nitrogen have the most significant effect on the strength while hydrogen has the least effect. Also, it was reported that cooling rate is more important than the carbon and iron content in the ultimate tensile strength model, and more important than oxygen and the iron content and equally important as the carbon content in the yield strength model. In this study, TOPSIS technique has been used to optimize the input process parameters which eventually give good and acceptable mechanical properties.
International Journal of Materials Science and Applications 2015; 4(3): 149-158
151
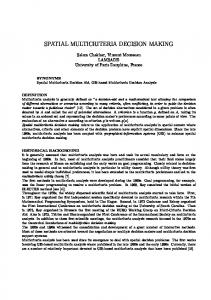
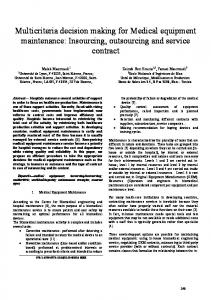
2. Materials and Methods 2.1. Materials Five large weld deposits were made for each application of the sixteen process parameters. Each of these weld deposits were sectioned into three parts. One part was used to conduct the Brinell hardness test, the second part was machined into the tensile specimen (see Figure 1) for conducting the tensile test, while the remaining part was used to conduct the Charpy V-Notch (CVN) Impact test. The CVN specimen is shown in Figure 2. Five tensile specimens were prepared using a CNC Lathe machine. Tensile tests were carried out in 100kN computer controlled Universal Testing Machine as used by Prasad et al [10]. The specimens were loaded at a rate of 1.8kN/min as per ASTM specifications, so that these tensile specimens can undergo the deformation process. From the stress strain curve obtained, the ultimate tensile strength (UTS), Yield Strength (YS) and Percent elongation (% Elong) of the weld joints were evaluated and the average of the five test results was recorded.
Figure 2. Schematic diagram of Charpy V Notch Impact test specimen
2.2. Methods The TOPSIS method used for optimizing the process parameters was broken down into steps as presented herein-under and adopted by Wang [11]; Step-1 Construct the normalized decision matrix − to transform the various attribute dimensions into non-dimensional attributes, which allows comparison across the attributes
xij
rij =
m
∑x
2 ij
i =1
(1)
Step-2 Construct the weighted normalized decision matrix
Figure 1. Schematic diagram of Tensile Specimen
V =
v v
. . .
v
1j
11
12
. . .
. . .
. . .
v v
v
i1
. . .
v v m1
i2
. . . m2
. . .
v
mj
1n
v
ij
. . . . . .
. . . = in . . . mn
v
. . .
v
wr w r 1
. . .
(
) ∑Wij = 1
2
1
i1
. . .
2
(3)
The simplest method to assess the importance of weights is to arrange them in ranked order. Every criterion under consideration is ranked in the order of the decision-maker’s preference. Once the ranking is established for a set of criteria, several procedures are available to generate numerical weights
. . .
m1
2
wr j
ij
. . .
. . .
wr
i2
j
. . .
wr w r 1
12
. . .
wr w r
Weight Allocation Ozturk and Batuk [12] said that the derivation of weights is a central step in eliciting the decision-maker’s preferences. A weight can be defined as a value assigned to an evaluation criterion that indicates its importance relative to other criteria under consideration. As the value of the weight increases, the criterion’s importance in the overall utility also increases. The weights are usually normalized to sum to 1. In the case of n criteria, a set of weights is defined as follows [13]:
Wij = W1 ,W2 , − − −−,W j −−−,Wn ,
11
. . .
wr j
n
1n
n in . . . n mn . . .
wr
ij
. . . m2
wr
mj
. . .
(2)
wr
from rank order information [13]. In the rating method, the decision-maker estimates weights based on a predetermined scale; for example, a scale of 0 to 100 can be used [13]. Rating weights were calculated according to Eq.(4) [14].
Wij =
W i =0
∑W
(4)
j −0
Kaur et al [15] said that the weights of bands are also normalized by summing up the total and then dividing the individual weight of the band by this total. Wu and Olson [16] said that in decision analysis, these weights would reflect relative criterion importance (as long as scale differences are eliminated through standardization). Here, they are interested in the relative value of each attribute
152
Joseph Achebo and Monday Omoregie: Application of Multi-Criteria Decision Making Optimization Tool for Determining Mild Steel Weld Properties and Process Parameters Using the TOPSIS
in explaining the outcome of each case. These m weights wi will be between 0 and 1 and will have a sum of 1. Step-3 Determine ideal and negative-ideal solutions +
i i + + + + 1 2 j n ' j ∈ J ) i = 1, 2,...m} ij ij i i − − − − j n 1 2 J = j = 1, 2,..., n j associated with benefit criteria J ' = j = 1, 2,..., n j associated with cost criteria
v j ∈ J ), (min v = {v , v ,..., v ,..., v } = A {(min v j ∈ J ), (max v = {v , v ,..., v ,..., v } A
= {(max
−
ij
ij
j ∈ J ') i = 1, 2,...m}
{ {
where
}
(5)
}
Table 1. Process Parameters Level Process Parameters
s
i
∑ ( v ij − v +j ) n
=
s
i
=
∑( j =1
v ij −v −j
)
2
i = 1, 2,..., m
(6)
2
i = 1, 2, ..., m
(7)
Step-5 Calculate the relative closeness to the ideal solution
Si−
, 0∠Ci+ ∠1; i = 1, 2,....., m + − Si + Si Ci∗ = 1, if Ai = A+ ∗ − Ci = 0, if Ai = A
Ci∗ =
(
High
A
I
450
530
Arc Voltage
V
E
25
40
Welding Angle
o
D
60
90
Welding Speed
m/min
S
1.00
1.35
Table 2. Process Parameters with resultant Weld Mechanical Properties
j =1
n
Low
Step 1 shows the individual properties, Xij of the weldments. The process parameters and the corresponding properties are shown in Table 2
− negative-ideal separation −
Notations
Current
Step-4 Calculate the separation measure − ideal separation +
Unit
)
(8)
Step-6 Rank the preference order − A set of alternatives can now be preference ranked * according to the descending order of c i Jahanshahloo et al [17] said that to rank the preference order, ranking of alternatives using this index, alternatives can be ranked in decreasing order. They said further that the basic principle of the TOPSIS method is that the chosen alternative should have the ‘‘shortest distance’’ from the positive ideal solution and the ‘‘farthest distance’’ from the negative ideal solution.
3. Results and Discussion 3.1. Results Table 1 shows the process parameters used for making weldments for this study.
I
E
D
S
BHN
UTS MPa
CVN Joule
YS MPa
ELON G, %
530
25
60
1.00
250
480
82
360
9
530
40
60
1.00
180
400
78
220
16
530
40
90
1.00
210
300
110
285
6
530
40
90
1.35
300
550
75
320
22
450
40
90
1.35
150
420
100
236
8
530
25
90
1.35
340
317
66
220
12
450
40
60
1.35
170
410
110
318
10
530
25
90
1.00
250
380
55
228
21
530
40
60
1.35
216
600
90
390
23
450
40
90
1.00
178
349
75
200
14
450
25
90
1.35
315
466
115
305
9
530
25
60
1.35
172
380
70
340
14
450
40
60
1.00
248
426
56
240
5
450
25
90
1.00
182
459
102
240
28
450
25
60
1.35
164
580
73
270
7
450
25
60
1.00
350
510
110
310
11
Score
3
4
3
5
4
Wij
0.16
0.21
0.16
0.26
0.21
Weight was allocated or scored in an order of importance after comprehensive examination by experienced Welders and Materials Scientists. The criteria used for scoring the weights are as follows: Table 3. Expert Evaluation Criteria Excellent
5
Very Good
4
Good
3
Bad
2
Very Bad
1
Note that, summation of the weights must be equal to one, that is, ∑Wij = 1
Step 2, is to calculate column comprises of
1 2 2 ij
(∑ X )
∑X
2 ij
that is;
for each column. Each
International Journal of Materials Science and Applications 2015; 4(3): 149-158
Table 4. First TOPSIS Evaluation Process Weld ment 1
153
Table 6. Third TOPSIS Evaluation Process
62,500
UTS MPa 230,400
1
0.0416
0.0567
0.0368
0.0832
0.0315
2
32,400
160,000
6,084
48,400
256
2
0.0304
0.0462
0.0352
0.0494
0.0567
3
44,100
90,000
12,100
81,225
36
3
0.0352
0.0357
0.0496
0.0650
0.0210
4
90,000
302,500
5,625
102,400
484
4
0.0512
0.0651
0.0336
0.0728
0.0777
5
22,500
176,400
10,000
55,696
64
6
115,600
100,489
4,356
48,400
144
5
0.0256
0.0483
0.0448
0.0546
0.0273
7
28,900
168,100
12,100
101,124
100
6
0.0576
0.0378
0.0304
0.0494
0.0420
0.0288
0.0483
0.0496
0.0728
0.0357
BHN
CVN Joule 6,724
YS MPa 129,600
ELO NG % 81
Weld Ment
BHN
UTS MPa
CVN Joule
YS MPa
ELONG, %
8
62,500
144,400
3,025
51,984
441
7
9
46,656
360,000
8,100
152,100
529
8
0.0416
0.0441
0.0256
0.0520
0.0735
10
31,684
121,801
5,625
40,000
196
9
0.0368
0.0714
0.0416
0.0884
0.0798
11
99,225
217,156
13,225
93,025
81
10
0.0304
0.0420
0.0336
0.0468
0.0483
12
29,584
144,400
4,900
115,600
196
11
0.0528
0.0546
0.0528
0.0702
0.0315
13
61,504
181,476
3,969
57,600
25
12
0.0288
0.0441
0.0320
0.0780
0.0483
14
33,124
210,681
10,404
57,600
784
13
0.0416
0.0504
0.0288
0.0546
0.0168
15
26,896
336,400
5,329
72,900
49
16
122,500
260,100
12,100
96,100
121
14
0.0304
0.0546
0.0464
0.0546
0.0987
15
0.0272
0.0672
0.0336
0.0624
0.0252
16
0.0592
0.0609
0.0496
0.0702
0.0378
909,673
3,204,303
123,666
1,303,754
3,587
953.77
1,790.06
351.66
1,141.82
59.89
Step 3 is to divide each column of Xij as in step 1, by 1 2 2 ij
(∑ X )
in step 2 to get rij . Therefore rij is as shown in Table
5. Table 5. Second TOPSIS Evaluation Process Weld Ment
Step 5 involves the determination of the Positive Ideal Solution (PIS), A+ The values of PIS are the highest values of all the values contained in each column as shown in Step 4. But for cost evaluation, the lowest cost value is considered when determining PIS. Since cost is not considered in this case, only the highest values of the properties of the weldments in Step 4 columns are chosen, ie V j+ = A+ = [0.0592, 0.0714, 0.0528, 0.0884, 0.0987]
BHN
UTS MPa
CVN Joule
YS MPa
ELONG %
1
0.26
0.27
0.23
0.32
0.15
2
0.19
0.22
0.22
0.19
0.27
3
0.22
0.17
0.31
0.25
0.10
4
0.32
0.31
0.21
0.28
0.37
5
0.16
0.23
0.28
0.21
0.13
6
0.36
0.18
0.19
0.19
0.20
7
0.18
0.23
0.31
0.28
0.17
8
0.26
0.21
0.16
0.20
0.35
Step 7 involves the determination of the Separation, S from
9
0.23
0.34
0.26
0.34
0.38
10
0.19
0.20
0.21
0.18
0.23
the Positive Ideal Solution, Si+ = [∑ (V j+ − Vij ) ] 2 for each
11
0.33
0.26
0.33
0.27
0.15
12
0.18
0.21
0.20
0.30
0.23
13
0.26
0.24
0.18
0.21
0.08
14
0.19
0.26
0.29
0.21
0.47
15
0.17
0.32
0.21
0.24
0.12
16
0.37
0.29
0.31
0.27
0.18
Step 4 involves the multiplication of each column in step 3; rij by the corresponding weights, as indicated in step 1, Wij to get Vij . The values of Vij are shown in Table 6
Step 6, is to determine the Negative Ideal Solution (NIS), AThe values of NIS (A-) are the lowest value of all the values contained in each column as shown in Step 4. But when cost is considered among the other properties, the highest cost value is chosen when NIS is considered. In this case cost is not considered, therefore NIS becomes V j_ = A_ = [0.0256, 0.0357, 0.0256,0.0468, 0.0168]
2
1
row (or weldment). This involves finding the square root of the summation of the square of the difference between the values in Table 6 and their corresponding values of V j+ of each mechanical property. Step 8 is to determine the Seperation, S- from the Negative 1
Ideal Solution, Si− = [∑ (V j− − Vij ) ]2 2
for each row (or
weldment). This involves finding the square root of the summation of the square of the difference between the values in Table 6 and their corresponding values of V j− of each mechanical property.
154
Joseph Achebo and Monday Omoregie: Application of Multi-Criteria Decision Making Optimization Tool for Determining Mild Steel Weld Properties and Process Parameters Using the TOPSIS
The results obtained by applying the procedures in step 7 and step 8 are tabulated in Table 7
Weldment
Table 7. Separation from the positive and negative ideal solution 11
0.41494
12
0.39866
13
0.19141
14
0.64506
15
0.29978
16
0.47213
Weld ment 1
0.07297
0.04862
2
0.07113
0.04271
3
0.09190
0.03189
4
0.03401
0.07726
5
0.08926
0.02643
6
0.07981
0.04115
7
0.07537
0.04217
8
0.06128
0.05974
9
0.03138
0.08576
10
0.07958
0.03345
11
0.07191
0.05100
12
0.06892
0.04569
13
0.09847
0.02331
14
0.04791
0.08707
15
0.08654
0.03705
16
0.06450
0.05769
Step 9 is to calculate the relative closeness to the Ideal +
Solution, Ci . Table 8 shows the final TOPSIS evaluation process 3.2. Discussion
Table 8. Final TOPSIS Evaluation Process Weldment
Weldment 9 has the best weld properties of Brinell Hardness Number of 216, Ultimate Tensile Strength of 600 MPa, Charpy V-Notch absorption energy of 90J, Yield Strength of 390 MPa and Percent Elongation of 23% with corresponding process parameters of welding current of 530A, voltage of 40V, welding angle of 60o and welding speed of 1.35 m/min. This indicates that to produce weld of an acceptable quality, the process parameters of weldment 9 should be applied. The interactions between these input process parameters and the output parameters are examined hereunder.
1
0.40000
2
0.37518
3
0.25761
Effect of Input Process Parameters on Weld Mechanical Properties
4
0.69435
5
0.22846
6
0.34020
7
0.35877
8
0.49364
9
0.73212 BEST
10
0.29594
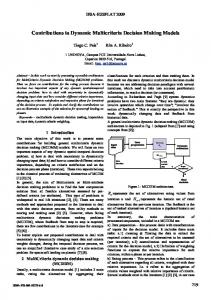
(i) Effect of Voltage on Weld Mechanical Properties It can be observed in Figure 3, that as voltage is increased from 5V to 31V, UTS and YS increase respectively whereas, CVN and BHN increased from 60J to 80J and the energy absorbed on the weldment reduced to 70J when voltage exceeded 28V. Between 25V to 28V, the percent elongation reduced from 14% to 9% and increased to 20% as voltage exceeds 28V. The above relationships reveal that as voltage increases from 25V to 28V, UTS, YS, CVN and BHN are enhanced whereas, the percent elongation is reduced. This indicates that the weldment is ductile with some element of stiffness at that voltage range. When the voltage increases from 28V to 31V, UTS, YS and percent elongation are increased whereas, BHN and CVN are reduced. As voltage is increased from 31V to 34V, UTS, YS and percent elongation are steeply reduced whereas BHN is slightly reduced and CVN is greatly increased. As the voltage is increased from
International Journal of Materials Science and Applications 2015; 4(3): 149-158
34V to 37V, UTS, YS, BHN and percent elongation increased whereas, CVN reduced. However, as the voltage increases from 37V to 40V, BHN and percent elongation increased.
155
Summarily, it can be seen that voltage ranges of 34V and 37V; and 25V and 28V respectively improve on most of the weldment mechanical properties.
Figure 3. Effect of Voltage on Mechanical Properties
Figure 4. Effect of Current on Mechanical Properties
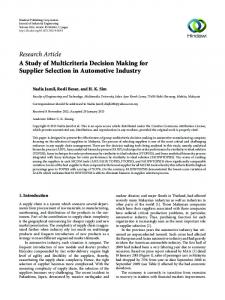
(ii) Effect of Current on Weldment Mechanical Properties In Figure 4, it is observed that as current increases from 430A to 450A, UTS, YS, CVN and BHN also increase whereas percent elongation decreases. As the current increases further from 450A to 470A UTS, YS, and percent
elongation increase whereas, BHN and CVN decreased. As the current increases from 470A to 490A, CVN increases, whereas BHN, UTS, YS and percent elongation decreases. Increasing the current from 490A to 510A, UTS, YS, BHN and percent elongation increases whereas, CVN remains the
156
Joseph Achebo and Monday Omoregie: Application of Multi-Criteria Decision Making Optimization Tool for Determining Mild Steel Weld Properties and Process Parameters Using the TOPSIS
same. From 510A to 530A, UTS, YS, and CVN decreases, whereas, BHN and percent elongation increase. From the above analysis, it is found out that current at 430A to 450A homogenously improve the mechanical properties of the material. It is also observed that current between the ranges of 490A to 510A does not have any significant effect on CVN. It is also observed that so much current above 510A could distort the microstructural arrangement of alloyed material thereby lowering its strength. (iii) Effect of Welding Angle on Weld Mechanical Properties In Figure 5, it is observed that as the welding angle increases from 60o to 65o, the UTS, YS, CVN and BHN increased whereas, the percent elongation decreases. As
welding angle increased from 65o to 70o, the UTS, YS, and percent elongation increases whereas, BHN and CVN decrease. When the welding angle was further increased from 70o to 75o, the CVN increased whereas, the UTS, YS, percent elongation decrease steeply, also BHN had a gradual degradation. As the welding angle is increased from 75o to 80o, the UTS, YS, BHN and percent elongation increase whereas, CVN remains slightly unchanged. When the welding angle is increased from 80o to 85o, the percent elongation increases whereas, the UTS, YS, CVN and BHN decreased. From the above analysis, it is optimum to use a welding angle of 75o to 80o, where the weld is said to have sufficient strength and ductile properties.
Figure 5. Effect of Welding Angle on Mechanical Properties
Figure 6. Effect of Welding Speed on Mechanical Properties
International Journal of Materials Science and Applications 2015; 4(3): 149-158
(iv) Effect of Welding Speed on Mechanical Properties In Figure 6, it is seen that when the welding speed is between 1.0m/min and 1.15m/min, the UTS, YS, CVN and BHN are increasing whereas, the percent elongation is decreasing. As the welding speed increases from 1.15m/min to 1.20m/min, UTS, YS, and percent elongation increases steeply whereas, BHN and CVN decreases respectively. As the welding speed further increases from 1.20m/min to 1.25m/min, the UTS, YS, percent elongation and BHN decreases respectively whereas, CVN increases. When the welding speed is increased from 1.25m/min to 1.30m/min, the UTS, YS, CVN and percent elongation increases whereas, BHN slightly decreases. As the welding speed is increased from 1.30m/min to 1.35m/min, the UTS, YS and CVN decreases respectively whereas, BHN and percent elongation increases. Summarily, from the analysis above, it can be observed that the welding speed of 1.0m/min to 1.15m/min and 1.25m/min to 1.30m/min are the most economic welding ranges to use if optimum weld quality is to be achieved. 3.3. Microstructural Analysis From Figure 7, it is observed that the microstructural view of weldment 9 shows a combination of white and black grains. The white grains are ferrite, while the black ones are the pearlite. However, pearlite contains ferrite and cementite. Cementite is considered to be very hard. In Fig 7, it can be seen that the dense (dark) regions are dominant, and homogenously distributed. Therefore weldment 9, has great strength, this is revealed by the values of its UTS, YS and CVN. However, the values of its BHN and percent elongation also show that weldment 9 is ductile and can be used confidently as engineering materials. Weldment 9 microstructure confirms that the weld is of good and acceptable quality.
Table 9. Chemical Composition of Weldment 9 Elements Al 0.006 N 0.006
C 0.120 Ti 0.012
Mn 1.200 P 0.020
Cr 0.038 S 0.032
Si 1.720 Nb 0.160
Mo 0.050
4. Conclusion In this study, mild steel welds have been optimized using the TOPSIS technique. From using this technique, weldment 9, was found to possess the best mechanical properties which compare favourably with those from literature. Interactions between the input process parameters and the output process parameters were studied. Also the microstructural analysis of the optimized weldment 9 was studied. It was observed that the micro-grains of the weldment were fine and dense and mainly composed of cementite materials. From the mechanical characteristics of this weldment 9, the weld has been considered to be of excellent weld quality. The TOPSIS technique has been proven to be a veritable tool for optimizing welding process parameters.
References [1]
F. Kolahan and M. Heidari. A new approach for predicting and optimizing weld bead geometry in GMAW, Intl J Mech Syst Sci and Eng, 2, 2010, pp138 – 142.
[2]
J.I. Achebo. Optimization of fluence energy in relation to weld properties based on vogel approximation method. World Congr on Eng: Intl Conf on Mech Eng, London , July 4 – 6, 2012
[3]
K.Y. Benyounis and A.G Olabi. Optimization of different welding processes using statistical and numerical approachesA reference guide. Adv in eng software, Elsevier, 39(6): 2008, pp483-496. DOI: 10.1016/j.advengsoft.2007.03.012.
[4]
N. Murugan and R.S. Parmar, Effect of welding conditions on microstructure and properties of tupe 316L stainless steel submerged arc welding cladding, Weld J, AWS, 76 (5): 1997, pp210-s- 220-s.
[5]
H.Yamaguchi, K. Ogawa and K. Sakaguchi. Optimization of friction welding condition of 5056 aluminium alloy, J. Japan Inst of Light metal, 41(10): 1991, pp716-720.
[6]
K.Y. Benyounis, A.H. Bettamer, A.G. Olabi and M.S.J. Hashmi. Prediction the impact strength of spiral welded pipe joints in submerged arc welding of low carbon steel, Proc of IMC21, Limerick 1-3-Sept 2004. pp 200-210.
[7]
M. Sen, M. Mukherjee. and T.K. Pal.. Prediction of weld bead geometry for double pulse gas metal arc welding process by regression analysis. 5th International & 26th All India Manufacturing Technology, Design and Research Conference, December 12th–14th, 2014 IIT Guwahati, Assam, India, pp. 814-6.
[8]
H. Okuyucu, A. Kurt, and E. Arcaklioglu. Artificial neural network application to the friction stir welding of aluminium plates, J. Mater & Design, 29: 2007, pp78-84.
Figure 7. Microstructure of Weldment 9
3.4. Chemical Composition of Weldment 9 Table 9, shows the chemical composition of weldment 9. From Table 9, the values of carbon, C; chromium, Cr and Molybdenum, Mo confirm the high strength status of the weldment. Whereas, the value of Si shows the extent of weldment fluidity. The flexibility of the weldment is confirmed by the values of the BHN and percent elongation. The overall assessment show that weldment 9 is ductile and of good and acceptable quality.
157
158
[9]
Joseph Achebo and Monday Omoregie: Application of Multi-Criteria Decision Making Optimization Tool for Determining Mild Steel Weld Properties and Process Parameters Using the TOPSIS Y. Wei, H.K.D. Bhadeshia and T. Sourmail. Mechanical property prediction of commercially pure titanium welds with artificial neural network, J. Mater Sci Techn, 21(3): 2005, pp403-407.
[10] K.S. Prasad, C.S. Rao, and D.N. Rao. Optimizing pulsed current micro plasma arc welding parameters to maximize ultimate tensile strength of inconel 625 nickel alloy using response surface method. Intl J Eng Sci and Techn, 3(6): 2011, 26 - 236 [11] R. Wang. Performance evaluation method-technique for order preference by similarity to ideal solution (TOPSIS). http//researcher.most.gov.tw/public/caroljoe/Data/0218213367 1.ppt. Accessed 22 September 2014. [12] D. Ozturk and F. Batuk. Technique for order preference by similarity to ideal solution (TOPSIS) for spatial decision problems. Proc ISPRS. 2011. http://www.isprs.org/proceedings/2011/Gi4DM/PDF/PP12.pdf [13] J. Malczewski. GIS and Multicriteria Decision Analysis. Wiley, New York. 1999.
[14] J. Ananda and G. Herath. Analysis of forest policy using multi-attribute value theory. In: Using multi-criteria decision analysis in natural resource management, G. Herath and T. Prato (eds.), Ashgate Publishing Ltd., Hampshire, 2006, pp. 11-40. [15] P. Kaur, R. Sharma, N.C. Mahanti and A.K. Singh. Exploration of topsis (Technique for order preference by similarity to ideal solution) as an alternative to traditional classification algorithm in small areas of lohardaga district of Jharkhand, India using remote sensing image-a case study. Res J Earth Sci 1(2): 2009, pp81-85. [16] D. Wu and D.L. Olson. A TOPSIS data mining demonstration and application to credit scoring. Intl J Data Warehous & Min, 2(3), 1-10, July-September, 2006. [17] G.R. Jahanshahloo, L.F. Hosseinzadeh and M. Izadikhah. Extension of the TOPSIS method for decision-making problems with fuzzy data. Applied Maths and Comput 181: 2006, pp1544–1551.