Deforestation, which is mainly caused by illegal logging, is a serious problem ... GIS layers were used to produce more reasonable information of illegal logging.
APPLICATION OF MULTI-STAGE CLASSIFICATION TO DETECT ILLEGAL LOGGING WITH THE USE OF MULTI-SOURCE DATA A Case Study in Labanan Forest Management Unit, East Kalimantan, Indonesia
Arief Wijaya March, 2005
Application of Multi-Stage Classification to Detect Illegal Logging with the Use of Multi-Source Data by Arief Wijaya
Thesis submitted to the International Institute for Geo-information Science and Earth Observation in partial fulfilment of the requirements for the degree of Master of Science in Geo-information Science and Earth Observation, Specialisation: Planning and Coordination
Thesis Assessment Board Prof. Dr. W. H. van den Toorn (Chairman of the Board, PGM Department, ITC, The Netherlands) Dr. F.H.J.M. Coenen (External Examiner, University of Twente, The Netherlands) Prof. Dr. Alfred Stein (Internal Examiner, EOS Department, ITC, The Netherlands) Dr. M. Ali Sharifi (Supervisor, PGM Department, ITC, The Netherlands) Dr. Valentyn Tolpekin (Supervisor, EOS Department, ITC, The Netherlands)
INTERNATIONAL INSTITUTE FOR GEO-INFORMATION SCIENCE AND EARTH OBSERVATION ENSCHEDE, THE NETHERLANDS
Disclaimer This document describes work undertaken as part of a programme of study at the International Institute for Geo-information Science and Earth Observation. All views and opinions expressed therein remain the sole responsibility of the author, and do not necessarily represent those of the institute.
To my beloved family: my wife Ratna, my lovely daughter Keisya and to my parents, with all love and respect
Abstract Deforestation, which is mainly caused by illegal logging, is a serious problem in Indonesia. Illegal logging is closely related to the quality of management, therefore it is one of the main factors that can hinder the sustainability of forest management. This study aimed at the development of method that provides more reliable detection of illegal logging in a form of single tree felling by means of multi-stage classification of multi-source data, in Labanan Forest Management Unit in East Kalimantan, Indonesia. The study used Landsat 7 ETM data of 2003 and identified the illegal logging in three stages. In the first stage, the seven bands of Landsat image were used in fuzzy c-means and neural network classification, and the results were compared to maximum likelihood. Pixels, labelled by those three classifiers as single tree felling class were defined as clear single tree felling. Other pixels, assigned as single tree felling by one or two classifiers only, were defined as unclear pixels of single tree felling. Those “unclear pixels” were used as an input in the second classification, performed with neural network, taking into account ancillary data. The results were then assessed using confusion matrix to find the optimal result of second stage classification, resulting in second order single tree felling. In the third stage, combination of first order and second order single tree felling, were classified in the rule-based classification. Expert knowledge, reflected in a set of rules for GIS layers were used to produce more reasonable information of illegal logging. The results of this study showed that fuzzy c-means classifier produced less accurate result for classification of single tree felling, compared to the neural network and maximum likelihood techniques. According to the confusion matrix from the first stage of classification, 53.3% of clear single tree felling pixels were in agreement between those three classifiers. Multi-source classification of neural network performed quite satisfactorily to classify unclear single tree felling pixels in the second classification stage, resulting on average in more than 80% of both single tree felling and overall accuracy. The optimal classification result was found using combination of Landsat ETM data, aspect, elevation, skewness, and variance in the input data. Using the GIS layers (i.e. distance from the main road and slope map), the rule-based approach found that 8.6% of total area in RKL 1 was classified as illegal logging by the first order single tree felling, or 15.2% using combination of first order and second order single tree felling pixels.
Keywords: illegal logging, single tree felling, fuzzy c-means, neural network, experts knowledge, rule-based classification
i
Acknowledgements First of all, I wish to thank to Allah SWT, God Almighty for giving me the strength, health, and determination to complete my M.Sc. study, while living far away from home and my lovely family. I am very much indebted to Dr. M. Ali Sharifi, my first supervisor, who allowed me to join to this collaboration project and gave me an initial idea to develop this research. My appreciation is extended to Dr. Valentyn Tolpekin, my second supervisor, for his valuable inputs, positive and constructive comments, and guidance throughout the research period. I am very grateful to Dr. Yousif Ali Hussin, whom I call my third supervisor, for his continuous support during the field work period and giving me valuable comments and critical inputs on this thesis report during sabbatical leave of Dr. Sharifi. From him, I learned many things to be a forester. I would also like to thank Mr. Henk van Oosten, who provided me with neural network application and gave me valuable inputs on the neural network classification. To Dr. Arko Lucieer, somewhere in Australia, I would like to thank you for allowing me to use PARBAT software and answering a lot of questions on fuzzy c-means classification To all ITC staffs, I am privileged to have learned many new things, especially to RSG Laboratory staffs, Mr. Wan Bakx who provided me Landsat ETM 2004 although later on I found that I could not use the image. Also to Mr. Gerard Reinink for the guidance and valuable discussions on ENVI, and Mr. Boudewijn van Leeuwen for his support on ERDAS software. Over the course of the the world. Thus, thank one. I would gratitude Anggoro. I really thank Andrea, Wase, Rodrigo our thesis period.
last one and half years, I have made many friends from all over you very much for all of you for which I cannot mention one by my ITC Indonesian friends: Trias, Tatang, Muhy, Ari, Indra, and you for our brotherhood. To my M.Sc. cluster colleagues: Martha, and Karen, thank you very much for sharing me laughter during
I would not forget my own institute, Gadjah Mada University. I would express my thank to Dean of Agricultural Technology Faculty, Prof. Dr. Kapti Rahayu for giving me recommendation and permission to continue master degree at ITC, and to all staffs in Agro-industrial Technology Department, who always support my study here. Most importantly, I remain grateful to the Netherlands Education Center for providing me scholarship in the Netherlands. Without this scholarship, I would not go to this country to gain new knowledge and many valuable experiences.
ii
Table of Contents Abstract .............................................................................................................i Acknowledgements ...........................................................................................ii Table of Contents .............................................................................................iii List of Figures ................................................................................................... v List of Tables .................................................................................................... vi Chapter 1 ..........................................................................................................1 1.1. Research Background.................................................................................. 1 1.2. Definition of Illegal Logging.......................................................................... 2 1.3. Detection of Single Tree Felling with Soft Classifications ................................... 3 1.4. Research Objectives.................................................................................... 5 1.4.1. Main Objective ...................................................................................... 5 1.4.2. Specific Objectives................................................................................. 5 1.5. Research Questions .................................................................................... 5 1.6. Assumption ............................................................................................... 6 1.7. Conceptual Framework ................................................................................ 6 1.8. Structure of The Thesis ............................................................................... 8 Chapter 2 ..........................................................................................................9 2.1. Study Area ................................................................................................ 9 2.2. Datasets ................................................................................................. 10 2.2.1. Satellite Data ...................................................................................... 10 2.2.2. Field Data........................................................................................... 11 2.3. Training Data selection and Evaluation......................................................... 11 2.3.1. Training Data Selection ........................................................................ 11 2.3.2. Training Data Evaluation....................................................................... 12 2.4. Methods for Supervised Fuzzy Classification ................................................. 13 2.4.1. Supervised Fuzzy c-means Classification ................................................. 13 2.4.2. Neural Network Classification ................................................................ 15 2.5. Rule-Based Classification Approach ............................................................. 17 2.6. Assessment of Classification Accuracy ......................................................... 18 2.6.1. Error Matrix of Kappa Analysis ............................................................... 18 2.6.2. Entropy Measures ................................................................................ 18 Chapter 3 ........................................................................................................21 3.1. Preliminary Statistical Analysis ................................................................... 21 3.2. Classification Results................................................................................. 23 3.2.1. Fuzzy c-means Classification Result........................................................ 23 3.2.2. Neural Network Classification Results ..................................................... 24 3.2.3. Comparison of Classification Results ....................................................... 26 3.2.4. Principal Component Analysis ................................................................ 27 3.2.5. Single Tree Felling Map......................................................................... 27 3.3. Performance of Fuzzy c-means Classifier...................................................... 29
iii
Chapter 4 ........................................................................................................ 33 4.1. Classification Result .................................................................................. 33 4.2. Neural Network Learning Parameters .......................................................... 36 Chapter 5 ........................................................................................................ 37 5.1. Rule-Based Classification of Single Tree Felling ............................................. 37 5.2. Detection of Single Tree Felling: Alternative Approach ................................... 39 Chapter 6 ........................................................................................................ 41 6.1. Detection of Illegal Logging with Multi-Stage Classification ............................. 43 6.2. Management Applications .......................................................................... 44 6.3. Conclusions ............................................................................................. 45 6.4. Recommendations .................................................................................... 46 List of References ........................................................................................... 47 Appendices ..................................................................................................... 52
iv
List of Figures
Figure 1.1 First Stage of Single Tree Felling Classification ............................................6 Figure 1.2 Second Classification Stage......................................................................7 Figure 1.3 Third Stage of Classification .....................................................................8 Figure 2.1 Map and Landsat 7 ETM Images of the Study Area ......................................9 Figure 2.2 Fuzzy Classification Process.................................................................... 14 Figure 2.3 Illustration of a three-layered perceptron Neural Network........................... 16 Figure 2.4 Rule-Based Classification Method ............................................................ 17 Figure 3.1 Mean and Standard Deviation of Illegal Logging Point and Logged-Over Forest ................................................................................................. 21 Figure 3.2 Distribution of Canopy Cover Data of Illegal Logging Point and Logged-Over Forest ................................................................................................. 22 Figure 3.3 Results of Land Cover Classification in Subset of the Study Area.................. 24 Figure 3.4 Eigenvalue of Principal Component Analysis Bands .................................... 27 Figure 3.5 Single Tree Felling Map.......................................................................... 28 Figure 3.6 The 3D Visualization of Training Samples Feature Space using PARBAT ........ 29 Figure 3.7 Confusion Index Map and Chart of Single Tree Felling ................................ 30 Figure 4.1 Spatial Distribution of Unclear Single Tree Felling ...................................... 33 Figure 4.2 Accuracy Assessment of Selected Neural Network Classification................... 35 Figure 4.3 The Optimum Result of Second Stage Neural Network Classification............. 36 Figure 5.1 Single Tree Felling (STF) Pixels ............................................................... 38 Figure 5.2 Illegal Logging Points Map inside RKL 1 Boundary...................................... 38 Figure 5.3 Combination of Single Tree Felling (STF) of Maximum Likelihood & Second Order STF of Neural Network.................................................................. 40
v
List of Tables
Table 3.1 Selected Classification Accuracy Results................................................... 25 Table 3.2 Percentage of Major Land Cover Classes Produced in the First Stage of Classification ....................................................................................... 26 Table 3.3 Percentage of Single Tree Felling Pixels in the First Stage of Classification .... 28 Table 3.4 Membership Values and Entropy of Single Tree Felling Pixels Calculated from Test Datasets ...................................................................................... 31 Table 5.1 Percentage of Single Tree Felling Pixels in the RKL 1.................................. 39 Table 5.2 Alternative Condition of Single Tree Felling Percentage in the RKL 1............. 40
vi
APPLICATION OF MULTI-STAGE CLASSIFICATION TO DETECT ILLEGAL LOGGING WITH THE USE OF MULTI-SOURCE DATA
Chapter 1
Introduction 1.1. Research Background Forests are very important renewable natural resources providing various functions for human life. Many forests in developing countries have been deforested and degraded because of population growth, economic, political and social problem. The direct causes of deforestation and forest degradation are: shifting cultivation, agriculture expansion, fuel wood gathering, cattle ranching, and illegal logging. The Sustainable Forest Management concept is initiated to address many problems related to degradation of forests, especially those in developing countries. International Tropical Timber Organization (ITTO) pioneered in defining criteria and indicators (C&I) of natural tropical forests for sustainable forest management in the early 1990’s. ITTO is still aiming at achieving SFM by reviewing, assessing and monitoring forest towards the sustainable management (ITTO, 2004). Nowadays, sustainability of forest becomes a very crucial issue that invites different parties to be involved in the process. ITTO has defined the sustainable forest management (SFM) concept as the process of managing forests to reach particular management objectives that consider a continuous flow of forest products and services without any reduction in its values and future productivity and without giving any undesirable effect on the physical and social environment (ITTO, 2004). Many studies have been performed to identify factors that cause deforestation in developing countries. One of those factors is inappropriate agricultural technology used in farm land located around the forest area (Angelsen and Kaimowitz, 2001). The misuse of forest resources due to the centralization of forest management policy is considered as another factor for deforestation (Rosyadi et al., 2003). Moreover, Boltz (2003) mentioned that conventional logging operation with unplanned-selective logging method also become one factor of deforestation. However, the most important factor that causes deforestation comes from Illegal logging and trade (Atmopawiro, 2004; Zaitunah, 2004). According to Casson & Obidzinski (2002), Illegal logging is defined as the harvesting of logs in contravention of laws and regulations that were designed to prevent the overexploitation of forest resources and to promote sustainable forest management. It is estimated that illegal logging is generating between US$10 billion and $15 billion of forest losses every year (FAO, 2004). Indonesia, like many other developing countries, has a serious deforestation problem, which is mainly caused by illegal logging (Atmopawiro, 2004; Casson and Obidzinski, 2002; Currey et al., 2003; Zaitunah, 2004). This type of logging has invaded every forest, including protected areas and national parks, because of the overexploitation of 1
APPLICATION OF MULTI-STAGE CLASSIFICATION TO DETECT ILLEGAL LOGGING WITH THE USE OF MULTI-SOURCE DATA
timber (Currey et al., 2003). According to Smith (2002) more than 50% of the forest area in Indonesia is harvested illegally. In recent years, it becomes more difficult to isolate or stop the spread of illegal logging (Casson and Obidzinski, 2002). Under a new reformation regime, the Indonesian government issued decentralization policy in the forestry sector on 1999 to give more rooms for local government and communities to manage their forests. However, during this period, the deforestation rate has considerably increased and it even seems more difficult to be tackled properly (Casson and Obidzinski, 2002; Rosyadi et al., 2003). The Indonesian Ministry of Forestry noted that illegal logging had damaged 1.6 million ha of forests in Indonesia only from the period of January to July 2000 (Casson and Obidzinski, 2002). Over 70 percent of log production in Indonesia is derived from illegal sources. This number is equal to 50 million cubic metres of timber every year. Therefore, the study on illegal logging issue is still relevant and important to minimize the number and the spread of illegal logging, as well as to monitor, improve, and implement the concept of the Sustainable Forest Management. Based on the observation on the ground, illegal loggers have cut trees selectively, based on tree diameter and commodity species. The destruction of forests area caused by illegal logging looks similar to those of legal logging. Remotely sensed data is a promising tool, which can be used for detecting deforestation and selective logging in the tropical forest (Asner et al., 2002; Mas et al., 2004). In one study, Landsat 5 TM images were used to identify forest degradation and deforestation in Indonesia. It was identified that 11.7 million ha of concession forests in this country was highly degraded and deforested during the period of 1997 up to 2000. These forests area belong to 320 active concession holder companies which hold total concession area of 41.2 million ha (Stibig and Malingreau, 2003). This study concluded that illegal logging as well as legal logging could cause the destruction of forests. Most of concession holders in Indonesia have satellite image showing recent condition of their area. One of the requirements of SFM, which has to be submitted to the Indonesian Ministry of Forestry, is presentation of a satellite image in order to update the logging license every five year. However, many of those concession holders cannot properly utilize and extract information from this satellite image. This leads to the poor identification and monitoring of forest cover changes and the related problems, e.g deforestation and forest degradation, which can be detected using the satellite imagery. This study was conducted on a state-owned Forest Management Unit (FMU) in Indonesia, and using the result of the study, it can help the concession holding company to manage their forest area on a sustainable manner. The ultimate goal of sustainable forest management in Indonesia can only be achieved if majority of concession holders in the country has performed sustainable operation and management over their forest concession.
1.2. Definition of Illegal Logging Illegal logging does not have a clear defined term, but can be described as a forestry practice or activity that relates to wood harvesting, processing and trade which do not
2
APPLICATION OF MULTI-STAGE CLASSIFICATION TO DETECT ILLEGAL LOGGING WITH THE USE OF MULTI-SOURCE DATA
conform to law. Responding to the definition above, we can define that actors involved in such illegal logging can be through the chain from source to consumer (Four Corners, 2002). Moreover, the harvesting procedure itself is illegal, including corrupt means to gain access to forests, extraction without permission or from a protected area, cutting of protected species or extraction of timber in excess of legal limits. Illegalities also occur during transportation, including illegal processing and export as well as incorrect declaration to customs, before the timber enters the legal market. Timber can also be considered illegal if the plantations are not properly managed. This includes (Four Corners, 2002): - Clear-cutting natural forest, then failing to replant. - Not planting at rates required to maintain long-term production. - Replanting with low-quality species. - Replanting at low density. This study concentrates on particular case of illegal logging in a form of single tree felling, which is located outside a legal cutting block boundary. The terms of illegal logging in a Remote Sensing study has to be defined as a physical matter, which reveals a unique reflectance data presents in the satellite image. Using Remote Sensing data, detection of forest cover changes is easier when it occurs within one year period. Because the nature of forest regeneration capability can cover up these changes even after one year (Bhandari, 2003; Fauzi, 2001; Zaitunah, 2004).
1.3. Detection of Single Tree Felling with Soft Classifications One important part of the provision of environmental information by remotely sensed data is achieved through image classification (Lillesand and Kiefer, 1994). This image classification relies on the assumptions that the study area are structured by a number of unique, internally homogeneous classes and that classification analysis based on reflectance data and ancillary data can be used to identify these unique classes with the aid of ground data. Several recent studies related to image classification were done in the tropical forest, detecting forests cover changes due to forests harvesting (Atmopawiro, 2004; Bhandari, 2003; Cui Yijun, 2003; Dahal, 2002; Fauzi, 2001; Zaitunah, 2004). These studies used Landsat images as main input data to perform image classification. One of studies made use of ancillary data, e.g slope and elevation, in the classification (Zaitunah, 2004). Another study used combination of optical satellite data and radar data (Fauzi, 2001). Different image classification techniques were applied to detect degradation and deforestation on a tropical forest. Fauzi (2001) studied on the detection of logged-over forest using neural network method and compared the result with those of maximum likelihood method. Bhandari (2003) detected logged-over forest using subpixel classifier and forest canopy density mapping and again, compared the classification result with fused image of maximum likelihood classification. Atmopawiro (2004) was able to detect illegal logging by means of sub pixel classification with a reasonable accuracy. Zaitunah (2004) identified physical factors that were affecting illegal logging using statistical approach and forest canopy density method.
3
APPLICATION OF MULTI-STAGE CLASSIFICATION TO DETECT ILLEGAL LOGGING WITH THE USE OF MULTI-SOURCE DATA
In his study, Elias (1995) mentioned that the opening area caused by a single tree felling ranged between 285 to 512 m2, with an average of 396 m2. Using Landsat 7 ETM+ data with 30 meters resolution, one pixel covers 900 m2 of the area. Identification of an object which has size less than a single pixel is not recommended using hard (or conventional) classifier, such as maximum likelihood (Foody, 1996a; Foody, 1996b; Gopal et al., 1999; Zhang and Foody, 1998; Zhang et al., 2004). Detection of single tree felling by means of conventional classifier can not give satisfactorily results, as reported by several recent studies (Bhandari, 2003; Cui Yijun, 2003; Dahal, 2002; Fauzi, 2001; Zaitunah, 2004). Maximum likelihood method is developed for the classification of classes with the assumption that each pixel is pure and the object of interest is considered to be discrete and mutually exclusive (Foody, 1996a; Zhang et al., 2004). In the maximum likelihood, pixels are labelled to the class which has the highest posterior probability of membership (Lillesand and Kiefer, 1994). This technique is often incapable to perform satisfactorily in the presence of mixed pixels, in which each pixel is occupied by more than one category (Zhang and Foody, 1998). Another assumption in maximum likelihood method is that the spectral intensities of the classes follow a normal distribution. Limitations of the algorithm may be one of the reasons, which can reduce the performance of such technique. Single tree felling, occupying less than one pixel size, may be identified as mixed pixels, so-called fuzzy pixels. Fuzziness often occurs due to the presence of mixed pixels (particularly for coarse spatial resolution remotely sensed imagery) which are not completely occupied by a single, homogenous category (Zhang and Foody, 2001). Another study mentioned that mixed pixels occurs because of the class overlapping and the absence of sharp class boundaries (Kent et al., 1997). So-called “soft” classifier is a technique that certainly can improve the classification of mixed pixels (Cannon et al., 1986; Foody, 1996a; Hegde, 2003). There are two “soft” classification methods that are widely used for image classification, namely fuzzy classification (Atkinson et al., 1997; Foody, 1996a; Zhang et al., 2004) and neural network (Foody, 1996a; Mas et al., 2004). Fuzzy classifier works based on membership function and membership value (Bezdek et al., 1984). On the other hand, neural network method works based on interconnected network of processing elements in order to find the optimal result (Atkinson and Tatnall, 1997; Gahegan et al., 1999; Mas et al., 2004; Moody et al., 1996). A possibility of integration between different classification techniques was found in a few studies. Those studies mentioned that the combination of more than one type of classifier, i.e. maximum likelihood and multi-layer perceptron (MLP) neural network was more powerful and attaining the advantage of integration of different mathematical models, and therefore, it could improve the final classification results (Huurneman and Broekema, 1996; Kanellopoulos and Wilkinson, 1997). Moreover, Richard (1993) mentioned that integration of expert system and neural network classification has a potential to improve the classification accuracy.
4
APPLICATION OF MULTI-STAGE CLASSIFICATION TO DETECT ILLEGAL LOGGING WITH THE USE OF MULTI-SOURCE DATA
This study applied multi-stage classification method of supervised fuzzy classification that is based on fuzzy c-means clustering algorithm (Lucieer, 2004; Palubinskas et al., 1995; Zhang and Foody, 1998; Zhang and Foody, 2001; Zhang et al., 2004) and neural network classification method. The neural network method has capability to use multisource data such as satellite image, Digital Elevation Models (DEM), and texture data (Bruzzone et al., 1997; Skidmore et al., 1997). This study used these multi-source data for the classification of single tree felling. Integration of expert knowledge was carried out in the rule-based classification in order to provide more reasonable detection of illegal logging in the area.
1.4. Research Objectives 1.4.1.
Main Objective
To develop a method that can provide more reliable detection of illegal logging in a form of single tree felling by means of multi-stage classification of multi-source data.
1.4.2.
Specific Objectives
The following explains specific objectives of the study: a. To assess the performance of fuzzy classifiers (i.e. supervised fuzzy c-means classifier and neural network method) and conventional classifier (i.e. maximum likelihood method) to detect single tree felling. b. To explore the performance of multi-source data classification (i.e. satellite images, ancillary data and texture data) using neural network method to classify unclear single tree felling pixels. c. To perform rule-based/knowledge classification in detecting illegal logging points in the study area.
1.5. Research Questions This study would answer the following questions: a. Is there a difference in the canopy cover between illegally-logged and selectively (legally) logged-over forests? b. In the first stage of classification: 1. Considering the use of original Landsat data or Principal Component Analysis (PCA) bands as the input for the classification, which of these inputs performs better for the fuzzy c-means, neural network and maximum likelihood classification in detecting single tree felling? 2. How would the fuzzy classifiers (i.e. supervised fuzzy c-means classification and neural network method) perform in comparison to hard classifier (i.e. maximum likelihood method) in detecting single tree felling? 3. Which factors affect performance of the fuzzy c-means classification in identifying single tree felling? c. In the second stage of classification: 1. What is the performance of the neural network method in classifying unclear pixels of single tree felling class? 2. What is the performance of ancillary and texture data in the neural network classification? 5
APPLICATION OF MULTI-STAGE CLASSIFICATION TO DETECT ILLEGAL LOGGING WITH THE USE OF MULTI-SOURCE DATA
3. Considering the possibility of neural network in adopting multi source data classification, what is the effect of incorporating ancillary data and texture data in the neural network classification on the accuracy of the result? d. In the third stage of classification, how does expert knowledge contribute to the identification of illegal logging?
1.6. Assumption Illegal logging points are located outside the boundary of legal cutting blocks as planned by the Forest Management Unit (FMU).
1.7. Conceptual Framework This study approached detection of illegal logging using three classification stages. First, the detection of illegal logging was started with land cover classification, which distinguished several forest classes existing in the study area (i.e. clear cut forest, single tree felling point, sparse forest, and high density forest). Besides, some non forest classes were found in the area, i.e. road, river and hill shadow, were considered. The three classification techniques, i.e. fuzzy c-means, neural network and maximum likelihood method are applied using seven bands Landsat 7 ETM images and the transformed image data of principal component analysis (PCA). Afterwards, accuracy of the classification results was assessed using confusion matrix and Khat statistics. These accuracy values are used to determine the best input of each classification technique and to select the best map among those classification methods to be used in further analysis. Fuzzy c-means Classification Neural Network Method Maximum Likelihood Method
Landsat 7 ETM Image
PCA Bands Transformation
Results Clear Single Tree Felling Pixels
Unclear Single Tree Felling Pixels
Selecting The Best Classification Result of each Classifier
Separating pixels of single tree felling class from other land cover classes
Accuracy Assessment using Confusion Matrix and Khat Statistics
Figure 1.1 First Stage of Single Tree Felling Classification (Land Cover Classification)
Regarding to the first classification stage, land cover maps produced by fuzzy c-means, neural network and maximum likelihood methods at some extent, showed different spatial distribution of single tree felling class. However, some pixels were assigned as single tree felling class by the three classification methods at the same time. Those pixels were separated and defined as clear single tree felling class. For pixels which were
6
APPLICATION OF MULTI-STAGE CLASSIFICATION TO DETECT ILLEGAL LOGGING WITH THE USE OF MULTI-SOURCE DATA
assigned as single tree felling by one or two classification methods, they were defined as unclear single tree felling class and used in the second classification. Figure 1.1 shows the first stage of classification process. In the second classification stage, multi-layer perceptron (MLP) neural network was applied (Figure 1.2) to classify unclear pixels of single tree felling class. Neural network was used in these ‘difficult’ pixels since they were not separated as particular data distribution which could be well modelled using a statistical classifier such as conventional classifier (Kanellopoulos and Wilkinson, 1997). In his study, Wilkinson (1995), showed that multiple stage classification such as the combination of maximum likelihood and neural network has improved the overall accuracy of complex land cover classification result up to 12 percent. This study was trying to provide evidence that the application of multiple-stage classification technique could improve the detection of single tree felling in the study area.
Unclear Single Tree Felling Pixels Texture Data
Neural Network Classification
Ancillary Data
Result Second Order Single Tree Felling Pixels
Selecting the Best Second Order Single Tree Felling Map
Evaluation of Ancillary And Texture Data Performance in the Classification
Figure 1.2 Second Classification Stage (Unclear Single Tree Felling Pixels Classification)
Besides original DN values of the unclear pixels, ancillary and texture data were taken into consideration as other inputs in the neural network. Some studies showed that the performance of neural network technique was improved by deliberately enhancing the features of the input using additional features that provide extra information, either extracted from the image or from ancillary datasets (Kanellopoulos and Wilkinson, 1997; Mas et al., 2004). Here and further we make a difference between the data derived from satellite data (e.g texture) and ancillary data (e.g DEM, slope). The ancillary data used in this study were elevation and aspect maps resulted from 10 meters of contour map. Texture data of variance and skewness were calculated from the satellite image and used as additional inputs in the neural network. The consideration of the use of ancillary and texture data were to improve the classification accuracy, which was assessed using confusion matrix and Khat statistics. The final map resulted from the second stage classification described second order of single tree felling class and other forest classes, e.g. sparse forest and high density forest.
7
APPLICATION OF MULTI-STAGE CLASSIFICATION TO DETECT ILLEGAL LOGGING WITH THE USE OF MULTI-SOURCE DATA
Clear Single Tree Felling Pixels
Rule-Based/ Knowledge-Based Classification
Second Order of Single Tree Felling Pixels GIS Layers
Result Comparison of The Result with Previous Study
Illegal Logging Map
Figure 1.3 Third Stage of Classification (Identification of Illegal Logging Using RuleBased Classification)
In the third stage, single tree felling pixels resulted from the first and the second stage classifications were used as inputs in the rule-based classification with the supports of GIS layers, i.e. road distance and slope map. Experts knowledge was elaborated in setting the threshold for those GIS data, resulting the illegal logging map from this final classification stage. The pattern of final illegal logging map depends on the decision of the experts in determining threshold value for each criterion of the GIS data. Therefore, some experiences and knowledge regarding the characteristics of illegal logging in the area are needed to properly set up this value as it can provide a proper illegal logging map. Comparison to other studies was carried out as the final analysis to observe the difference in the number of illegal logging points which were found in a legal cutting block.
1.8. Structure of The Thesis The thesis report comprises of six chapters. The first chapter discusses mainly study background, research problems, objectives, research questions and conceptual framework. In chapter two, methods and materials are briefly discussed, explaining the study area, datasets, selection and evaluation of training data, background of fuzzy cmeans and neural network classifications, and accuracy assessment techniques. Chapter three presents the first stage of fuzzy classification results, having a discussion on the performance of fuzzy c-means classifier. Chapter four explains the result of second stage of neural network classification and experiment on network parameters. In chapter five, the third stage of rule-based classification is discussed, presenting comparison analysis as a final part of the analysis. In chapter six, synthesis and conclusions are presented. The results of the study are explained and linked. The main conclusions are explained, followed by recommendations which explain possibilities for further research.
8
APPLICATION OF MULTI-STAGE CLASSIFICATION TO DETECT ILLEGAL LOGGING WITH THE USE OF MULTI-SOURCE DATA
Chapter 2
Methods and Materials 2.1. Study Area The study considers a forest in Labanan concession area, Berau municipality, East Kalimantan Province, Indonesia. The Forest area is under management of PT Hutan Sanggam Labanan Lestari (formerly PT Inhutani I Labanan), which geographically lies between 1° 45’ to 2° 10’ N, and 116° 55 and 117° 20’ E. Figure 2.1 shows the location of the study area.
Figure 2.1 Map and Landsat 7 ETM Images of the Study Area (Projected in UTM Zone 50 North, Datum WGS 84)
Labanan concession area is situated in inland of coastal swamps and consists of undulating to rolling plains, with isolated masses of high hills and mountains. This variation in topography is a consequence of folding and uplift of rocks, resulting from tension in the earth crust. According to Mantel (1997), Labanan landscape can be classified into flat land, sloping land, steep land, and complex landforms. Forest type of Labanan is often called lowland mixed dipterocarp forest because of the dominance in the canopy and the emergent stratum of the family of the Dipterocarpaceae. The most common genera within this family are Shorea, Dipterocarpus, and Vatica. While common species are Shorea parvifolia, Dipterocarpus acutangulus, Shorea pinanga and Shorea hopeifolia (Dahal, 2002). The concession area covers 83,240 ha of total area. According to regional land use plan, Labanan area is allocated into three land use types. There are 54,567 ha of Fixed Production Forest, 26,997 ha of Limited Production Forest and 1,676 ha of Non Production Forest (Zaitunah, 2004) Labanan concession area is divided into seven five-year working plan areas or Rencana Karya Lima Tahun (RKL). The management works in each RKL for five years before they 9
APPLICATION OF MULTI-STAGE CLASSIFICATION TO DETECT ILLEGAL LOGGING WITH THE USE OF MULTI-SOURCE DATA
move to other RKL. Further, each RKL is divided into five annual working plan areas or Rencana Karya Tahunan (RKT). Former company which hold this concession, PT Inhutani I, started logging activities since year 1976 until early 2003 when there was an agreement between District Government of Berau, PT Inhutani I, and a local company on joint cooperation of the concession area. They established a share company called PT Hutan Sanggam Labanan Lestari on 4 February 2003. In year 2003, the management unit has been harvesting forest in RKL 6 area for three consecutive years. Although for year 2004, Indonesian Forestry department did not issue a license to harvest the forest, the management of concession still continues their work to maintain the forest resource and logging roads of the area.
2.2. Datasets 2.2.1.
Satellite Data
This study used seven bands of Landsat 7 ETM images (path 117 Row 59) acquired on 31st of May 2003. The Landsat datasets were geometrically corrected and registered to a WGS 84 datum and UTM projection with an RMS error less than 1.0 pixel. A subset of Labanan concession area with size of 521 x 501 pixels (the area is shown inside a red box in Figure 2.1) was used for the classification in order to optimize effort and time for land cover classification. For the input of first stage of classification, seven bands of Landsat data or transformation of the original image using Principal Component Analysis (PCA) were taken into consideration. The first three bands of PCA images were used in the classification as these bands contribute higher variance compared to the other PCA bands (Figure 3.4). This method may be useful to reduce the number of input bands used in the classification (Jensen, 1996). The use of PCA algorithm is based on the consideration that multi-band of visible/nearinfrared images of vegetated areas exhibits negative correlations between the nearinfrared and visible red bands and positive correlations among the visible bands because of typical characteristics of vegetation. The presence of correlations among the bands of a multispectral image implies redundancy in the data (Mather, 2004). Transformation of original satellite images using PCA can result in a new principal component images that may be more interpretable than the original data (Singh and Harrison, 1985). Landsat ETM data were also used as the input of neural network in the second stage of classification, particularly for pixels which were in the first stage of classification assigned as “unclear pixels”. Totally, there were 70,375 of unclear single tree felling pixels resulted in the first classification stage. Therefore, each input data in the first classification stage should be masked, contained only the data which was reflecting these unclear pixels. Ancillary data derived from Digital Elevation Models (DEM) map was prepared for the identification of illegal logging, i.e. slope, aspect, and elevation. The other two additional inputs were texture data, i.e. variance and skewness, which were derived from the
10
APPLICATION OF MULTI-STAGE CLASSIFICATION TO DETECT ILLEGAL LOGGING WITH THE USE OF MULTI-SOURCE DATA
original Landsat data. In the second stage of classification, multi-source data of neural network classification was conducted using the following input combinations: a. Landsat ETM image only. b. Landsat image plus ancillary data (i.e. elevation and aspect). c. Landsat image plus texture data (i.e. skewness and variance). d. All available input data (i.e. ETM bands, ancillary data, and texture data)
2.2.2.
Field Data
Fieldwork was carried out in the study area for five weeks from early September until mid October 2004 for collecting ground truth data. In general, two types of data were collected during the field work period: point data and sample plots. Those data consisted of several important variables, such as land cover type, canopy cover, and gap size for illegal logging spots. In addition, sample plots data recorded tree species, number of trees, and major tree height in one plot. Field data were collected using purposive sampling, as illegal logging points were selected purposively based on the field condition and limited fieldwork period for collecting random sample inside a natural forest. This study used ground truth data from year 2003 and the data which were collected during field work period. Selection of the data used for the classification, particularly for illegal logging points, was carried out carefully in order to get a reliable sampling unit. For the classification, this study was taking into account only the illegal logging points, located in the newly logged points. It means that the classification used illegal logging points which were recorded within a year before the Landsat ETM satellite images was acquired on 31st May 2003. Since it is realized that the opening due to selective logging in spatial pattern as practised by management of the concession or by illegal loggers does not exist for a long period because of fast growing nature of tropical forest (Asner et al., 2002).
2.3. Training Data selection and Evaluation 2.3.1.
Training Data Selection
Selection of training data in the study was using Landsat 7 ETM+ false colour composite of band 4, 5, 3 used in RGB layers. Subset of Labanan concession used for the classification covered RKL 1 area where many illegal logging spots were found. This study applied multi-stage classification to detect single tree felling. As a consequence, the available ground truth data should be properly divided for the purpose of the classifications. In the first stage of classification, field data recorded illegal logging points and other forest classes were divided into two datasets. There were 424 sample data used in the first stage, including 59 samples of illegal logging point, in order to train the classification. Another 192 independent data, including 30 samples of single tree felling class, were collected separately as test data in order to assess accuracy of the classification results. For the second stage of classification, training and test data were selected carefully within unclear single tree felling pixels, giving a result of six land cover classes (i.e. single tree felling, sparse forest, high density forest, road, hill shadow, and river). There 11
APPLICATION OF MULTI-STAGE CLASSIFICATION TO DETECT ILLEGAL LOGGING WITH THE USE OF MULTI-SOURCE DATA
were 365 sampling units, including 47 points of single tree felling pixels, selected carefully to train the network. For the accuracy test, 105 sampling units, including 15 points of single tree felling were independently collected.
2.3.2.
Training Data Evaluation
Evaluation of training data was carried out using Transformed Divergence distance algorithm, to examine statistically the separability of selected training data for each class. The transformed divergence was computed using following equation (Vatsavai et al., 2001): − Divergab ⎛ 8 TDab = 2000⎜1 − e ⎜ ⎝
⎞ ⎟ ⎟ ⎠
(2.1)
where Divergab is the divergence between the classes a and b, computed with, Diverg ab =
[
(
)]
[(
)
]
1 1 −1 −1 −1 −1 (M a − M b )(M a − M b )T (2.2) tr (Va − Vb ) Vb − Va + tr Va + Vb 2 2
Here tr[.] indicates trace of matrix, Va and Vb are the covariance matrices for any given classes. The transformed divergence takes values in the range from 0.0 to 2.0. A transformed divergence value of 2.0 suggests excellent separation between classes. More than 1.9 provides good separation, while below 1.7 is poor (Jensen, 1996). There were six classes of forest and two non-forest classes identified beforehand and used as the training data in the first classification stage. The forest classes were labelled as high density of logged-over forest, selectively logged forest, sparse forest, very sparse forest, single tree felling, and clearcut forest. Two non-forest classes, i.e. road and hill shadow, were identified separately. Definition of classes was set-up based on the ground truth data and visual observation on the multi-spectral satellite image. Finishing several training data collections and evaluations, land cover classes in the study area were best-separated as high density forest, sparse forest, single tree felling, clear cut forest, road, and hill shadow. In general, the result of analysis showed that majority of classes was well-separable, with the lowest values of 1.70 between single tree felling and sparse forest classes. The completed result of training data evaluation for the first stage of classification is shown in Appendix 1. For the second classification stage, training data evaluation showed good separability between the majority of predefined forest classes, namely single tree felling, sparse forest, road, high density forest, hill shadow and river. A possibility to incorporate elevation and aspect data in the evaluation was explored, giving a relatively higher separability value than the use of Landsat data only. This might be a good indication that the addition of such data in the classification could provide better accuracy. The complete results of training data separability test for the second classification stage are listed in Appendix 2.
12
APPLICATION OF MULTI-STAGE CLASSIFICATION TO DETECT ILLEGAL LOGGING WITH THE USE OF MULTI-SOURCE DATA
For research purpose, satellite image was geometrically corrected using ERDAS IMAGINE 8.6, and digitally processed using ENVI 4.0. The latter software was also used for the application of maximum likelihood classification. Neural network classification was implemented using the neural network module, developed in IDL language programming language, applying back-propagation learning algorithm (Rumelhart et al., 1986). Fuzzy c-means classification was carried out using prototype of PARBAT software developed by Lucieer (2004).
2.4. Methods for Supervised Fuzzy Classification A number of approaches can be used to perform supervised fuzzy classification. Here, the two approaches for fuzzy classification applied in the study are briefly discussed.
2.4.1.
Supervised Fuzzy c-means Classification
This study used fuzzy c-means (FCM) method proposed by Cannon (1986) in order to perform a fuzzy supervised classification. In general, this method may subdivide a dataset into c-clusters or classes. It begins by assigning pixels randomly to classes and by iterative operations, it moves pixels to other classes to minimize the generalised least-squared-error (Foody, 1996a). This is a such condition in which unsupervised method was applied for image classification. For fuzzy supervised classification, we may change the algorithm that is used to derive an unsupervised classification. For doing this, the class centroids are determined from the training data giving the result of fuzzy membership value for a single pixel in each land cover class. The supervised fuzzy c-means classification is based on the fuzzy c-means clustering algorithm (Bezdek et al., 1984). Let X = {x1, x2,…, xn} be a sample of n observations (pixels) in an s-dimensional Euclidian space (s is a number of spectral bands in the image). A fuzzy clustering is represented by a fuzzy set {Uc x n|µik ∈ [0.0,1.0]} with reference to n pixels and c clusters or classes. The interpretation is that U is a real c × n matrix consisting of elements denoted by µik, and µik is the fuzzy membership value of an observation xk for the ith cluster. The fuzzy membership values range from 0.0 and 1.0 and are positively related to the strength of membership of a pixel to a specified class.
13
APPLICATION OF MULTI-STAGE CLASSIFICATION TO DETECT ILLEGAL LOGGING WITH THE USE OF MULTI-SOURCE DATA
Figure 2.2 Fuzzy Classification Process adopted from Hegde (2003)
There are various algorithms that aim to derive an optimal fuzzy c-means clustering. One widely used method operates by minimizing a generalized least squared error function, called Jm, n
c
J m = ∑ ∑ (µ ik ) m (d ik )2
(2.3)
k = 1i = 1
where m is the weighting exponent that controls the degree of fuzziness (increasing m 2 is a tends to increase fuzziness usually, the value of m is set between 1.5 and 3.0), d ik
measure of the distance between each observation (xk) and a fuzzy cluster center (νi) (Bezdek et al., 1984). Often, the Mahalanobis distance algorithm is used for pixels clustering. This distance is calculated with 2 d ik = ( x k − ν i )T C −1 ( x k − ν i )
(2.4)
where C is the covariance matrix of the sample x, and superscript T indicates transposition of a matrix. The Euclidian distance from pixel i to cluster center k is calculated with n
2 d ik = ∑ ( x il − c kl )2
(2.5)
l =1
And the centroids cj are computed as n
m c kl = ∑ u ki x il i =1
14
n
∑ u kim
i =1
(2.6)
APPLICATION OF MULTI-STAGE CLASSIFICATION TO DETECT ILLEGAL LOGGING WITH THE USE OF MULTI-SOURCE DATA
This is simply a weighted average (with the elements u being the weights) of all pixels with respect to center (1 ≤ j ≤ p). The term xil is the measurement of the i-th pixel (1 ≤ i ≤ n) on the l-th spectral band or feature. Each of the membership grade values uij is updated according to its Euclidian distance from all cluster centres, 1
u ik = p
⎛ d ik
∑ ⎜⎜
c = 1⎝ d ck
2 ⎞ (m − 1)
(2.7)
⎟ ⎟ ⎠
where 1 ≤ i ≤ p and 1 ≤ k ≤ n (Bezdek et al., 1984). The procedure converges when the elements of membership grade matrix differ by no more than a small amount between iterations. This study, however, used Euclidian distance as well as Mahalanobis distance algorithm to observe the effect on the classification accuracy. The minimization of the error function Jm begins from random setting of µik. An optimal fuzzy partition is then sought iteratively to derive an unsupervised classification. The algorithm can, however, be modified for the derivation from the training data. This reduces the fuzzy c-means clustering algorithm to a one-step calculation, resulting in the fuzzy membership value for each pixel in each of the defined classes. The classified pixels resulted from fuzzy classification must be converted to “crisp” in order to properly represent the final map. Some functions may be used for the defuzzification of these classified pixels. This study made use of maximum function in this stage.
2.4.2.
Neural Network Classification
Neural Network are essentially learning systems that is based on interconnected networks of simple processing elements (Wilkinson et al., 1995). In general, there are three phases in neural network classification. The first phase is a training procedure, using input data. The second is a validation phase that determines the success of training phase and the accuracy of the network when it is applied to unseen data. The last one is a classification phase which produces land cover map of an area (Gahegan et al., 1999). The use of neural network for multi source data classification is based on a consideration that the data used as inputs for the neural network do not need to be normally distributed. The combination of images and ancillary data can violate normality assumption that is required by most statistical classifiers, such as maximum likelihood, due to the different nature of these types of data (Tso and Mather, 2001). This study implemented three-layered neural network consisting of a single input, hidden, and output layer, so-called multi-layer perceptron (MLP) neural network. The MLP neural network which is trained by back-propagation algorithm is commonly used for the image classification in Remote Sensing (Kanellopoulos and Wilkinson, 1997).
15
APPLICATION OF MULTI-STAGE CLASSIFICATION TO DETECT ILLEGAL LOGGING WITH THE USE OF MULTI-SOURCE DATA
Source: Mas (2004)
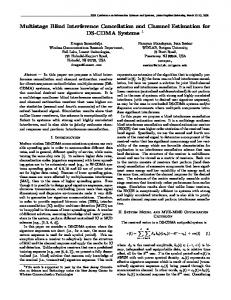
Figure 2.3 Illustration of a three-layered perceptron, with a single input, hidden, and output layer. In this study input X1, X2, …, X6 are explanatory variable that used multi sources data (i.e. Landsat ETM dataset, ancillary data, and texture data). Y1 and Y2 are two output variables (e.g. single tree felling area, sparse forest, etc), representing land cover classes.
The input to a node in a neural network is the weighted sum of the outputs from the layer below, that is, net j = ∑ w ji oi (2.8) i
This weighted sum is then transformed by the node activation function, usually a sigmoid function to produce the output node,
oj =
1 1 + exp(−net j + θ j )
(2.9)
where θj, m, and k, are constants. The study, however, used sigmoid activation function to produce the output node. This function is often used in the neural network, resulting output from the node, a value between 0.0 and 1.0 (Mather, 2004) Weights are updated during the training process according to the so-called “generalized delta rule”: ∆w ji (n + 1) = η(δ j oi ) + α∆w ji (n) (2.10) Where ∆w ji (n + 1) is the change of a weight connecting nodes i and j, in two successive
layers, at the (n+1)th iteration, δj is the rate of change of error with respect to the output from node j, η is the learning rate, and α is a momentum term. Learning rate is an adaptation of simple back-propagation algorithm, which is used to reduce training time and maintain stable convergence. This algorithm is very slow in the training stage, because it requires small learning rates for stable training. Adjusting learning rate to a higher value, the training time may be reduced, however it results in a more unstable training, and the network is more reluctant to be trapped in the local minima rather than the global one.
16
APPLICATION OF MULTI-STAGE CLASSIFICATION TO DETECT ILLEGAL LOGGING WITH THE USE OF MULTI-SOURCE DATA
Momentum, on the other hand, is another adaptation of the simple back-propagation, which allows the neural network to respond not only to the local gradient, but also to recent trends in the error surface. This has effect of acting like a low pas filter, which allows the network to ignore small features in the error surface, so that the network is less prone to becoming trapped in local minima (Danaher et al., 1997). Further details on the neural network may be found in Atkinson and Tatnall (1997).
2.5. Rule-Based Classification Approach Rule-based or knowledge-based approach was applied for the final classification stage. Knowledge can either be declarative, which consists of facts and relationships, or procedural mostly program codes that facilitate the identification and classification of the image features (Karanja, 2002). The proliferation of systems that support declarative knowledge representation is attributed to the fusion of artificial intelligence techniques in computer vision. As mentioned in the study, knowledge is what can be expressed as a rule of thumb, and when applied effectively can lead to a better understanding of the investigated problem. A Remote Sensing study conducted by Vatsavai (2001) used spectral and spatial knowledge system to derive image feature space and improved the classification of maximum likelihood method. The use of additional information such as topographic map is also considered as knowledge classification system (Danudoro, 1993). Another study by Liu (2001) used integration of expert system and neural network classification achieving a significantly higher overall classification accuracy compared to the separate use of back-propagation neural network, expert system and maximum likelihood.
Input Combined Single Tree Felling Pixels
Criteria
Result IF (Condition) Then (action)
Illegal Logging Map
Slope
Road Distance
Figure 2.4 Rule-Based Classification Method
In this study, expert knowledge was reflected in a set of rules used to identify more possible single tree felling pixels which can be better defined as illegal logging. The threshold of those rules, taking into consideration GIS criteria (i.e. distance from the main road and terrain slope), were obtained from the findings of previous study and the investigation conducted by management of the concession area. As depicted in Figure 2.4, rule-based classification was applied using simple conditional if-then rules statement. The input for this classification was a combination of first order
17
APPLICATION OF MULTI-STAGE CLASSIFICATION TO DETECT ILLEGAL LOGGING WITH THE USE OF MULTI-SOURCE DATA
single tree felling (result of the first classification stage) and second order single tree felling (outcome of the second stage of classification). Comparison with other study on the number of illegal logging points found inside legal cutting block boundary was conducted as the final part of the analysis. The implementation of rule-based classification was based on the consideration that integration of Remote Sensing data and expert knowledge can provide better information on the identification of illegal logging in the study area.
2.6. Assessment of Classification Accuracy 2.6.1.
Error Matrix of Kappa Analysis
Performance of each classifier was assessed using an error matrix, also called confusion matrix. This matrix compares the relationship between the known reference data and the corresponding result of classification. Several characteristics of classification performance, such as producer accuracy, users accuracy, and overall accuracy, are computed in order to analyze the accuracies differences between the two classification results (Congalton, 1991). Kappa analysis of Khat statistics is computed, consecutively, taking some inputs from the confusion matrix. This statistics is calculated using formula: r
K hat =
N ∑ xii − i =1
2
N −
r
r
∑ ( xi + × x + i )
i =1
(2.11)
∑ ( xi + × x + i )
i =1
where N is the total number of correctly classified pixels and xii is number of correctly classified pixels for each class. While, xi+ and x+i are total numbers of pixels in each row and in a column of confusion matrix, respectively. A Khat statistics is a measure of how well the remotely sensed classification agrees with the reference data. A value of 0.0 indicates no agreement, while a value of 1.0 shows perfect agreement the classifier output and the reference data. Monserud and Leamans (1992) cited by Mather (2004) suggest that a value of of Kappa of 0.75 or greater shows a ‘very good to excellent’ classifier performance, while a value of less than 0.4 is ‘poor’. Values of Kappa are often calculated when two classifications or more are compared (Mather, 2004). If these classification results obtained from the use of different classifiers applied to the same dataset, then comparison of Kappa values is acceptable, otherwise, percent accuracy (overall and each class) of confusion matrix provides as much, if not more, information. Further information on the accuracy assessment techniques may be found in Congalton (1991), Congalton and Green (1999), Mather (2004), and Jensen (1996).
2.6.2.
Entropy Measures
An alternative strategy which may be used in this study to assess the accuracy of fuzzy c-means classification is based on entropy values. Entropy is a measure of uncertainty
18
APPLICATION OF MULTI-STAGE CLASSIFICATION TO DETECT ILLEGAL LOGGING WITH THE USE OF MULTI-SOURCE DATA
and information formulated in terms of probability theory (Klir and Folger, 1988). In probability theory, uncertainty may be expressed in terms of relative support associated with mutually exclusive alternative land cover classes. When two or more alternatives classes have non-zero probabilities associated with them then each probability is in conflict with the others. When there is a finite set of alternative classes the expected value of conflict is given by Shannon entropy (Maselli et al., 1994; Taneja, 2001). This may be used to describe the variations in class membership probabilities associated with each pixel. Entropy, H, may be calculated from the class membership using formula: H = ∑ p(x) ln p(x)
(2.12)
where H is entropy of the system; p(x) is probability of occurrence of level x. When applied to the classification of a pixel, p(x) values are the fuzzy c-means probability membership values with respect to class x. If a pixel is found to have a maximum probability of belonging to a class, p for that class will be 1 and that of all other class will be 0. Consequently, the probability entropy, H, will equal to 0. On the other hand, if the membership probabilities of all categories have similar values, H will reach maximum level. The relative entropy (ratio of observed to maximum entropy) can be used to indicate the confidence of a classification, with pixels showing a low relative entropy assumed to be well-classified and those with a high relative entropy were poorly classified (Maselli et al., 1994).
19
APPLICATION OF MULTI-STAGE CLASSIFICATION TO DETECT ILLEGAL LOGGING WITH THE USE OF MULTI-SOURCE DATA
Chapter 3
First Stage of Fuzzy Classification 3.1. Preliminary Statistical Analysis An attempt to determine the differences of forest structure between unlogged forests and logged-over forests using parametric statistical tests was conducted by Fauzi (2001), showing the fact that basal area, tree density, and canopy closure in unlogged forest were significantly higher than those in the logged-over area. These three criteria were often used to explain structure of a forest. Basal area describes the area which is occupied by tree stand, usually calculated in a hectare area. The second criterion, tree density, measures total number of trees in a plot or in a hectare area. Additionally, canopy closure or crown cover, measures percentage of the area in a plot which is covered by tree covers.
Crown Cover
80
A
60
A
40
20 n=75
Ille ga l Log gin g P oint
S
n=43
Lo gg ed O ve r
Land cover Figure 3.1 Mean and Standard Deviation of Illegal Logging Point and Logged-Over Forest
Identification of illegal logging points based on visual interpretation of coarse resolution satellite image, such as Landsat ETM, is a difficult task. The reason for this is that illegal logging and logged-over areas look quite similar in terms of colour and tone. Direct investigation on the field found that canopy gap on those areas were quite similar in size, although there are some differences revealed from the evidences left inside the area, e.g. structure of harvested trees, logging tracks pattern, and deposit of harvested timbers in a lot of illegal logging points.
21
APPLICATION OF MULTI-STAGE CLASSIFICATION TO DETECT ILLEGAL LOGGING WITH THE USE OF MULTI-SOURCE DATA
Based on ground truth data collected on the field, statistical analysis was carried out to examine the differences between two classes of forest, namely logged-over forest and illegal logging site. The available data for crown cover or canopy closure between those classes were then statistically compared. The result of descriptive statistics analysis showed that the average crown covers for selectively logged-over forests and illegal logging points are 81.22 and 41.78 (shown in Figure 3.1). In simple terms, one can say that forest structure, represented by crown cover condition, in logged-over area was better than in the area where illegal logging was located. The following statistical analysis was carried out to examine significant difference between those two forest classes. The Kolmogorov-Smirnov normality test was used to examine whether canopy cover data follows normal distribution (Figure 3.2). The test used null hypothesis that data was not normally distributed. In general, an asymptotic significance value of (ρ) ≤ 0.05 is considered as a good evidence that the data was not normally distributed. The result of statistical test showed that canopy cover on illegal logging area was normally distributed (Z = 0.688, ρ = 0.710, α = 0.05, two-tailed test), whereas for the canopy cover on logged forest rejected normality assumption (Z = 1.37, ρ = 0.039, α = 0.05, two-tailed test). The Mann-Whitney test and the related Wilcoxon test are nonparametric alternatives to the independent-samples t-test. Like the t-test, Mann-Whitney test examines the null hypothesis that two independent samples were collected from the same population. Rather than parameters of a normal distribution, such as mean and variance, the Wilcoxon and Mann-Whitney statistics are based on ranks (SPSS Marketing Department, 1999). Illegal Logging Point
Logged Over
Count
12
8
4
0 20
40
60
Crown Cover
80
20
40
60
80
Crown Cover
Figure 3.2 Distribution of Canopy Cover Data of Illegal Logging Point and Logged-Over Forest
Using the null hypothesis that canopy covers on selectively logged forests is different than that those on illegal logging points. The Mann-Whitney test revealed that canopy cover on logged-over forests were significantly different than on illegal logging points (Z
22
APPLICATION OF MULTI-STAGE CLASSIFICATION TO DETECT ILLEGAL LOGGING WITH THE USE OF MULTI-SOURCE DATA
= -8.231, ρ = less than 0.001, α = 0.05, two-tailed test). This could be due to the fact that many of illegal logging points, situated in the forested area had been harvested previously by the concession. As mentioned earlier, illegal logging points have quite similar pattern of canopy cover compared to logged-over forest, however the result of statistical analysis shows that these two forest classes can be separated. Differences in the canopy cover can be reflected into different spectral values which may be captured by satellite image. Hence, this study explored capabilities of Landsat ETM satellite image to detect such spectral differences, for the detection single tree felling.
3.2. Classification Results 3.2.1.
Fuzzy c-means Classification Result
There were seven Landsat ETM bands which were used for image classification. Since based on training data evaluation, this bands combination provided better training evaluation result compared to the use of multi-spectral bands (band 1-5, and band 7) of Landsat ETM data. Besides the original image, the first three bands of principal component analysis were also used in the classification. A qualitative observation on the classification result (Figure 3.3) showed that fuzzy cmeans produced a reasonable result in overall, except for river class which was underclassified. High density forest class was extended to larger areas, leaving fewer pixels assigned as sparse forest and hill shadow. The fuzzy exponent, fuzziness or overlap parameter determines the amount of fuzziness or class overlap. If this parameter is close to 1.0, allocation is crisp and no overlap is allowed (Lucieer, 2004). For large values, there is a complete overlap and all clusters are identical. The fuzziness of the classification can be modulated by varying the magnitude of the fuzziness parameter. Ideally, it should be chosen to match the actual amount of overlap. However, class overlap is generally unknown. Although the fuzziness parameter is often set between 1.5 and 3.0, no clear arguments for the choice of these values are presented (Foody, 1996a; Zhang and Foody, 2001). This study used fuzzy overlap value of 2.0. Some attempts to adjust this overlap value from 1.5 to 3.0 were performed; however it did not change completely the fuzzy c-means classification result. This may be caused by the nature of training data which is less-sensitive to this adjustment or limitation of prototype software which need further development. Clustering of unclassified pixels was carried out by measuring the distance (dissimilarity) between each observation (pixel) and a fuzzy cluster center by means of certain clustering algorithm. This study applied Euclidian and Mahalanobis clustering algorithms to measure such distance. Using Mahalanobis distance algorithm, the fuzzy c-means was more aggressive to classify single tree felling (STF) class resulting higher classification accuracy of single tree felling class compared to the Euclidian distance algorithm.
23
APPLICATION OF MULTI-STAGE CLASSIFICATION TO DETECT ILLEGAL LOGGING WITH THE USE OF MULTI-SOURCE DATA
Landsat ETM Image (Using Band 4,5 and 3 in the RGB Layers)
Fuzzy c-means Classification Result using Euclidian Distance Method with fuzzy overlap of 2.0
Classes Unclassified Single Tree Felling Sparse Forest Road Clear Cut Forest High Density Forest Hill Shadow River Maximum Likelihood Method Using Non Threshold Value
Neural Network Classification Result (3-layer, 7500 iterations, 21 hidden nodes)
Figure 3.3 Results of Land Cover Classification in Subset of the Study Area
In general, classification accuracy of fuzzy c-means using Euclidian distance is slightly higher than the accuracy of Mahalanobis distance as presented in Table 3.1. Thus, Euclidian distance was used for further analysis.
3.2.2.
Neural Network Classification Results
In the following analysis, Landsat ETM data was used as an input for neural network classification and single hidden layer architecture was applied. Kanellopoulos (1997) in his study has found that the use of a single hidden layer was sufficient for most classification problems, however, once the number of inputs gets near 20, additional flexibility was required as provided by a two hidden layer network.
24
APPLICATION OF MULTI-STAGE CLASSIFICATION TO DETECT ILLEGAL LOGGING WITH THE USE OF MULTI-SOURCE DATA
Table 3.1 Selected Classification Accuracy Results Original Landsat ETM Data Single Tree Felling accuracy
Overall accuracy
Maximum Likelihood - No Threshold - Threshold value 0.1
73% 73%
Fuzzy c-means - Euclidian distance - Mahalanobis distance Neural Network - 7500 iterations 21 nodes - 5000 iterations 7 nodes
Principal Component Bands
Kappa
Single Tree Felling accuracy
Overall accuracy
Kappa
78% 77%
0.75 0.74
57% -
76% -
0.71 -
53% 77%
73% 69%
0.68 0.64
57% 80%
73% 69%
0.68 0.64
77% 77%
75% 74%
0.71 0.70
60% 67%
76% 74%
0.72 0.70
By default, neural network application used the equal number of hidden nodes as the number of input variable. Skidmore, et al. (1997) found that the use of minimum number of hidden nodes in the neural network significantly reduced the average training accuracy, resulting in a lower accuracy of the classification result. His study found that mean training accuracy increased as more hidden nodes were added. Another study mentioned that it was sometimes useful to make the number of hidden nodes roughly equal to two or three times the total number of input classes (Kanellopoulos and Wilkinson, 1997). This study used two variations of hidden nodes number, which are equal and three times of the total input number used in the neural network, while holding other parameters constant. Analysis on the classification results found that the use of more hidden nodes number in the neural network made the network architecture more complex, causing more complicated computation for training the network, which in turn needed more iterations to reach global minima. As a comparison, neural network with 7 hidden nodes reached convergence point after 5,000 iterations, whereas the use of 21 hidden nodes in the network resulted in longer training of 7,500 iterations in order to generate a similar training accuracy. Neural network was trained using back-propagation learning algorithm with learning rate and momentum value of 0.2 and 0.4, respectively. Learning rate reflects on the training speed, while momentum describes the sensitivity of the network to error surface. This study tried to use some variations on these parameters, and found that higher learning rate value should be balanced with the higher value of momentum; otherwise training stage became unstable and was trapped into local minima condition. Total system Root Mean Squared (RMS) error of 0.0001 was determined as a convergence point. Training was stopped when convergence was reached, or the network reached an asymptote point when training accuracy started decreasing. Some variations in number of iterations had been used in training the network (up to 10,000 iterations) and classification accuracy was recorded after each 2,500 iterations. Applying 21 hidden nodes in the network, training accuracy was increased as the training iterations increased, and converged after 7,500 iterations. The network appeared to be over-
25
APPLICATION OF MULTI-STAGE CLASSIFICATION TO DETECT ILLEGAL LOGGING WITH THE USE OF MULTI-SOURCE DATA
trained as the number of iterations approached 10,000 iterations, resulting slightly higher training accuracy but lower classification accuracy. According to the accuracy assessment on classification results, the best performance of neural network was achieved with 21 hidden nodes when the network was trained for 7,500 iterations (Table 3.1). This combination of parameters was used for further analysis.
3.2.3.
Comparison of Classification Results
The performance of those classification approaches was assessed using error matrix. According to the assessment results, neural network outperformed maximum likelihood in classifying single tree felling class but was less accurate in classifying other land cover classes resulting in a lower overall accuracy (Table 3.1). In general, fuzzy c-means performed less satisfactorily, compared to other classification approaches i.e. neural network and maximum likelihood, to classify single tree felling class. Table 3.2 Percentage of Major Land Cover Classes Produced in the First Stage of Classification Land Cover Class High Density Forest Sparse Forest Single Tree Felling
Fuzzy c-means
Neural Network
Maximum Likelihood
47% 26% 13%
24% 36% 22%
24% 30% 22%
Table 3.2 was computed based on Figure 3.3, showing percentages of major land cover
classes produced by fuzzy c-means, neural network and maximum likelihood. The computation results also showed that all classifiers agreed on the first three major land cover classes (though in different order) in the subset of study area. Fuzzy c-means classifier was more conservative in number (13% of pixels) than other classifiers (22% of pixels) in assigning single tree felling class. This was particularly the case when Euclidian distance was used in the fuzzy c-means classification. This may lead to the less accurate classification result for single tree felling class as compared to the neural network and the maximum likelihood. A qualitative observation on Figure 3.3 showed that neural network was classifying single tree felling in a large extents area, which was even more aggressive than the maximum likelihood. However, from Table 3.2, those two classifiers appeared to assign exactly the same number of pixels as single tree felling class (22% of total pixels). In general, both neural network and maximum likelihood produced quite similar spatial distributions of major land cover classes. Fuzzy c-means classifier, on the other hand, produced a different classification result where majority of pixels (47% of total pixels) were assigned as high density forest class. This was quite different compared to the equally-like distribution between those three forest classes (i.e. sparse forest, single tree felling, and high density forest), as shown by other classifiers.
26
APPLICATION OF MULTI-STAGE CLASSIFICATION TO DETECT ILLEGAL LOGGING WITH THE USE OF MULTI-SOURCE DATA
3.2.4.
Principal Component Analysis
The use of principal component analysis (PCA) algorithm was encouraged by the presence of correlations among multispectral bands of a satellite image, which implies redundancy in the data (Jensen, 1996). Thus, these bands should be transformed and reduced so that they can be easily interpreted and used in the classification.
Figure 3.4 Eigenvalue of Principal Component Analysis Bands
Using the first three PCA bands (covering 97.9% of variance of the data, shown in Figure 3.4) as an input for each classification technique the accuracies of classified images were lower in case of conventional maximum likelihood and neural network. The PCA bands, indeed, has included most of the variance in the data; however it did not include the most important difference which is needed for the classifications. This study dealt with subtle differences in the pixel colour, as the single tree felling occupied less than a size of single pixel. These PCA bands has performed better for fuzzy c-means classification, which slightly outperformed the accuracy of single tree felling class for both Euclidian and Mahalanobis distance algorithm (Table 3.1). However, the fact that fuzzy c-means is working better on the PCA bands is not sufficient to turn a conclusion to opposite one, because the difference in accuracies is very small. According to overall classification accuracies, the original seven bands of Landsat ETM image was outperforming PCA bands image in two out of three classification approaches used in this study. Thus, instead of PCA bands, the original Landsat data were used for further analysis.
3.2.5.
Single Tree Felling Map
Considering the optimum performance of each classification technique, single tree felling class pixels found by each technique were separated from other land cover classes. Those pixels, where fuzzy c-means, neural network and maximum likelihood techniques labelled as single tree felling class, were assigned as clear single tree felling. The other 27
APPLICATION OF MULTI-STAGE CLASSIFICATION TO DETECT ILLEGAL LOGGING WITH THE USE OF MULTI-SOURCE DATA
pixels were masked and assigned as unclear pixels and used as inputs for the second stage of classification. The accuracies of those clear single tree felling pixels were assessed by error matrix using the same test data which were used in the first stage of classification. The result of assessment showed that only 53.3% of pixels were correctly classified as single tree felling class by the three classifiers. Using training datasets, the accuracy was slightly increased (to 57.6%). These values probably manifest more the conformity between three classifiers rather than accuracy assessment of single tree felling class. As each classifier had a different algorithm in classifying pixels, calculation of the error matrix resulted in a lower conformity level, even when the clear single tree felling pixels were assessed using dependent training data. The result of this study is almost similar with the result of a study conducted by Paola and Schowengerdt (1995) which reported that only 62% of classified pixels, produced by the neural network and maximum likelihood classifiers, were in agreement. Figure 3.5 is presenting the combination of clear and unclear single tree felling pixels.
Figure 3.5 Single Tree Felling Map
One of the consequences is the fact that land cover maps produced by the three classifiers, show quite different results for certain land cover classes (shown in Figure 3.3). For instance, fuzzy c-means classified fewer pixels of single tree felling class, compared to the neural network and the maximum likelihood classifiers, while the accuracy assessment in Table 3.1 shows quite similar accuracy result for single tree felling class. Table 3.3 Percentage of Single Tree Felling Pixels in the First Stage of Classification
Clear Pixels Unclear Pixels Unclassified Total Area
28
Number of Pixels
Percentage
Size of the area (ha)
18,033 70,375 172,613 261,021
6.9% 27% 66.1% 100%
1,623 6,334 15,535 23,492
APPLICATION OF MULTI-STAGE CLASSIFICATION TO DETECT ILLEGAL LOGGING WITH THE USE OF MULTI-SOURCE DATA
Calculation of single tree felling pixels (shown in Figure 3.5) is presented in Table 3.3, demonstrating that only 18,033 pixels or 6.9% of total study area were classified as ‘clear pixels’. At the same time, 70,375 pixels or 27% of total pixels in the study area were classified as ‘unclear pixels’. These ‘unclear pixels’ were masked and used as the inputs for second stage of classification.
3.3. Performance of Fuzzy c-means Classifier The fuzzy c-means classification technique plays an important role for this study. Moreover, the performance of this method raises very important issues, as discussed in this section. Some recent studies reported that the use of fuzzy c-means classifier can accurately improve the classification of mixed pixels (Foody, 1996a; Foody, 1996b). However, given the accuracy assessment results, it was found that the fuzzy c-means classification had lower performance compared to neural network and maximum likelihood classifiers. Less accurate result in classifying single tree felling class can be caused by significant degree of overlapping between training sample of high density forest class and single tree felling class, as shown in Figure 3.5. This figure is depicting three-dimensional visualization of feature space of each land cover training samples with RGB combination of band 4, 5 and band 3 of Landsat data, correspondingly. The yellow sphere represents training samples of single tree felling which is overlapping with high density forest training data (represented by light green sphere). This caused high confusion for every classifier; although fuzzy c-means performed worse than the other classifiers in this specific condition.
High Density Forest Training Sample
Single Tree Felling Class Training Sample
Figure 3.6 The 3D Visualization of Training Samples Feature Space using PARBAT. The yellow sphere represents single tree felling class training data, while the light green sphere, which is overlapped by the yellow sphere (pointed by red arrow), represents high density forest class training data
Analysis of single tree felling pixels was continued by measuring the uncertainty of land cover class represented in a pixel using confusion index (Hegde, 2003). The confusion index (CI) is the ratio of the second highest class membership value to the highest
29
APPLICATION OF MULTI-STAGE CLASSIFICATION TO DETECT ILLEGAL LOGGING WITH THE USE OF MULTI-SOURCE DATA
membership value of that pixel which is scaled in the interval of 0.0 to 1.0.The greater the CI value for a pixel, the more the classification uncertainty of that particular pixel is.
1
0
Figure 3.7 Confusion Index Map and Chart of Single Tree Felling
Figure 3.7 showed that higher CI pixels are located in the area which mostly identified as single tree felling class by fuzzy c-means classification (indicated by red box). These relatively high confusion index values are another indication that the high degree of overlapping of high density forest and single tree felling class caused the fuzzy c-means classifier to perform less accurately. Inappropriate accuracy assessment procedure used in this study can be another issue that caused less accurate classification results. As mentioned by Foody (1996a), the measures of classification accuracy derived from the confusion matrix are inappropriate for the evaluation of fuzzy classifications, as it does not take into account the presence of mixed pixels and neither does accommodate fuzzy ground truth data in the assessment. A number of methods have been proposed to measure classification accuracy of fuzzy classification with emphasis on fuzzy measures. Gopal and Woodcock (1994), in their study suggested several classification indicators derived from fuzzy sets techniques which may be used for the situation where there is ambiguity in the ground data but not in classification output. Other approaches are based on entropy measures (Maselli et al., 1994). Entropy is a measure of uncertainty and information formulated in terms of probability theory, which expresses the relative support associated with mutually exclusive alternative classes (Foody, 1996a). Entropy is maximised when the probability of class membership is partitioned evenly between all defined classes in the classification and minimised when it is associated entirely with one class. Therefore, the use of entropy values as an indicator of classification accuracy assessment is implicitly based on the assumption that in an accurate classification each pixel will have a high probability of membership with only one class. Provided the fact that the higher the entropy value of a pixel corresponds to the lower probability of particular pixel belongs to a single class, then the pixel is classified less accurately.
30
APPLICATION OF MULTI-STAGE CLASSIFICATION TO DETECT ILLEGAL LOGGING WITH THE USE OF MULTI-SOURCE DATA
Overlaying the entropy values with the membership values maps, one may conclude that many pixels with high entropy values have almost equal distribution of the membership values. In order to provide more evidence, calculation of entropy values of single tree felling pixels were carried out using Shannon entropy algorithm, taking the data from test datasets. The membership values of single tree felling pixels for the whole subset of the study area were also computed. This resulted in a considerably high mean entropy value of 1.71 within range of 0.04 - 2.80 with a standard deviation of 0.44. Thus, the domination of mixed pixels with close membership values pixels might give difficulties for fuzzy cmeans classifier to label these pixels as one land cover class in a map. The selected entropy and membership values were exhibited in Table 3.4. The more completed results of such entropy values were shown in Appendix 7. Table 3.4 Membership Values and Entropy of Single Tree Felling Pixels Calculated from Test Datasets
0.03
0.00
0.00
High Density Forest 0.07
0.01
0.01
Single Tree Felling
0.7656
0.33
0.04
0.00
0.00
0.57
0.03
0.03
High Density Forest
1.5062
0.34
0.19
0.00
0.01
0.41
0.02
0.02
High Density Forest
1.8391
0.46
0.05
0.00
0.01
0.32
0.07
0.08
Single Tree Felling
1.9006
0.44
0.07
0.00
0.01
0.19
0.12
0.17
Single Tree Felling
2.1544
0.19
0.20
0.07
0.19
0.15
0.09
0.11
Sparse Forest
2.7225
Single Tree Felling 0.87
Sparse Forest
Road
Clear Cut Forest
Hill Shadow
River
Land Cover
Entropy
As mentioned earlier in this section, the accuracy measure shown by confusion matrix does not take into account the presence of mixed pixels condition. However, the use of confusion matrix makes it possible to compare the result of fuzzy c-means classification with the other techniques, such as conventional maximum likelihood, which cannot be assessed using entropy values or other fuzzy-based measure.
31
APPLICATION OF MULTI-STAGE CLASSIFICATION TO DETECT ILLEGAL LOGGING WITH THE USE OF MULTI-SOURCE DATA
Chapter 4
Second Stage of Neural Network Classification 4.1. Classification Result The use of ancillary data in multi-source neural network classification was motivated by some recent studies, which mentioned that such data can improve the training speed and overall performance of neural network (Bruzzone et al., 1997; Mas et al., 2004; Skidmore et al., 1997). Additional features derived from ancillary data that provide extra information can improve the classification accuracy (Kanellopoulos and Wilkinson, 1997). However, one should be careful as the use of such features also increases the dimensionality of the feature space, which in turn can make the training more difficult to converge. Therefore, the selection of additional features should be undertaken very carefully. The DEM related data (i.e. slope, aspect, and elevation) was derived from 10 meters contour map. Slope was then used for the input of the rule-based classification, whereas aspect and elevation fed as the inputs in the second stage of neural network classification. As mentioned earlier (section 1.7), the addition of aspect and elevation had improved the average separability between classes; this was a good indication that those data could also improve the accuracy of neural network classification.
Projection : UTM Zone 50 North Datum : WGS 84
Figure 4.1 Spatial Distribution of Unclear Single Tree Felling Class in RGB Landsat ETM Image Band 4, 5 and 3
33
APPLICATION OF MULTI-STAGE CLASSIFICATION TO DETECT ILLEGAL LOGGING WITH THE USE OF MULTI-SOURCE DATA
In his Remote Sensing study, Hepner (1989) used 14 types of texture data as the inputs for neural network in order to improve the classification performance using minimal training data. Another study conducted by Skidmore (1997) found that the use of texture data, i.e. skewness and variance, which was combined with Landsat TM data and GIS layers resulted higher classification accuracy compared to the use of Landsat TM and GIS data only. This study, however, did not intend to explore the optimal combination of texture data which could improve the classification accuracy, and thus, simply used two types of texture data, i.e. variance and skewness, as the input of neural network. Skewness may be derived from the original Landsat data using window size (across which texture is evaluated) varied between 3 by 3, 5 by 5, and 7 by 7. Using the Landsat TM image, Skidmore (1997) found that skewness within 5 by 5 moving windows and variance within 7 by 7 windows, had a significantly higher training and test data than the other size of moving window. Since this study used the same type of satellite image, we derived skewness and variance using the same size of moving window as mentioned in the study of Skidmore. In principle, two texture features could have been computed for each of the ETM band. In practice, in order to select only the texture data which provided the largest amount of texture information, such strategies were taken into consideration. For each Landsat ETM band, the mean value of data class variance and skewness were computed (i.e. the greylevel variance and skewness were computed for each land-cover class and the mean value was estimated). The band with the maximum value of such mean variance and skewness were selected. The result of mean variance calculation is shown in Appendix 3. Landsat ETM band 5 (i.e. middle infra red band) was selected according to the results of such strategy. In the following analysis, neural network was trained with respect to some variations on input data and number of hidden nodes. As mentioned earlier, this study used threelayered neural network architecture, using respectively single layer for input, hidden layer, and output layer. Some adaptive learning parameters, namely learning rate and momentum, were used to make the learning process run faster. Learning rate and momentum of the network respectively were 0.2 and 0.4. The training process was stopped when neural network reached asymptote point or Total Root Mean Square (RMS) Error was less than 0.0001. According to the accuracy assessment, the result showed that the use of Landsat ETM and ancillary data had improved the overall accuracy of neural network by 20% compared to the use of Landsat ETM data alone. However, the use of texture data in neural network made the network more complex and resulted in the lower overall classification accuracy. Based on the observation of texture data, we found that skewness had negative values range from -0.37 to 0.26, with an average of -8.0⋅10-6. The Transformed Divergence separability test indicated that the incorporation of variance and skewness with Landsat data produced lower separability values as some distance calculation resulted in zero values of separability.
34
APPLICATION OF MULTI-STAGE CLASSIFICATION TO DETECT ILLEGAL LOGGING WITH THE USE OF MULTI-SOURCE DATA
The use of texture data could improve the classification results, after combined with the Landsat ETM and ancillary data. The accuracy results of selected neural network classification were carried out using confusion matrix and demonstrated in Figure 4.2. 100.00% 80.00% 60.00% 40.00% 20.00% 0.00% ETM data
ETM data & ETM data & Texture Data Ancillary Data
Single Tree Felling Accuracy
All Input Data(1)
All Input Data & GIS C riteria(2)
Overall Accuracy
Figure 4.2 Accuracy Assessment of Selected Neural Network Classification
(1), (2)
An experiment was carried out to use a slope map and a road distance map as additional inputs in the second stage of neural network classification in order to observe the possibility to exclude the third stage of rule-based classification of this study. This addition, moreover, had made the network converged after 1500 iterations compared to 5000 iterations with the use of all previous input data. However, the classification results showed that the addition of these two maps resulted in a less accurate result than the use of all possible data without taking the slope and distance map into consideration. Figure 4.2 showed that the use of all input data (i.e. Landsat ETM, ancillary, and texture data) was the optimal combination for neural network achieving the classification accuracy of 80% for single tree felling class, and 88.6% of overall accuracy. Output of the optimal second stage neural network classification result is shown in Figure 4.3.
(1)
All input data refers to Landsat ETM, Ancillary data (i.e. elevation & aspect), and Texture Data (i.e. variance
& skewness). (2)
All input data & GIS criteria refers to input data mentioned in (1) plus GIS criteria (i.e. distance from the
main road & slope map) 35
APPLICATION OF MULTI-STAGE CLASSIFICATION TO DETECT ILLEGAL LOGGING WITH THE USE OF MULTI-SOURCE DATA
Classes Single Tree Felling Sparse Forest Road High Density Forest Hill Shadow River
Figure 4.3 The Optimum Result of Second Stage Neural Network Classification
4.2. Neural Network Learning Parameters This study showed that the use of multi-stage classification approach using integration of multi-source data (e.g. satellite data and DEM) had made possible the identification of illegal logging on the study area. However, the reliability of information which was provided by the result of the classification should be importantly considered. Neural network with its capability to accommodate multi-source data has shown good performance in the second stage of unclear single tree felling pixels classification as shown in Figure 4.2. Performance of this method can be improved if parameters of the network (e.g. number of layer, hidden nodes, learning rate, etc) were optimized. Trial and error experiments should be carried out in order to find the best-suited parameters which are suitable with characteristics of the training data. Moreover, these experiments were not explored intensively in this study because of limitation in research time. Experiments on neural network parameters were carried out, resulting in some preliminary findings as follows: a. The training accuracy was increased as the number of hidden nodes increased, until it reached an asymptote point when training accuracy started to decrease due to over-training. b. There was a tendency of positive correlation between number of hidden nodes and number of iterations needed by neural network to be converged.
36
APPLICATION OF MULTI-STAGE CLASSIFICATION TO DETECT ILLEGAL LOGGING WITH THE USE OF MULTI-SOURCE DATA
Chapter 5
Third Stage of Rule-Based Classification 5.1. Rule-Based Classification of Single Tree Felling Rule-based classification was started by setting the threshold value of certain GIS criteria (i.e. distance from the main road and slope) which was based on experts judgment and the results of previous studies. Bhandari (2003) found that 99% of illegal logging in year 2002 were located within 1 km distance from the main logging road. While, based on data recorded in 2003, illegal logging extended to a large area (i.e. within 2 km from the main road). However, 67% of illegal logging points in 2003 were within 1 km distance from the road (Zaitunah, 2004). Management of the concession area noted 90% of illegal logging points were found within 1 km distance from the main logging road. During the field work, it was found that many illegal logging points were found in RKL 1 and RKL 7. Location of the main logging road and entrance to the concession which passed trough the RKL 1, made this area more reluctant for illegal logging. On the other hand, timber harvesting on the RKL 7 which will be started in 2006, made this RKL had less activity and more attractive for illegal loggers to cut timbers in the area. Another criterion considered in the classification was slope of terrain. Interview with the management of the concession noted that illegal logging was often located in the less steep area providing more open access for trespasser to easily cut the trees in that area. According to the study conducted by Bhandari (2003), 95.6% of illegal logging points were within 20 degree of slope. This was supported by another study which noted that 90.6% of illegal logging was located within the same slope area (Zaitunah, 2004). Combining first order and second order single tree felling pixels, the accuracy assessment of confusion matrix was applied, resulting 53.3% and 80% accuracies of the first order and second order single tree felling classes, respectively. Compensating lower accuracy of first order single tree felling class, these pixels had a middle accuracy of 62.2%. According to experts knowledge, this study assumed that illegal logging points were within 1 km distance from the main logging road, and within 20 degree of slope. The result of illegal logging map is exhibited in Figure 5.1.
37
APPLICATION OF MULTI-STAGE CLASSIFICATION TO DETECT ILLEGAL LOGGING WITH THE USE OF MULTI-SOURCE DATA
Figure 5.1 Combination of First and Second Order of Single Tree Felling (STF) Pixels (Top Left), Illegal Logging Map with Slope ≤ 20, within 1 km distance from the main road (Top Right)
As mentioned earlier, the Labanan concession area was divided into seven cutting block areas (RKL’s), where the management is working in each block for the period of five year. Based on the recent investigation from the management of the concession, most illegal logging site are located in the RKL 1 and in the RKL 7. Previous studies identified illegal logging percentage in RKL 1 in 2002 and 2003 using IMAGINE Subpixel classifier. However, this study used multi stage classification approach, by selecting subset on RKL 1 (Figure 5.2), so that the result was comparable to those other studies.
Figure 5.2 Illegal Logging Points Map inside RKL 1 Boundary
Bhandari (2003) concluded that 3% of total RKL 1 area was illegally-logged in 2002. This number increased incredibly in year 2003 to 30% (Zaitunah, 2004). These two studies used ERDAS IMAGINE subpixel classifier to detect illegal logging in the same study area.
38
APPLICATION OF MULTI-STAGE CLASSIFICATION TO DETECT ILLEGAL LOGGING WITH THE USE OF MULTI-SOURCE DATA
Table 5.1 Percentage of Single Tree Felling Pixels in the RKL 1
Total RKL 1 area First Order Single Tree Felling Second Order Single Tree Felling Total Illegal Logging Pixels *
Number of Pixels
Percentage*
Size of The Area (ha)**
74,941 6,424 4,969 11,393
100% 8.6% 6.6% 15.2%
6,745 578.2 447.2 1,025
using number of pixel of RKL 1’s total area as denominator
**
number of pixel times 30mx30m pixel size
This recent study addressed the detection of illegal logging using integration of multistage classification, utilizing multi-source data in the classification. Given the result in Table 5.1, around 8.6% of the RKL 1 areas were identified as illegal logging, taken into consideration first order single tree felling pixels only. While using the total single tree felling pixels, around 15.2% of the total RKL 1 area was illegally-logged. The result of this study was comparable with other study conducted in 2004, as both studies used the same Landsat ETM image. Nevertheless, this recent study found much lower illegal logging rate (15%) than the finding of previous study (30%).
5.2. Detection of Single Tree Felling: Alternative Approach The following experiment was conducted in order to find different spatial distribution and percentage of illegal logging which could provide better detection of illegal logging in the study area. In the first stage of classification, single tree felling class of maximum likelihood was masked, while other pixels were used for the input in the second classification stage. The same input data (i.e. Landsat ETM, ancillary data, and texture data) and procedure were used in the second stage of neural network classification, resulting in different land cover classification. The single tree felling class in this classification stage was selected and then combined with the clear single tree felling pixels produced by the first classification of maximum likelihood method. As shown in Table 3.1, the first classification of maximum likelihood showed relatively higher accurate results of 73% and 78% for single tree felling class and overall accuracy, respectively. Given the result of this experiment, those accuracy results were increased considerably in the second classification of neural network, resulted in 71.43% of single tree felling class accuracy and 92.86% of overall accuracy. The combination of clear pixels and unclear pixels of single tree felling pixels resulted in this experiment gave an accuracy of 72%, higher than the first combination of single tree felling pixels (62.2% of accuracy), discussed in section 5.1. In the rule-based classification, this experiment used the same assumptions of GIS criteria (i.e. distance from the main road ≤ 1km and slope ≤ 20 degree) in order to eliminate less possible single tree felling (STF) pixels. Number of single tree felling pixels in the final illegal logging map (presented in Figure 5.3 Bottom) was calculated, and the results are presented in Table 5.2. 39
APPLICATION OF MULTI-STAGE CLASSIFICATION TO DETECT ILLEGAL LOGGING WITH THE USE OF MULTI-SOURCE DATA
Figure 5.3 Combination of Single Tree Felling (STF) of Maximum Likelihood & Second Order STF of Neural Network (Top Left), STF Map with Slope ≤ 20, within 1 km distance from the main road (Top Right), and STF Map inside RKL 1 Boundary (Bottom)
This alternative approach found that the percentage of illegal logging in the RKL 1 was 31.6%, quite similar result compared to the other study conducted in 2004, which found around 30% of illegal logging in year 2003. Table 5.2 Alternative Condition of Single Tree Felling Percentage in the RKL 1
Total RKL 1 area First Order Single Tree Felling Second Order Single Tree Felling Total Illegal Logging Pixels *
Number of Pixels
Percentage*
Size of The Area (ha)**
74,941 13,009 10,664 23,673
100% 17.4% 14.2% 31.6%
6,745 1,171 959.8 2,130.8
using number of pixel of RKL 1’s total area as denominator
**
number of pixel times 30mx30m pixel size
Further issue which may arise from the final outcome of this study, is the validation of the final illegal logging map which can not be demonstrated due to unavailability of 40
APPLICATION OF MULTI-STAGE CLASSIFICATION TO DETECT ILLEGAL LOGGING WITH THE USE OF MULTI-SOURCE DATA
validation datasets. Ideally, after the final illegal logging map was produced, another field work should be conducted in order to collect more data that could be used for validating the classification results. This validation datasets can also be used to assess the performance of GIS rules in the third stage of rule-based classification. Moreover, limited number of test data made the validation not possible, as this test data has already been used in accuracy assessment of the first and second stage of classification.
41
APPLICATION OF MULTI-STAGE CLASSIFICATION TO DETECT ILLEGAL LOGGING WITH THE USE OF MULTI-SOURCE DATA
Chapter 6
Synthesis and Conclusions 6.1. Detection of Illegal Logging with Multi-Stage Classification The main objective of this research is to develop a method that can provide better detection of illegal logging in the tropical forest by means of multi-stage classification which incorporates multi-source data (e.g. satellite data and expert knowledge). The whole contents of the research reflect to this objective. The identification of illegal logging is a difficult task with the use of a coarse resolution satellite image, such as Landsat 7 ETM. A preliminary statistical analysis was carried out to explore the differences in canopy cover of logged-over forest and illegallylogged forests. Using Mann-Whitney test, it was found that the canopy cover in the logged-over forest is significantly higher than in the illegal logging points. This might be used as an indication that forest cover in logged-over area is denser than those in the illegal logging points. The differences in the forest cover can result in the different pixel spectral values in a satellite image. This finding leads to the next step of the detection of illegal logging in a form of single tree felling by applying Landsat ETM data and multi stage classification technique. Another finding in this study explained that the use of different classification techniques results in a different accuracy with a low conformity level of single tree felling class between classifiers, namely maximum likelihood, fuzzy c-means, and neural network. This low conformity level is due to the differences in classifier algorithms. As mentioned by Liu (2001), in digital image processing different classification algorithm would produce different classification and eventually result in different mapping accuracies. Another issue that may cause lower accuracy or lower agreement of clear single tree felling pixels is the sample space difference between single tree felling pixels and the test datasets. Some single tree felling pixels of the test datasets are excluded after the selection of clear single tree felling pixels. Qualitative observation on this image was carried out, showing that some samples from test dataset, which were located in the further distance from the main road remained unclassified. This consequently can have an effect on the accuracy assessment with confusion matrix. Multi-source data of neural network classification was used in the second stage of classification to classify unclear single tree felling pixels producing second order single tree felling (STF) class. The use of ancillary and texture data in the neural network was explored and it was proved that it can improve the classification accuracy by 20% compared to the use of Landsat ETM data alone.
43
APPLICATION OF MULTI-STAGE CLASSIFICATION TO DETECT ILLEGAL LOGGING WITH THE USE OF MULTI-SOURCE DATA
The performance of multi-stage classification in detecting single tree felling pixels was also explored in this study. In the first stage of classification, the highest accuracy of single tree felling class was 77%, shown by neural network method. This accuracy was slightly increased to 80% of accuracy in the second stage of neural network classification. Higher differences were expressed by the overall classification accuracy. Maximum likelihood classifier produced the highest overall accuracy in the first classification stage by 78% of accuracy, whereas in the second stage of classification, the best combination of neural network revealed 89% of overall accuracy. The second order single tree felling (STF) pixels were combined with the first order STF pixels and then assessed using confusion matrix. The assessment results expressed that combination single tree felling pixels produced in the first and second classification had an accuracy of 62.2%. Using another multi-stage classification approach, this accuracy was increased to 72% with respect to clear single tree felling pixels of maximum likelihood and unclear single tree felling pixels classification using the same previous classification methods. Richard (1993) pointed out that knowledge-based method showing good prospects for coping GIS data complexity. Somewhat later, Skidmore et al. (1997) mentioned that neural network back-propagation algorithm might be very useful when combined with the rule-based expert system. Given the result of the second stage of neural network classification, GIS data (i.e. slope and distance from the main logging road) were used to build a set of rules to filter out less possible illegal logging points, which resulted in a more reasonable illegal logging map. For comparison purpose, the illegal logging map was then masked with the boundary of RKL 1. Computation on the final illegal logging map noted that 8.6% of RKL 1 areas were identified as illegal logging points by the first stage of classification, while combined with the result of second stage classification around 15.2% of the areas were detected as illegal logging points. This study has shown that identification of illegal logging in the tropical forest, is not an easy task. In order to provide more accurate detection of illegal logging, this study has to demonstrate the integration of multi-stage classification (i.e. fuzzy c-means, neural network, and rule-based) and multi-source data (e.g. satellite data, ancillary data and GIS criteria). Further study should be carried out in order to explore more possibilities in integrating multi-source data and multi-stage classification techniques, which in turn can result in more reliable detection of illegal logging. More ground truth data should be collected to validate illegal logging map produced by this recent study as well as other study with the same objective but use different classification approaches. Finally, this study has developed a method which can be used to detect subtle information within size of a single pixel, such as single tree felling, and perhaps, this may be useful to enrich the study on Remote Sensing.
6.2. Management Applications Different classification approaches were applied in this study to detect illegal logging in Labanan forest concession. As a comparison, other classification techniques, e.g. 44
APPLICATION OF MULTI-STAGE CLASSIFICATION TO DETECT ILLEGAL LOGGING WITH THE USE OF MULTI-SOURCE DATA
Subpixel classifier, forest canopy density mapper, object oriented classification and vegetation indices were used in the previous studies to detect selective-logging and illegal logging points in the study area (Atmopawiro, 2004; Bhandari, 2003; Cui Yijun, 2003; Fauzi, 2001; Zaitunah, 2004). The accuracy of the classification is with no doubt an important factor for comparison but the cost effectiveness and technical simplicity make the techniques used more useful (Bhandari, 2003). The relative importance of these factors depends on the purpose and financial value of the resources. As we are dealing with tropical forest, a highly valuable resource, the cost of the technique may not always be a big issue but certainly the choice will go for the relatively cheaper method if the accuracy is not significantly different (Congalton, 1991). Moreover, the relatively simple techniques that do not need much expertise can be widely applicable. The outputs of this study can be used to monitor the legal as well as illegal logging on a regular basis. This will be very helpful for the sustainable forest management unit of the forest area. In this study, detection of illegal logging was conducted in the RKL 1 which is more attractive for illegal logging. As this RKL is passed by the main logging road which also functions as provincial road, providing more open access for the trespassers to cut timbers in this area. The classification results revealed that a large number of illegal logging, which expands more farther from the main road, indicates a serious threat of illegal logging for the RKL 1. This recent study comes to the same conclusion as mentioned by some previous studies (Atmopawiro, 2004; Bhandari, 2003) which mentions that if this condition is continued then the RKL 1 will not be ready for the second rotation cycle which will be started in 2011.
6.3. Conclusions Given the results of statistical analysis, it is concluded that canopy cover in selectively logged areas was better than in illegal logging points (Z = -8.231, ρ = less than 0.001, α = 0.05, two-tailed test), giving less canopy gap for the logged-over forest area. Transformation of original Landsat ETM data using Principal Component Analysis approach results in the lower classification accuracy. In this study the subtle differences between classes of interest are not captured by main Principal Components resulting in less accurate result than the use of original satellite data. The classification result shows that 6.9% of pixels, which covers 1,623 ha of the area, were assigned as single tree felling class by maximum likelihood, fuzzy c-means and neural network. The conformity level in classifying single tree felling class using independent test data is 53.3%. There are several factors causing the fuzzy c-means classifier to result in the lower accuracy than maximum likelihood and neural network in classifying single tree felling. One of the factors is strong overlapping of high density forest training pixels and single tree felling pixels sets, causing higher confusion index for the latter class. Another issue is the fact that the majority of single tree felling pixels have equal distribution of membership values between classes. As a consequence many of those pixels have more uncertain probability which to belong to one class, as indicated by 45
APPLICATION OF MULTI-STAGE CLASSIFICATION TO DETECT ILLEGAL LOGGING WITH THE USE OF MULTI-SOURCE DATA
Shannon entropy values of single tree felling class. However, this study still used conventional accuracy assessment of confusion matrix as this method makes possible comparison analysis with other classifiers, which can not be accurately assessed using fuzzy-based assessment technique. Performance of multi-source data classification using neural network showed that possible combination of ancillary data (i.e. elevation and aspect) with the Landsat ETM data improved the classification result in comparison to the use of Landsat ETM data only. Combination of Landsat ETM and texture data (i.e. variance and skewness) was causing the network structure more complex, resulting in more iteration in order to reach a desirable accuracy. Considering the possibility of neural network in classifying multi-source data, the optimal inputs combination for neural network in the second stage of classification were by applying Landsat ETM, ancillary data, and texture data, collectively. In general, neural network performed quite satisfactorily in classifying unclear single tree felling pixels, producing higher accuracy than the first stage of classification. In this study, experts knowledge was reflected in a set of rules which eliminated some less possible pixels of single tree felling using two GIS criteria (i.e. slope and distance from the main road), with the ultimate objective of providing better information of illegal logging in a legal cutting block (RKL 1). Given the result of rule-based classification, this study found that 8.5% of the total RKL 1 area was illegally-logged, calculated using the number of first order single tree felling pixels. This number was increased up to 15.2%, when illegal logging was computed using the total number of single tree felling pixels in the RKL 1 area.
6.4. Recommendations a. Possibilities for collecting other ground truth data taking into account the presence of mixed pixels and put as an input for fuzzy classification techniques should be explored. Further study may also be carried out using those ground truth data in order to validate the result of illegal logging detection that was demonstrated in this study. b. When multi temporal satellite data and multi year ground truth data are available, it may be useful to do further study about change detection analysis to detect forest degradation, deforestation, and illegal logging in Labanan forest management unit.
46
APPLICATION OF MULTI-STAGE CLASSIFICATION TO DETECT ILLEGAL LOGGING WITH THE USE OF MULTI-SOURCE DATA
List of References
Angelsen, A. and D. Kaimowitz (Editors), 2001. Agricultural technologies and tropical deforestation. CABI, Wallingford, 422 pp. Asner, G.P., M. Keller, R. Pereira and J.C. Zweede, 2002. Remote Sensing of Selective Logging in Amazonia: Assessing Limitations Based on Detailed Field Observations, Landsat ETM+ and Textural Analysis. Remote Sensing of Environment, 80(3): 483-496. Atkinson, P.M., M.E.J. Cutler and H. Lewis, 1997. Mapping sub-pixel proportional land cover with AVHRR imagery. International Journal of Remote Sensing, 18(4): 917935. Atkinson, P.M. and A.R.L. Tatnall, 1997. Introduction Neural networks in remote sensing. International Journal of Remote Sensing, 18(4): 699-709. Atmopawiro, V.P., 2004. Detection of Single Tree Felling in the Tropical Forest Using Optical Satellite Data and Image Classification Techniques (a Case Study in the Labanan Concession, East Kalimantan, Indonesia). Thesis Thesis, ITC The Netherlands, Enschede, 91 pp. Bezdek, J.C., R. Ehrlich and W. Full, 1984. FCM: The Fuzzy c-Means Clustering Algorithm. Computers & Geosciences, 10(2-3): 191-203. Bhandari, S.P., 2003. Remote Sensing for Forest Certification : Detecting and Characterizing Selective logging in Tropical Forest : a Case Study in Labanan Concession, East Kalimantan, Indonesia. Unpublished Thesis, ITC, Enschede, 76 pp. Boltz, F., T.P. Holmes and D.R. Carter, 2003. Economic and environmental impacts of conventional and reduced-impact logging in Tropical South America: a comparative review. Forest Policy and Economics, 5(1): 69-81. Bruzzone, L., C. Conese, F. Maselli and F. Roll, 1997. Multisource Classification of Complex Rural Areas by Statistical and Neural Network Approaches. Photogrammetric Engineering & Remote Sensing, 63(5): 523-533. Cannon, R.L., J.V. Dave, J.C. Bezdek and M.M. Trivedi, 1986. Segmentation of a Thematic Mapper Image Using the Fuzzy c-Means Clustering Algorithm. IEEE Trannsactions on Geoscience and Remote Sensing, GE-24 May 1986(3): 400-408. Casson, A. and K. Obidzinski, 2002. From New Order to Regional Autonomy: Shifting Dynamics of "Illegal" Logging in Kalimantan, Indonesia. World Development, 30(12): 2133-2151. Congalton, R.G., 1991. A Review of Assessing the Accuracy of Classifications of Remotely Sensed Data. Remote Sensing of Environment, 37: 35-46. Congalton, R.G. and K. Green, 1999. Assessing the Accuracy of Remotely Sensed Data: Principles and Practises. Lewis Publishers.
47
APPLICATION OF MULTI-STAGE CLASSIFICATION TO DETECT ILLEGAL LOGGING WITH THE USE OF MULTI-SOURCE DATA
Cui Yijun, 2003. Remote sensing and GIS for supporting sustainable forest management certification in the tropics : a case study in Labanan concession, East Kalimantan, Indonesia. M.Sc. Unpublished Thesis, ITC The Netherlands, Enschede, 75 pp. Currey, D. et al., 2003. Above The Law : Corruption, Collusion, Nepotism and the Fate of Indonesia’s Forests, http://www.illegal-logging.info/papers/abovethelaw.pdf, Date Accessed: 23 May 2004. Dahal, P.P., 2002. Determination of forest status using selected criteria and indicators of sustainable forest management : a case study of Labanan concession, east Kalimantan, Indonesia. Unpublished M.Sc. Thesis, ITC The Netherlands, Enschede, 76 pp. Danaher, S., G. Herries, T. Selige and M. Mac Suirtan, 1997. A Comparison of the Characterisation of Agricultural Land Using Singular Value Decomposition and Neural Networks. In: I. Kanellopoulos, G.G. Wilkinson, F. Roli and J. Austin (Editors), Neuro-Computation in Remote Sensing Data Analysis: Proceedings of Concerted Action COMPARES. Springer. Danudoro, P., 1993. The use of knowledge - based approaches in the integration of remote sensing and Geographic Information System for land use mapping : a case study of the buffer zone of Cibodas biosphere reserve, West Java, Indonesia. Unpublished M.Sc Thesis Thesis, ITC The Netherlands, Enschede. Elias and D.P. Dykstra, 1995. A case study on Forest Harvesting Damages, Structure and Composition Dynamic Changes in the Residual Stand for Dipterocarp Forest in East Kalimantan, Indonesia, Forest Operations for Sustainable forestry in the tropics, Proceedings of a symposium organised by IUFRO subject group S3, 1327. FAO, 2004. Illegal Activities in Forestry, http://www.fao.org/forestry/site/18447/en, Date Accessed: 24 June 2004. Fauzi, A., 2001. Remote sensing for detecting tropical logged over forest : a case study in Labanan concession, East Kalimantan, Indonesia, ITC The Netherlands, Enschede, 91 pp. Foody, G.M., 1996a. Approaches for the production and evaluation of fuzzy land cover classifications from remotely-sensed data. International Journal of Remote Sensing, 17(7): 1317-1340. Foody, G.M., 1996b. Relating the land-cover composition of mixed pixels to artificial neural network classification output. Photogrammetric Engineering & Remote Sensing, 62(5): 491-499. Four
Corners, 2002. Timber Mafia: What is Illegal Logging?, http://www.abc.net.au/4corners/content/2002/timber_mafia/resources/resources _illegal_logging.htm, Date Accessed: 12 January 2004.
Gahegan, M., G. German and G. West, 1999. Improving neural network performance on the classification of complex geographic datasets. Journal of Geographical Systems, 1(1): 3-22. Gopal, S. and C.E. Woodcock, 1994. Theory and Methods for Accuracy Assessment of Thematic Maps Using Fuzzy Sets. Photogrammetric Engineering & Remote Sensing, 60: 181-188.
48
APPLICATION OF MULTI-STAGE CLASSIFICATION TO DETECT ILLEGAL LOGGING WITH THE USE OF MULTI-SOURCE DATA
Gopal, S., C.E. Woodcock and A.H. Strahler, 1999. Fuzzy neural network classification of global land cover from a 1[deg]AVHRR data set. Remote Sensing of Environment, 67(2): 230-243. Hegde, S., 2003. Modelling Land Cover Change: A Fuzzy Approach. Unpublished Thesis, ITC The Netherlands. Hepner, G.F., T. Logan, N. Ritter and N. Bryant, 1989. Artificial Neural Network Classification Using a Minimal Training Set : Comparison to Conventional Supervised Classification. Photogrammetric Engineering & Remote Sensing, 56(4): 469-473. Huurneman, G. and L. Broekema, 1996. Classification of Multi-Sensor Data Using a Combination of Image Analysis Techniques, presented at The Asian Association on Remote Sensing (AARS) - 17th Asian Conference on Remote Sensing, Colombo Sri Lanka, 4 - 8 November 1996. ITTO,
2004. ITTO at work : Sustainable Forest http://www.itto.or.jp/live/PageDisplayHandler?pageId=13, Date June 2004.
Management, Accessed: 21
Jensen, J.R., 1996. Introductory Digital Image Processing : A remote Sensing Perspective. Prentice Hall. Kanellopoulos, I. and G.G. Wilkinson, 1997. Strategies and best practice for neural network image classification. International Journal of Remote Sensing, 18(4): 711-725. Karanja, F.N., 2002. Use of Knowledge Based Systems for the Detection and Monitoring of Unplanned Developments. PhD Dissertation Thesis, Universität Hannover, Hannover. Kent, M., W.J. Gill, R.E. Weaver and R.P. Armitage, 1997. Landscape and Plant Community Boundaries in Biogeography. Progress in Physical Geography, 21: 315-353. Klir, G.J. and T.A. Folger, 1988. Fuzzy Sets, Uncertainty and Information. Prentice-Hall Internatinal, London. Lillesand, T.M. and R.W. Kiefer, 1994. Remote Sensing and Image Interpretation. John Wiley & Sons, Inc. Liu, X., 2001. Mapping and Modelling the Habitat of Giant Pandas in Foping Nature Reserve, China. PhD Thesis Report Thesis, ITC The Netherlands, Enschede. Lucieer, A., 2004. Uncertainties in Segmentation and their Visualisation, International Institute for Geo-Information Science and Earth Observation, Enschede. Mas, J.F., H. Puig, J.L. Palacio and A. Sosa-Lopez, 2004. Modelling deforestation using GIS and artificial neural networks. Environmental Modelling and Software, 19(5): 461-471. Maselli, F., C. Conese and L. Petkov, 1994. Use of Probability Entropy for the Estimation and Graphical Representation of the Accuracy of Maximum Likelihood Classifications. ISPRS Journal of Photogrammetry and Remote Sensing, 49(2): 1320. 49
APPLICATION OF MULTI-STAGE CLASSIFICATION TO DETECT ILLEGAL LOGGING WITH THE USE OF MULTI-SOURCE DATA
Mather, P.M., 2004. Computer Processing of Remotely-Sensed Data : An Introduction. John Wiley & Sons, Ltd, Chichester, West Sussex. Moody, A., S. Gopal and A.H. Strahler, 1996. Artificial neural network response to mixed pixel in coarse-resolution satellite data. Remote Sensing of Environment, 58(3): 329-343. Palubinskas, G., R.M. Lucas, G.M. Foody and P.J. Curran, 1995. An Evaluation of Fuzzy and Texture-Based Classification Approaches for Mapping Regenerating Tropical Forest Classes from Landsat-TM Data. International Journal of Remote Sensing, 16(4): 747-759. Paola, J. and R.A. Schowengerdt, 1995. A Detailed Comparison of Backpropagation Neural Networks and Maximum-Likelihood for Urban Land Use Classification. IEEE Transactions on Geoscience and Remote Sensing, 33: 981-996. Richards, J.A., 1993. Remote Sensing Digital Image Analysis - An Introduction. SpringerVerlag, New York. Rosyadi, S., R. Birner and M. Zeller, 2003. Creating political capital to promote devolution in the forestry sector--a case study of the forest communities in Banyumas district, Central Java, Indonesia. Forest Policy and Economics, In Press, Corrected Proof. Rumelhart, D.E., G.E. Hinton and R.J. Williams, 1986. Learning internal Representations by Error Propagation. In: D.E. Rumelhart, J.L. McClelland and P.R. Group (Editors), Parallel Distributed Processing: Explorations in the Microstructure of Cognition. MIT Press, Cambridge, pp. 318-362. Singh, A. and A. Harrison, 1985. Standardized Principal Components. International Journal of Remote Sensing(6): 883-896. Skidmore, A.K., B.J. Turner, W. Brinkhof and E.Knowles, 1997. Performance of a Neural Network : Mapping Forests Using GIS and Remotely Sensed Data. Photogrammetric Engineering & Remote Sensing, 63(5): 501-514. Smith,
W., 2002. The Global Problem of Illegal http://www.itto.or.jp/live/Live_Server/157/tfu.2002.01(03-05).e.pdf, Accessed: 24 May 2004.
Logging, Date
SPSS Marketing Department, 1999. SPSS Base 9.0 Applications Guide, Chicago. Stibig, H.J. and J.P. Malingreau, 2003. Forest Cover of Insular Southeast Asia Mapped from Recent Satellite Images of Coarse Spatial Resolution, http://wwwgvm.jrc.it/glc2000/Products/seasia/stibig&malingreau2003_low.pdf, Date Accessed: 12 January 2005. Taneja, I.J., 2001. Generalized Information Measures and Their Applications, http://www.mtm.ufsc.br/~taneja/book/node1.html, Date Accessed: 14 February 2005. Tso, B. and P.M. Mather, 2001. Classification Methods for Remotely Sensed Data. Taylor and Francis, London. Vatsavai, R.R. et al., 2001. Multi-Spectral Image Classification using Spectral and Spatial Knowledge, In proceedings of the 2001 International Conference on Imaging Science, Systems, and Technology, CISST 2001, CSREA Press. 50
APPLICATION OF MULTI-STAGE CLASSIFICATION TO DETECT ILLEGAL LOGGING WITH THE USE OF MULTI-SOURCE DATA
Wilkinson, G.G., F. Fierens and I. Kanellpoulos, 1995. Integration of neural and statistical approaches in spatial data classification. Geographical Systems, 2: 1-20. Zaitunah, A., 2004. Analysis of Physical Factors Affecting Single Tree Felling of Illegal Logging Using Remote Sensing and GIS (A Case Study in Labanan Concession, East Kalimantan, Indonesia). Thesis Thesis, ITC The Netherlands, Enschede, 108 pp. Zhang, J. and G.M. Foody, 1998. A fuzzy classification of sub-urban land cover from remotely sensed imagery. International Journal of Remote Sensing, 19(14): 27212738. Zhang, J. and G.M. Foody, 2001. Fully-fuzzy supervised classification of sub-urban land cover from remotely sensed imagery: Statistical and artificial neural network approaches. International Journal of Remote Sensing, 22(4): 615-628. Zhang, L. et al., 2004. Fuzzy Classification of Ecological Habitats from FIA Data. Forest Science, 50(1): 117-127.
51
APPLICATION OF MULTI-STAGE CLASSIFICATION TO DETECT ILLEGAL LOGGING WITH THE USE OF MULTI-SOURCE DATA
Appendices
Appendix 1. ROI Separability Report of Training Sample in the First Stage Classification
Land Cover Type
Jeffries Matusita
Transformed Divergence
Single Tree Felling and High Density Forest Sparse Forest and High Density Forest Single Tree Felling and Sparse Forest Single Tree Felling and Hill Shadow Hill Shadow and River High Density Forest and Hill Shadow Single Tree Felling and River Sparse Forest and Hill Shadow Sparse Forest and Clear Cut Forest High Density Forest and River Road and Clear Cut Forest Sparse Forest and River Sparse Forest and Road Single Tree Felling and Road Single Tree Felling and Clear Cut Forest Road and High Density Forest Road and Hill Shadow Road and River Clear Cut Forest and High Density Forest Clear Cut Forest and Hill Shadow Clear Cut Forest and River
0.92 1.04 1.05 1.14 1.20 1.24 1.30 1.30 1.37 1.41 1.41 1.41 1.41 1.41 1.41 1.41 1.41 1.41 1.41 1.41 1.41
1.86 1.94 1.70 1.82 1.95 2.00 1.90 1.89 1.96 2.00 2.00 2.00 2.00 2.00 2.00 2.00 2.00 2.00 2.00 2.00 2.00
53
APPLICATION OF MULTI-STAGE CLASSIFICATION TO DETECT ILLEGAL LOGGING WITH THE USE OF MULTI-SOURCE DATA
Appendix 2. ROI Separability Report of Training Sample in the Second Stage Classification Landsat ETM data Land Cover Type
Single Tree Felling and River Sparse Forest and High Density Forest Single Tree Felling and High Density Forest Single Tree Felling and Sparse Forest Road and River Sparse Forest and River High Density Forest and River Single Tree Felling and Road Single Tree Felling and Hill Shadow High Density Forest and Hill Shadow Hill Shadow and River Sparse Forest and Hill Shadow Sparse Forest and Road Road and High Density Forest Road and Hill Shadow
Jeffries Matusita
Transformed Divergence
0.81 0.85 0.93 0.94 0.94 1.20 1.25 1.27 1.34 1.35 1.38 1.39 1.39 1.40 1.41
1.43 1.47 1.82 1.82 1.58 2.00 2.00 1.94 2.00 2.00 2.00 2.00 2.00 2.00 2.00
Jeffries Matusita
Transformed Divergence
1.06 1.18 1.29 1.30 1.35 1.39 1.41 1.41 1.41 1.41 1.41 1.41 1.41 1.41 1.41
1.88 1.97 1.96 1.99 2.00 2.00 2.00 2.00 2.00 2.00 2.00 2.00 2.00 2.00 2.00
Landsat ETM + Elevation Land Cover Type
Single Tree Felling and High Density Forest Sparse Forest and High Density Forest Single Tree Felling and Road Single Tree Felling and Sparse Forest Single Tree Felling and Hill Shadow High Density Forest and Hill Shadow Road and High Density Forest High Density Forest and River Sparse Forest and Road Road and Hill Shadow Sparse Forest and River Single Tree Felling and River Sparse Forest and Hill Shadow Road and River Hill Shadow and River
54
APPLICATION OF MULTI-STAGE CLASSIFICATION TO DETECT ILLEGAL LOGGING WITH THE USE OF MULTI-SOURCE DATA
Landsat ETM + Aspect Land Cover Type
Sparse Forest and High Density Forest Single Tree Felling and High Density Forest Single Tree Felling and Sparse Forest Single Tree Felling and River Road and River Sparse Forest and River Single Tree Felling and Road High Density Forest and River Single Tree Felling and Hill Shadow High Density Forest and Hill Shadow Sparse Forest and Hill Shadow Hill Shadow and River Sparse Forest and Road Road and High Density Forest Road and Hill Shadow
Jeffries Matusita
Transformed Divergence
0.89 0.96 0.97 1.02 1.13 1.27 1.28 1.31 1.34 1.35 1.39 1.39 1.40 1.41 1.41
1.56 1.85 1.80 1.83 1.91 1.99 1.95 1.99 2.00 2.00 2.00 2.00 2.00 2.00 2.00
Jeffries Matusita
Transformed Divergence
1.09 1.21 1.30 1.31 1.35 1.39 1.41 1.41 1.41 1.41 1.41 1.41 1.41 1.41 1.41
1.91 1.98 1.96 1.99 2.00 2.00 2.00 2.00 2.00 2.00 2.00 2.00 2.00 2.00 2.00
Landsat ETM + Elevation + Aspect Land Cover Type
Single Tree Felling and High Density Forest Sparse Forest and High Density Forest Single Tree Felling and Road Single Tree Felling and Sparse Forest Single Tree Felling and Hill Shadow High Density Forest and Hill Shadow Road and High Density Forest Sparse Forest and Road Road and Hill Shadow High Density Forest and River Sparse Forest and Hill Shadow Sparse Forest and River Single Tree Felling and River Road and River Hill Shadow and River
55
APPLICATION OF MULTI-STAGE CLASSIFICATION TO DETECT ILLEGAL LOGGING WITH THE USE OF MULTI-SOURCE DATA
Appendix 3. Variance of Sample Sets (Selection of The Best ETM Channel Used For Texture Data)
River High Density LOF Clear Cut Forest Road Sparse Forest Single Tree Felling Hill Shadow Mean Variance Forest Classes Mean Variance
56
Band 1 6.4 2.5 2.9 1294.8 2.4 3 2.4 187.77
Band 2 12 1.33 7.2 1017 1.9 3 1.6 149.15
Band 3 16.7 1.8 4.5 1117.9 2.7 5 2.2 164.40
Band 4 29.6 2.8 57.9 1591.9 23.5 24 16.7 249.49
Band 5 45 9 64.3 2218.9 19.7 30.3 16.1 343.33
Band 6 0.97 0.5 1 4103.4 0.5 0.8 0.5 586.81
Band 7 14.6 3.1 13.6 790 5.1 8.8 3.8 119.86
2.7
3.3575
3.5
27.05
30.825
0.7
7.65
APPLICATION OF MULTI-STAGE CLASSIFICATION TO DETECT ILLEGAL LOGGING WITH THE USE OF MULTI-SOURCE DATA
Appendix 4. Ancillary Data and Texture Data Images for Second Stage of Neural Network Classification
Variance Map of Band 5 Landsat ETM
Aspect Map
Elevation Map (in meters)
Skewness of Band 5 Landsat 7 ETM
57
APPLICATION OF MULTI-STAGE CLASSIFICATION TO DETECT ILLEGAL LOGGING WITH THE USE OF MULTI-SOURCE DATA
GIS Data Images for Rule-Based Classification
Slope Map (in degree)
58
Road Distance map (the measurement unit is number of pixels, calculated up to 1000 pixels distance)
APPLICATION OF MULTI-STAGE CLASSIFICATION TO DETECT ILLEGAL LOGGING WITH THE USE OF MULTI-SOURCE DATA
Appendix 5. Error Matrices of First Stage Classification Using Landsat ETM data 1. Maximum Likelihood with no threshold value
Single Tree Felling Sparse Forest Road Clear Cut Forest High Density Forest Hill Shadow River Total Producer Accuracy
Single Tree Felling 22 5 0 0 2 1 0 30 73.33%
Overall Accuracy Khat Statistic
78.13% 0.75
Class
Sparse Forest
Road
3 18 0 0 3 1 0 25 72.00%
0 0 26 0 0 0 0 26 100.00%
Clear Cut Forest 0 1 1 24 0 0 0 26 92.31%
High Density Forest 7 10 0 0 16 2 0 35 45.71%
Hill Shadow
River
Total
0 0 0 0 0 24 1 25 96.00%
3 0 0 0 0 2 20 25 80.00%
35 34 27 24 21 30 21 192
User Accuracy 62.86% 52.94% 96.30% 100.00% 76.19% 80.00% 95.24%
2. Maximum Likelihood using Single Threshold Value of 0.1
Unclassified Single Tree Felling Sparse Forest Road Clear Cut Forest High Density Forest Hill Shadow River Total Producer Accuracy
Single Tree Felling 0 22 5 0 0 2 1 0 30 73.33%
Overall Accuracy Khat Statistic
77.78% 0.74
Class
Sparse Forest
Road
0 3 18 0 0 3 1 0 25 72.00%
3 0 0 23 0 0 0 0 23 100.00%
Clear Cut Forest 0 0 1 1 24 0 0 0 26 92.31%
High Density Forest 0 7 10 0 0 16 2 0 35 45.71%
Hill Shadow
River
Total
0 0 0 0 0 0 24 1 25 96.00%
0 3 0 0 0 0 2 20 25 80.00%
3 35 34 24 24 21 30 21 192
User Accuracy 0.00% 62.86% 52.94% 95.83% 100.00% 76.19% 80.00% 95.24%
59
APPLICATION OF MULTI-STAGE CLASSIFICATION TO DETECT ILLEGAL LOGGING WITH THE USE OF MULTI-SOURCE DATA
3. Fuzzy c-means with Euclidian Distance
Class
Single Tree Felling
Sparse Forest
Road
Clear Cut Forest
High Density Forest
Hill Shadow
River
Total
Single Tree Felling Sparse Forest Road Clear Cut Forest High Density Forest Hill Shadow River Total Producer Accuracy
16 4 0 0 9 0 1 30 53.33%
2 17 0 0 6 0 0 25 68.00%
1 1 17 7 0 0 0 26 65.38%
0 1 0 25 0 0 0 26 96.15%
2 6 0 0 26 1 0 35 74.29%
0 0 0 0 0 25 0 25 100.00%
7 0 0 0 1 3 14 25 56.00%
28 29 17 32 42 29 15 192
Overall Accuracy Khat Statistic
72.92% 0.68
User Accuracy 57.14% 58.62% 100.00% 78.13% 61.90% 86.21% 93.33%
4. Fuzzy c-means with Mahalanobis Distance
Single Tree Felling Sparse Forest Road Clear Cut Forest High Density Forest Hill Shadow River Total Producer Accuracy
Single Tree Felling 23 3 1 0 1 0 2 30 76.67%
Overall Accuracy Khat Statistic
69.27% 0.64
Class
60
Sparse Forest
Road
3 16 3 0 2 1 0 25 64.00%
0 0 26 0 0 0 0 26 100 %
Clear Cut Forest 0 0 4 22 0 0 0 26 84.62%
High Density Forest 18 9 0 0 6 1 1 35 17.14%
Hill Shadow
River
Total
0 0 0 0 0 22 3 25 88.00 %
3 0 2 0 0 2 18 25 72.00 %
47 28 36 22 9 26 24 192
User Accuracy 48.94% 57.14% 72.22% 100.00% 66.67% 84.62% 75.00%
APPLICATION OF MULTI-STAGE CLASSIFICATION TO DETECT ILLEGAL LOGGING WITH THE USE OF MULTI-SOURCE DATA
5. Neural Network : 7500 Iteration & 21 Hidden Nodes
Single Tree Felling Sparse Forest Road Clear Cut Forest High Density Forest Hill Shadow River Total Producer Accuracy
Single Tree Felling 23 6 0 0 1 0 0 30 76.67%
Overall Accuracy Khat Statistic
75.00% 0.71
Class
Sparse Forest
Road
2 21 0 0 2 0 0 25 84.00%
4 2 18 0 0 0 2 26 69.23%
Clear Cut Forest 0 0 1 25 0 0 0 26 96.15%
High Density Forest 7 12 0 0 15 1 0 35 42.86%
Hill Shadow
River
Total
0 0 0 0 0 24 1 25 96.00%
4 0 0 0 1 2 18 25 72.00%
40 41 19 25 19 27 21 192
Hill Shadow
River
Total
0 0 0 0 0 25 0 25 100.00%
7 0 0 0 0 2 16 25 64.00%
46 35 21 25 21 28 16 192
User Accuracy 57.50% 51.22% 94.74% 100.00% 78.95% 88.89% 85.71%
6. Neural Network : 5000 Iteration & 7 Hidden Nodes
Single Tree Felling Sparse Forest Road Clear Cut Forest High Density Forest Hill Shadow River Total Producer Accuracy
Single Tree Felling 23 5 0 0 2 0 0 30 76.67%
Overall Accuracy Khat Statistic
74.48% 0.70
Class
Sparse Forest
Road
2 19 0 0 4 0 0 25 76.00%
6 0 20 0 0 0 0 26 76.92%
Clear Cut Forest 0 0 1 25 0 0 0 26 96.15%
High Density Forest 8 11 0 0 15 1 0 35 42.86%
User Accuracy 50.00% 54.29% 95.24% 100.00% 71.43% 89.29% 100.00%
61
APPLICATION OF MULTI-STAGE CLASSIFICATION TO DETECT ILLEGAL LOGGING WITH THE USE OF MULTI-SOURCE DATA
Appendix 6. Selected Error Matrices of Second Stage Neural Network Classification No
1 2 3 4 5 6 7 8 9 10 11 12 13 14 15
Network Parameter
NN2_2.5k7b7n NN2_2.5k7b21n NN2_5k7b7n NN2_5k7b21n NN2_5kDEM9n NN2_5kDEM18n NN2_10kDEM9N NN2_10kDEM18n NN2_5kTEX9n NN2_5kTEX18n NN2_10kTEX21n NN2_5kALL11n NN2_5kALL22n NN2_10kALL11n NN2_10kALL22n
Definitions : NN2 2.5k, 5k, 10k 7n, 21n NN2……7b… NN2……DEM NN2……TEX NN2……All
Single Tree Felling Accuracy
Overall Accuracy
Training Data
Test Data
Training Data
Test Data
42.6% 55.3% 40.4% 48.9% 53.2% 87.2% 80.9% 82.9% 25.5% 66% 68.1% 87.2% 78.7% 85.1% 91.5%
46.7% 53.3% 46.7% 53.3% 66.7% 73.3% 66.7% 40% 33.3% 66.7% 53.3% 80% 53.3% 70% 60%
76.7% 77.5% 76.2% 80.3% 89% 93.2% 92.9% 95.3% 80.6% 83.8% 86.3% 92.3% 93.4% 93.4% 94.5%
64.8% 59% 62% 66.7% 84.8% 84.8% 82.9% 80% 64.76% 61.9% 63.8% 88.6% 87.6 81.9% 85.7%
: : : : :
Neural Network of Second Classification Stage Represents number of iteration (e.g. 2.5k means 2,500 iterations, etc) Represents number of hidden nodes (e.g. 7n means 7 hidden nodes, etc) Input of neural network used seven bands of Landsat ETM only Input of neural network used seven bands of Landsat ETM and DEM (i.e. Elevation, Aspect) : Input of neural network used seven bands of Landsat ETM and texture (i.e. Variance, Skewness) : Input of neural network used all possible input (i.e. Landsat ETM, DEM, and Texture data)
The single tree felling and overall accuracy of test data in grey shaded rows were presented in Figure 4.2. These rows showed relatively higher classification accuracy for each input combination.
62
APPLICATION OF MULTI-STAGE CLASSIFICATION TO DETECT ILLEGAL LOGGING WITH THE USE OF MULTI-SOURCE DATA
Appendix 7. Membership Values of Fuzzy c-means Classification for Each Land Cover Class
ID 1 2 3 4 5 6 7 8 9 10 11 12 13 14 15 16 17 18 19 20 21 22 23 24 25 26 27 28 29 30
Single Tree Felling 0.40 0.48 0.33 0.33 0.54 0.34 0.51 0.22 0.46 0.46 0.46 0.46 0.46 0.17 0.14 0.34 0.28 0.13 0.30 0.05 0.68 0.57 0.87 0.30 0.19 0.43 0.44 0.81 0.23 0.20
Sparse Forest 0.31 0.06 0.04 0.04 0.05 0.05 0.05 0.05 0.05 0.05 0.05 0.05 0.05 0.43 0.07 0.19 0.30 0.63 0.06 0.87 0.05 0.05 0.03 0.23 0.20 0.22 0.07 0.06 0.05 0.35
Road 0.00 0.00 0.00 0.00 0.00 0.00 0.00 0.00 0.00 0.00 0.00 0.00 0.00 0.00 0.00 0.00 0.00 0.00 0.00 0.00 0.00 0.00 0.00 0.02 0.07 0.01 0.00 0.00 0.00 0.00
Clear Cut Forest 0.03 0.01 0.00 0.00 0.00 0.00 0.01 0.01 0.01 0.01 0.01 0.01 0.01 0.02 0.01 0.01 0.01 0.02 0.01 0.01 0.01 0.01 0.00 0.07 0.19 0.03 0.01 0.00 0.01 0.02
High Density Forest 0.18 0.29 0.57 0.57 0.34 0.56 0.33 0.26 0.32 0.32 0.32 0.32 0.32 0.30 0.69 0.41 0.36 0.18 0.40 0.05 0.18 0.23 0.07 0.18 0.15 0.18 0.19 0.10 0.17 0.36
Hill Shadow 0.04 0.07 0.03 0.03 0.03 0.02 0.05 0.22 0.07 0.07 0.07 0.07 0.07 0.03 0.05 0.02 0.02 0.02 0.10 0.01 0.04 0.06 0.01 0.09 0.09 0.06 0.12 0.01 0.18 0.03
River 0.05 0.09 0.03 0.03 0.04 0.02 0.06 0.23 0.08 0.08 0.08 0.08 0.08 0.03 0.04 0.02 0.02 0.02 0.11 0.01 0.05 0.08 0.01 0.11 0.11 0.08 0.17 0.01 0.36 0.04
Land Cover Single Tree Fell Single Tree Fell High Density Forest High Density Forest Single Tree Fell High Density Forest Single Tree Fell High Density Forest Single Tree Fell Single Tree Fell Single Tree Fell Single Tree Fell Single Tree Fell Sparse Forest High Density Forest High Density Forest High Density Forest Sparse Forest High Density Forest Sparse Forest Single Tree Fell Single Tree Fell Single Tree Fell Single Tree Fell Sparse Forest Single Tree Fell Single Tree Fell Single Tree Fell River High Density Forest
Entropy 2.0631 1.9311 1.5062 1.5062 1.5958 1.4676 1.7509 2.2669 1.9006 1.9006 1.9006 1.9006 1.9006 1.9449 1.4946 1.8391 1.8939 1.6231 2.075 0.8441 1.4991 1.7775 0.7656 2.4872 2.7225 2.1669 2.1544 1.0169 2.1971 1.9769
63
APPLICATION OF MULTI-STAGE CLASSIFICATION TO DETECT ILLEGAL LOGGING WITH THE USE OF MULTI-SOURCE DATA
64