a given stage, the examinee is routed to the module at the most appropriate difficulty level in the ..... curves hit the targets and spread over the difficulty range.
ACT Research Report Series 2012 (6)
Multistage Adaptive Testing for a Large-Scale Classification Test: Design, Heuristic Assembly, and Comparison with Other Testing Modes Yi Zheng Yuki Nozawa Xiaohong Gao Hua-Hua Chang September 2012
*050206120*
Rev 1
For additional copies, write: ACT Research Report Series P.O. Box 168 Iowa City, IA 52243-0168
© 2012 by ACT, Inc. All rights reserved.
Multistage Adaptive Testing for a Large-Scale Classification Test: Design, Heuristic Assembly, and Comparison with Other Testing Modes
Yi Zheng Yuki Nozawa Xiaohong Gao Hua-Hua Chang
Abstract Multistage adaptive tests (MSTs) have gained increasing popularity in recent years. MST is a balanced compromise between linear test forms (i.e., paper-and-pencil testing and computerbased testing) and traditional item-level computer-adaptive testing (CAT). It combines the advantages of both. On one hand, MST is adaptive (and therefore more efficient than linear tests). On the other hand, unlike CAT, it allows test developers to review test forms before administration, and it allows examinees to review and revise answers. Despite the advantages of MST, there is little literature on the details of heuristic automated assembly of MST and on the investigation of MST in the context of classification tests. In this study, we designed a MST for a large-scale classification test and performed the automated test assembly using a heuristic method. We then compared the performance of the MST with that of a linear test form and a CAT using computer simulation. The automated test assembly was successful.
In comparing MST and CAT, we did observe a trade-off in
measurement accuracy and item bank usage.
For classification purposes, however, MST
provided classification accuracy as good as that from CAT, with more efficient item bank usage.
ii
Acknowledgements The authors thank Deborah Harris, Rongchun Zhu, and Chunyan Liu, for their insightful comments on this study. The first author also thanks Steven Nydick for his generous help as a co-intern.
iii
Multistage Adaptive Testing for a Large-Scale Classification Test: Design, Heuristic Assembly, and Comparison with Other Testing Modes Multistage adaptive tests (MSTs) have gained increasing popularity in recent years as the Certified Public Accountants (CPA) Examination successfully switched from the paper-andpencil (P&P) mode to the MST mode in 2004 (Breithaupt & Hare, 2007; Luecht, Brumfield, & Breithaupt, 2006) and the Graduate Record Examination (GRE) replaced the P&P linear testing mode and the computerized-adaptive testing (CAT) mode with MST in August, 20111. CAT has been applied for decades, while MST was recently promoted as an alternative — a “balanced compromise” (Hendrickson, 2007) between the linear testing modes (i.e., P&P and computerbased testing, CBT) and CAT. As the MST framework develops, it has taken several forms and names (Hendrickson, 2007), including two-stage testing (Adema, 1990; Kim & Plake, 1993), computerized mastery testing (CMT; Lewis & Sheehan, 1990), computer-adaptive sequential testing (CAST; Luecht, 2000; Luecht & Nungester, 1998), bundled multistage adaptive testing (BMAT; Luecht, 2003), and multiple form structures (MFS; Armstrong, Jones, Koppel, & Pashley, 2004). Recently, the names multistage testing, multistage adaptive testing, adaptive multistage testing, or computer adaptive multistage testing have been widely used in literature (e.g., Armstrong & Roussos, 2005; Belov & Armstrong, 2008; Breithaupt & Hare, 2007; Chen, 2011; Hambleton & Xing, 2006; Jodoin, Zenisky, & Hambleton, 2006; Keng, 2008; Luecht, Brumfield, & Breithaupt, 2006; Luecht & Burgin, 2003; Patsula, 1999). This study will use the name multistage adaptive testing (MST). In addition to the name, researchers have used different sets of terminology to describe the framework of multistage adaptive testing. This study will use the framework and terminology adopted in Luecht and Nungester’s (1998) paper. 1
See http://www.ets.org/gre/revised_general/about/experience for more information.
2 In the MST framework, a test is divided into several stages. Having multiple stages gives the test a few chances to tailor itself for each examinee by selecting an item set that matches the examinee’s ability best for every stage after Stage 1 based on his/her responses to previous stages. This is similar to item selection in CAT. However, while CAT selects each item on-thefly, MST preassembles all tests before administration. The basic structure of the assembled MST tests is termed “panel.” A panel is comprised of several stages, and each stage contains several testlets (termed “modules”) representing different difficulty levels.
Usually in a MST
administration, multiple parallel panels are assembled. During administration, each examinee is randomly assigned a panel and starts from Stage 1 of that panel. After completing the module in a given stage, the examinee is routed to the module at the most appropriate difficulty level in the next stage. A complete route an examinee takes through the test is termed “pathway”, which contains one module from each stage. A panel can have several different pathways. Being a “balanced compromise” (Hendrickson, 2007), MST combines the advantages of linear tests and CAT. On one hand, compared to P&P, MST enjoys many advantages of being a computerized test, such as savings on printing and delivery, savings on scoring labor, being able to give real-time score reports and feedback, and supporting new multi-media and interactive item types, etc. Furthermore, like CAT, MST adapts to each examinee’s ability, which is not the feature of a standard linear CBT. To achieve the same measurement accuracy, MST needs fewer items and shorter testing time than CBT. The adaptive nature of MST is desirable for reducing item exposure and examinees’ testing time. On the other hand, MST also has several advantages over CAT. First, because the item selection algorithm only takes place between stages but not within each stage, MST allows examinees to navigate back and forth through the items within their current stage to review the
3 questions and potentially change their answers. Unlike CAT, where reviewing and changing answers is usually not allowed in order to prevent examinees from manipulating the item selection algorithm, MST is more natural and friendly to examinees, so that they may feel less stress and anxiety during the test. Second, MST also allows test developers to monitor and control the quality of the assembled tests (i.e., panels in MST). Because the panels are assembled before administration, test development experts can review them regarding various aspects, such as content balance, answer key balance, word counts, and so on, in addition to the statistical properties. As pointed out by Luecht and Nungester (1998), although a CAT item bank can be reviewed for quality, the individual test forms assembled from the item bank cannot. Maintaining a trust in the quality of the mass-produced forms by both test developers and test users needs to be recognized as an essential part of implementing a computerized testing program. By assembling tests before administration, MST could offer more assurance of test quality than CAT. The downside of MST, compared with CAT, is that MST is less efficient and less flexible for early termination than CAT. Because CAT is adaptive on more frequent intervals, it is expected to be more efficient than MST. Also, based on different termination strategies, CAT can terminate at any point as long as enough confidence in measurement accuracy is obtained and the content requirements are met. Conversely, MST is module-based, and thus it could only terminate after a whole stage is completed. However, if the loss in measurement efficiency and flexibility of early termination is within a tolerated range, MST may still be preferred over CAT, because it “strikes a balance among adaptability, practicality, measurement accuracy, and control over test forms” (Zenisky, Hambleton, & Luecht, 2010, p. 369).
4 A few studies have compared the measurement accuracy of MST and CAT (Armstrong et al., 2004; Keng, 2008; Kim & Plake, 1993; Patsula, 1999). They all concluded that CAT is more accurate and efficient than MST. Among them, two studies (Armstrong et al., 2004; Patsula, 1999) compared MST with linear tests as well, and both concluded that MST is more efficient than linear tests. In addition, Keng (2008) compared MST with an innovative CAT that is adaptive at the testlet level. The results of the study indicate that, compared to the testlet-level CAT, MST has higher measurement accuracy but less efficient item pool utilization. Although the findings of previous studies are generally consistent, they were conducted in the context of tests that report continuous proficiency scores; no such comparison studies have been conducted in the context of classification tests. A classification test may be a pass/fail certification exam or one that classifies examinees into three or more proficiency categories. Because the purposes differ between classification tests and those that report continuous scores, the test designs, especially the choice of items, also differ, which may then make the measurement accuracy and item bank usage different. Therefore, a comparison study in the context of classification tests is needed. The first purpose of the study is to examine the measurement accuracy of ability estimates, classification accuracy, and item bank usage of MST, CAT, and linear tests for a large-scale classification test through simulation. The second purpose of this paper is to compare different designs of MST. As Zenisky et al. (2010) described, the test design of MST is highly complex and variable. To develop a MST in an operational setting, test developers need to carefully make many decisions based on practical requirements, such as the number of stages, number of difficulty levels per stage, number of items per stage, and routing rules. This study compared the performance of the MST tests assembled under different test designs.
5 The last purpose of this study is to investigate the feasibility of a heuristic “top-down” (Luecht & Nungester, 1998) assembly method for MST. Although MST can be assembled using linear test assembly methods, the assembly of MST is more complex than the assembly of linear forms, especially when multiple parallel panels need to be assembled. In MST, modules and/or pathways are treated as the assembling unit. Luecht and Nungester (1998) mentioned two cases: the bottom-up assembly and the top-down assembly. In the bottom-up assembly, parallel forms for each module are first assembled and then mixed-and-matched to build parallel panels. In the top-down strategy, the assembled forms for each module are not completely parallel, and one more optimization procedure, in addition to that used to assemble modules, is needed to produce parallel panels in which the pathways satisfy specific constraints. The current applications of MST mostly use the bottom-up assembly, but there has been little exploration on the top-down assembly. Therefore, the demonstration of the top-down assembly in this study may provide some additional information for practitioners and researchers. There are generally two classes of test assembly techniques for MST: linear programming methods and heuristic methods.
A comprehensive description of linear
programming methods is provided in van der Linden (2005). MST studies that used linear programming assembly methods include Adema (1990), Armstrong et al. (2004), Armstrong and Roussos (2005), Breithaupt and Hare (2007), and Luecht et al. (2006). In heuristic test assembly methods, the following three are well-known: the weighted deviation model (WDM; Swanson & Stocking, 1993), the normalized weighted absolute deviation heuristic (NWADH; Luecht, 1998), and the maximum priority index (MPI; Cheng & Chang, 2009). Among them, only the NWADH has been used in the MST assembly studies. MST studies that used the NWADH assembly method include Luecht and Nungester (1998), Patsula (1999), Luecht (2000), Hambleton and
6 Xing (2006), and Jodoin et al. (2006). Linear programming methods provide an optimal solution for assembling multiple parallel panels that strictly satisfy all test assembly constraints (e.g., content coverage, item exposure); however, when the number of constraints becomes large, the procedure can be cumbersome, time-consuming, or even become infeasible. Moreover, when multiple parallel forms are needed, the number of constraints can increase in proportion to the number of parallel panels (see van der Linden, 2005). Unlike linear programming, heuristic methods do not guarantee that all of the constraints will be met, but they are less computationally intense, and can always provide a solution. Moreover, heuristic methods do not need specialized commercial software, such as CPLEX2, to solve large test assembly problems. Therefore, this study chose to use a heuristic method due to its simplicity and feasibility.
The test assembly and simulation study were completed by
computer programs written in MATLAB R2011a (The MathWorks Inc., 2011) and R (R Development Core Team, 2011).
The following sections will introduce the designs and
methodology of the study in detail. Methods Item Pool The MST panels were assembled from a real item bank containing 600 multiple-choice items. The item response theory (IRT) framework was used in the analyses of the tests, and the items were calibrated using the three-parameter logistic model (3PLM). standard deviations (SD) of the a-, b-, and c-parameters are shown in Table 1.
2
See http://www-01.ibm.com/software/websphere/ilog/ for more information.
The means and
7 Table 1 Descriptive Statistics of the Item Parameters of the Item Pool a 1.196 0.329
Mean SD
Item parameter b 0.060 1.430
c 0.153 0.072
The items cover eight content categories, and the number of items in each content category is shown in Table 2. The difficulty of the items is associated with their content category. Items from categories 1 and 2 were relatively easy, while those from categories 5, 7, and 8 were relatively difficult. The remaining categories had medium levels of difficulty. Table 2 Number of Items in Each Content Category in the Item Pool Content category Number of items
1 180
2 17
3 80
4 34
5 45
6 84
7 53
8 107
MST Models The total test length was fixed at 21 items, while the number of stages, number of modules in each stage, and number of items in each stage were altered as experimental conditions. In terms of the number of stages within a panel, this study included a four-stage model (i.e., the 1-2-3-4 model as illustrated by Figure 1; “1-2-3-4” means there are one module in the first stage, two modules in the second stage, three modules in the third stage, and four modules in the last stage) and a three-stage model (i.e., the 1-2-4 model as illustrated by Figure 2). In both models, the number of levels for the last stage was chosen to be four to aid the classification of examinees into five categories. The four classification cut-points on the θ scale were set to -1.39,
8 -0.47, 0.28, and 1.18. By setting four levels for the last stage, the difficulty of the last four modules can be naturally anchored at the four cut-points. 4HH 3H 2H
4H
1M
3M 2L
Modules 4L
3L 4LL Stages Figure 1. The 1-2-3-4 MST model. The numbers in the module names indicate the stage and the letters indicate the relative difficulty of the modules in each stage (H: high; M: medium; L: low; HH: higher than H; LL: lower than L).
3HH 2H
3H
1M
Modules 2L
3L 3LL
Stages Figure 2. The 1-2-4 MST model. The numbers in the module names indicate the stage and the letters indicate the relative difficulty of the modules in each stage (H: high; M: medium; L: low; HH: higher than H; LL: lower than L). MST can allocate different numbers of items (i.e., module length) for different stages given the total test length (21 items in this study). It can have equal-length stages, longer earlier stages, longer middle stages, or longer later stages. As pointed out by Patsula (1999), both the strategy of longer earlier stages and that of longer later stages have their own rationales. The
9 design with longer earlier stages is intended to provide higher precision for routing the examinee to subsequent stages. The design with longer later stages is intended to administer more items when the test becomes more closely aligned with the examinee’s ability level. Both designs gain some accuracy from one side and lose some accuracy from the other side. In this study, all four allocation strategies were implemented. The eight conditions of the two models are listed in Table 3. Because each examinee takes only one module per stage, the modules in the same stage contain the same number of items. Table 3 Number of Items in Each Stage
Model condition A Model condition B Model condition C Model condition D
Stage 1 6 7 4 4
1-2-3-4 model Stage 2 Stage 3 5 5 6 4 6 6 4 6
Model condition E Model condition F Model condition G Model condition H
Stage 1 7 9 6 6
1-2-4 model Stage 2 Stage 3 7 7 6 6 9 6 6 9
Stage 4 5 4 5 7
Panel Assembly Panel assembly was completed in two steps: (1) assembling modules from the item bank and (2) assembling panels from the obtained modules. The following sub-sections describe several important aspects of the assembly method. Number of forms for each module and number of parallel panels. The first step is assembling modules using the items from the item pool, and the number of forms to be assembled for each module needs to be determined. In this study, to make the expected exposure
10 rates of different modules more uniform (i.e., more efficient use of the item bank), the number of forms to be assembled for each module was determined to be inversely proportional to the number of modules of the stage the module belongs to (it was assumed that the proportions of examinees routed to different modules were roughly equal). Based on the properties of the given item bank, for the 1-2-4 models, 10 forms for the 1M were assembled; five for each of 2H and 2L; and three for each of 3HH, 3H, 3L, and 3LL. For the 1-2-3-4 models, 10 forms for 1M were assembled; five for each of 2H and 2L; four for each of 3H, 3M, and 3L; and three for each of 4HH, 4H, 4L, and 4LL. The second step is assembling panels from modules. Because the content constraint is a test level constraint (explained in detail in a subsequent subsection), many of the mixed-and-matched panels will not have a satisfactory content coverage. Therefore, the panels cannot be assembled by simply mixing-and-matching the forms of the modules; instead, an optimization algorithm similar to that in the module assembly step needs to be applied to monitor the quality of the assembled panels (i.e., the top-down assembly). For illustration purposes, this study assembled 10 parallel panels, but in practice, many more parallel panels can be assembled. Module difficulty anchors and test information function (TIF) targets. Each module had a difficulty anchor on the θ scale. The main goal of the module assembly step was to optimize the module information at the corresponding θ anchors (module information is computed by summing up the Fisher information of all items in the module). The θ anchors for the four levels in the last stage were set at the four classification cut-points. By selecting items to optimize the module information at the corresponding anchors, the four final modules will have the best discriminating power around the classification boundaries.
In this way, the
classification accuracy of the MST can be improved. The θ anchors for each module in the
11 preceding stages were computed by taking the average of the θ anchor values of their own subroutes. Because the TIFs of the assembled tests are directly related to measurement accuracy, to make the comparison fairer, the TIF targets for MST are set up in two ways: (1) in the comparison with a linear test form, the targets used in MST module assembly were computed from the linear form. Specifically, the linear form was composed of items corresponding to the four difficulty levels in the final stage of MST. Therefore, the targets for the average item information in each final stage module were computed by averaging the information of items in the linear form designed for each corresponding difficulty level. The targets for the modules in the preceding stages were computed by averaging the targets of their sub-routes. (2) Because CAT makes its optimized item selection from the item pool, the targets for MST assembly in the comparison with CAT were also optimized for the same item pool. The method for computing optimized TIF targets was described by Luecht (2003). Briefly speaking, the targets were obtained by averaging the test information values over the best several tests sequentially assembled through the maximum information method. In the panel assembly step, each pathway had a set of TIF targets. The anchors of these targets were the θ anchors of the particular modules the pathway contained. The pathway TIF is the summation of the item information functions of all of the items in the pathway. In this step, Luecht’s (2003) method was used as well to compute TIF targets for each pathway. Content coverage constraint. The content coverage constraint for panels is that all pathways should have at least one item from each of the eight content categories. However, this content constraint is a top-down constraint. It needs to be broken down to the module level for the module assembly step. The specific broken down constraint, however, is more complex than
12 the “bottom-up” constraints. Instead of setting constraints for each individual module, a general constraint was set for the overall coverage of all assembled forms for each module. In the case of four stages with an equal number of items in each stage, if a category should be covered in the whole test at least n times, then it is expected to be covered at least n / 4 times for each stage. For the case of unequal module sizes in different stages, the expected chance of appearance is in proportion to module sizes. The specific lower bound for each module is further computed in proportion to the number of forms to be assembled, respectively. Item overlap. The use of the items in the item bank also needs to be considered. An upper bound was set up for the number of different modules that an item is allowed to appear in. Two item overlap conditions were implemented: (a) no overlap, allowing an item to appear in only one module at maximum, and (b) with overlap, allowing an item to appear in two different modules at maximum. It is expected that modules assembled under the with-overlap condition tend to satisfy the target TIF and content constraints more fully than modules assembled under the no-overlap condition. The heuristic assembly algorithm. In both the module assembly and panel assembly steps, a simplified version of the normalized weighted absolute deviation heuristic (NWADH; Luecht, 1998) was used. In the module assembly step, let: i = 1, 2, …, I denote one of the I items in the item bank, j = 1, 2, …, J denote one of the J items needed to be selected into a module, and n = 1, 2, …, N denote one of the N constraints. In the module assembly step, there are ten constraints: the TIF value at the θ anchor of the module, the item difficulty target for the module, and eight content constraints on the eight content categories. Each constraint has
13 a target Tn and a weight Wn preset to particular constants. In this study, the targets can be different for each module and the weights were obtained through a few adjusting trials. The assembly of a module containing J items is performed by repeating the following process for j = 1, 2, …, J: For the jth item, select an item that maximizes, ∑
∑
,
,
(1)
subject to the constraints, ∈ 0, 1 for i = 1, 2, …, I, ∑
(2)
,
(3)
⋯
1,
(4)
where xi represents the decision variable for selecting the ith item into the module and ei,n , which can be regarded as the “priority index” of item i on constraint n, is defined by the following equation, ,
1
∑∈
,
where
,
, ∑ ∈
0
,
(5)
0, is the subset of item bank excluding the selected
1 items, and
,
is an absolute
deviation as defined in the following paragraph. When none of the available items deviate from the target for the constraint n, namely ∑ ∈ priority indices
,
,
0, the division is undefined. In this case, the
for all available items on constraint n are set to the same value, and 0 is used
here due to its simplicity. In the module assembly step, di,n is computed for the TIF value at the corresponding θ anchor, the item difficulty value, and each of the eight content categories. Let ui,n denote the attribute associated with constraint n of item i. For the constraint on module information at the corresponding θ anchor(s), n = 1 and
14 ∑
,
,
where
, ∈
,
,
(6)
is the target value of the constraint on module information. For the constraint on item
difficulty, n = 2 and ,
where
,
, ∈
,
(7)
is the target item difficulty for that particular module. For the constraints on the content
categories, n = 3, 4, …, 10 and ∑ ,
where
,
,
,
∑
0,
,
,
, ∈
,
(8)
is the lower bound for number of items that belong to each content category required
for the module, as explained previously in the section “Content coverage constraint”. In the panel assembly step, the modules assembled in the module assembly step form a “module pool”; panels are assembled using the module pool and the same heuristic algorithm. The targets and constraints are set for each pathway in the panel. The TIF target becomes four TIF values at the
anchors of the four modules that each pathway contains. There is no
constraint on item difficulty in the panel assembly step, and the content constraints become that all pathways must have at least one item from each content category. Assembly priority. The heuristic method is greedy, which means the modules/panels assembled earlier tend to have better-suited items/modules, and thus, the assembly priority is considered to have a non-ignorable impact on the performance of MSTs. To investigate the impact, two assembly priority conditions were compared: (a) backward assembly, namely, the assembly starts from Stage 4 and ends in Stage 1, and (b) forward assembly, namely the assembly starts from Stage 1 and ends in Stage 4.
15 Moreover, within a stage, a spiral design was used in the module assembly step to give each difficulty level an overall equal priority to select items. In the panel assembly step, a randomization procedure was utilized to give each panel an overall equal priority to select modules. Routing Rules There are two major routing rules for MST: the defined population interval (DPI; Hambleton & Xing, 2006; Jodoin et al., 2006) method and the approximate maximum information (AMI; Leucht, Brumfield, & Breithaupt, 2006) method. This study used the AMI method. This method uses the intersection point of the module information curves of the two adjacent difficulty levels as the routing cutoff point (Breithaupt & Hare, 2007). It is analogous to the maximum information item selection method in CAT. Above the cutoff θ, the module at the higher difficulty level provides more information, and below the cutoff θ, the module at lower difficulty level provides more information. Although the panels are intended to be parallel, the actual module information curves still vary across panels, and thus the AMI cutoff θ values are computed individually for each panel. After deciding the cutoff points, either true-score routing (TS) or theta routing can be implemented. The θ routing strategy obtains a provisional θ estimate for the examinees after each stage and routes the examinees by comparing their θ estimates with the cutoff θ values. The true-score routing first computes the true scores for cutoff θ values, and then compares the examinee’s total-correct scores with the cutoff true scores. Luecht, et al. (2006) claimed that the simpler true-score routing is sufficient for the routing purpose. This study implemented both the true-score routing and θ routing strategies to verify their statement.
16 In summary, the factors in the MST design included: (a) number of stages (three or four), (b) module length assignment (four patterns), (c) overlap (allowing an item to appear in one or two different modules at maximum), (d) routing strategy (true-score routing or θ routing), and (e) assembly priority among stages (forward assembly or backward assembly). After the panels are assembled and the cutoff scores are computed, the panels should go to expert review. After approved changes are made, the panels are approved for test administration. This simulation study assumes that all of the assembled panels were approved for administration. Simulation Study The examinee true θs were simulated from the N(0, 1) distribution truncated within (-3.5, 3.5). The reason for truncation is to prevent an unnecessary confounding effect brought by outliers. The sample size was 5000. To increase comparability, the same set of true θs was used across all conditions. Responses to each item were simulated by a Monte Carlo experiment. Each examinee was randomly assigned a panel, and the program routed the examinee between stages according to the routing rules. After the whole test was completed, a maximum likelihood estimate (MLE) of ability was given to the examinee, and the examinee was classified into one of the five classification categories based on the range where the final θ estimate fell in. Different conditions of MST were compared through the simulation study. The MSTs were also compared with a representative linear test form comprised of 30 items and a CAT with a fixed length of 21 items, the same as the MSTs. The CAT had the same content constraints as the MST as well. The item selection procedure in CAT incorporated the traditional maximum information method, which is the most commonly-used item selection method in CAT. To
17 control item exposure, the administered item was randomly drawn from the 15 most informative items. The evaluation criteria included several aspects. The first aspect was measurement accuracy. Both the accuracy of θ estimation and classification were evaluated. For θ estimation, the root mean square error (RMSE) of the θ estimates and the Pearson correlation coefficient between the true θs and θ estimates were computed. For classification accuracy, the correct classification rate was computed by dividing the number of examinees correctly classified by the total number of examinees. The evaluation of the comparison between MST and CAT also included the evaluation of item bank usage. The indices included (a) the number of items in the active pool, namely, the number of items selected into the parallel panels; (b) the number of unused items; (c) the maximum, mean, and standard deviation of the item exposure rate; and (d) the average test overlap rate and average conditional test overlap rates for three subgroups of examinees grouped based on their ability levels. Specifically, the item exposure rate for an item was computed by dividing the number of times the item is administered by the number of examinees; the average test overlap rate was computed as the average of the proportion of overlapping items administered to any possible pair of examinees (Way, 1998). Results In each experimental condition, the proportion of content categories that did not meet the constraint (i.e., one item from each of the eight content categories) was computed and averaged over all pathways and all panels. The maximum average proportion of unsatisfied content constraint for a condition was 0.130, and the average over all conditions was 0.088. Although it is possible to make all pathways strictly meet the content category constraint by adjusting the
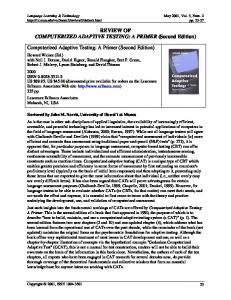
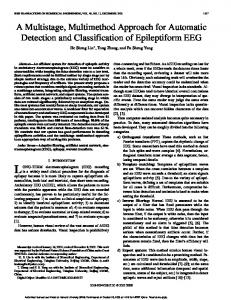
18 weights in the heuristic assembly algorithm, this may harm the parallelism of the test information curves across the panels. In this study, the unsatisfied proportion was considered acceptable and no further adjustment of the weights was performed. If the violation is not severe, it is also possible to manually replace items to satisfy the content category constraint. Test information can also be monitored for all modules and pathways in the assembled panels by plotting the module/pathway information curves. Figure 3 (see page 19) shows an example of the module information function curves in each stage of an assembled panel. The curves hit the targets and spread over the difficulty range. Figure 4 (see page 20) is an example of the pathway information curves of the 10 parallel panels. The ten parallel panels produced almost identical information curves for all eight pathways, which means that the panels are highly parallel in terms of test information. Moreover, the information curves peak at different locations along the θ scale, which adequately reflects the different targeted ability levels of the subgroups of population designed to take each pathway.
19
Figure 3. Module information function curves in one of the 1-2-3-4 panels (the best condition of linear-target no-overlap MST: 7-6-4-4, backward assembly, Panel 4). The red circles indicate the module information targets at corresponding θ anchors.
Figure 4. Pathway information curves of the 10 parallel panels for one of the 1-2-3-4 models (the best condition of linear-target with-overlap MST: 6-5-5-5, backward assembly).
20
21 Each subplot in Figure 4 is a different pathway in the model; different curves in a subplot represent the same pathway in different parallel panels (Pathway 1: 1M-2H-3H-4HH; Pathway 2: 1M-2H-3H-4H; Pathway 3: 1M-2H-3M-4H; Pathway 4: 1M-2H-3M-4L; Pathway 5: 1M-2L3M-4H; Pathway 6: 1M-2L-3M-4L; Pathway 7: 1M-2L-3L-4L; Pathway 8: 1M-2L-3L-4LL). Comparison Among Different MST Designs Different conditions of MST were compared in terms of correct classification rates (CCR). Figure 5 (see page 22) presents the CCR for all of the MST conditions. In the plots, the first two model conditions are the same; the reason for replicating the first model condition is to provide a baseline of random variation. The difference between the conditions of the upper two subplots and bottom two subplots is that they have different information targets in the assembly procedure. The targets used by the MSTs in the upper two subplots were computed from the representative linear form, as described in the Methods section. The targets used by the conditions in the bottom two were optimized from the given item bank. Because the targets optimized from the item bank were higher than those based on the linear form, the classification accuracies of the conditions with the bankoptimized targets were higher than those with linear form targets.
Figure 5. Correct classification rates (CCR) for all MST designs. The horizontal lines in the two top subplots indicate the CCR of the linear test and those in the two bottom subplots indicate the CCR of the CAT.
22
23 The three-stage models appear to the right of the vertical lines in the plots, and the fourstage models appear to the left of the vertical lines.
Only in the bank-optimized and with-
overlap conditions, the four-stage models provided slightly higher CCR than the three-stage models. No consistent advantage of the four-stage models was observed in other subplots. This is expected, because the four-stage models are theoretically more adaptive and thus more efficient; however, in the MST assembly, having more stages brings in greater complexity, which may decrease the overall quality of the assembled tests. This also confirms previous researchers’ claim (Jodoin et al., 2006) that including more stages does not necessarily significantly increase measurement precision. It is not clear whether a longer routing stage, longer middle stages, or longer later stages is better. This result again confirms previous research findings (Chen, 2011; Patsula, 1999). Comparing the no-overlap conditions and the with-overlap conditions, for the bankoptimized-target conditions, the with-overlap conditions provided higher CCR than the nooverlap conditions, because by allowing some overlap, the panels were allowed to have more informative items. Therefore the optimized targets are higher, and thus the assembled panels are more informative. But for the linear-form-target conditions, the targets are fixed, so there is not much difference between no-overlap and with-overlap. For operational use, the targets should be fixed. Therefore, there will not be much difference in CCR between no-overlap and withoverlap; rather, the difference is in the item bank usage. To assemble the same number of parallel panels, the no-overlap conditions use more items and have lower item exposure rates than the with-overlap conditions.
24 There were no consistent differences between true-score routing and θ routing. This result confirms Luecht et al.’s (2006) claim that the simpler true-score routing algorithm performs as well as the more complicated θ routing. With respect to forward assembly versus backward assembly, there was a trend, especially in the bank-optimized conditions, that the backward assembly method produced higher classification accuracy. The backward method assembles the most complicated stage (i.e., the stage with the most difficulty levels) first, which offers more available items to build the complex structure; while the forward method assembles the simplest stage first, leaving fewer available items for the stages with more complex structures. Therefore, the backward method can assemble panels with more neatly spread module information curves, leading to higher classification accuracy. Comparison Between the MSTs and a Linear Test Form We also compared the MSTs with a representative operational linear form. The linear form had 30 items. Table 4 shows the comparison results. In the table, the best and worst MST conditions were chosen based on CCR from all the MST conditions for either the no-overlap group or with-overlap group.
25 Table 4 Comparison Between the MSTs (Linear Form Target) and a Linear Form
Correct classification rate RMSE Pearson correlation Test length
Best MST conditions No With overlap overlap 0.745 0.733 0.401 0.412 0.936 0.933 21 21
Worst MST conditions No With overlap overlap 0.722 0.713 0.374 0.419 0.940 0.932 21 21
Linear form 0.703 0.364 0.939 30
Although the test length was 30% shorter than the linear test, all MST conditions provided a higher CCR than that of the linear form. The linear test form had smaller RMSE and higher Pearson correlation coefficient than almost all of the MST conditions. Two possible reasons for this result may be (a) the test length of the linear form is longer, and (b) the MSTs were assembled to have higher test information around the classification boundaries than the linear test form. Comparison Between the MSTs and a CAT The MSTs were also compared with a fixed-length CAT.
The CAT had content
balancing algorithms; specifically, in each test, at least one item should come from each of the eight content categories. The first four items in the CAT were randomly selected. In addition, in the item selection starting from the fifth item, 15 most informative items at the examinee’s provisional ability estimate were first selected, and then one of them was randomly drawn to be the next administered item. Table 5 shows the comparison results.
26 Table 5 Comparison Between the MSTs (Bank-Optimized Target) and a CAT
Correct classification rate RMSE Pearson correlation Test length Number of used items Item pool size Item exposure rate Max Mean SD Low Average Medium conditional test High overlap rate Average test overlap rate
Best MST conditions No With overlap overlap 0.770 0.788 0.383 0.388 0.941 0.945 21 21 224 131 224 131 0.129 0.245 0.094 0.160 0.018 0.047 0.122 0.233 0.145 0.302 0.156 0.307 0.097 0.174
CAT 0.781 0.254 0.969 21 530 600 0.256 0.040 0.053 0.165 0.215 0.162 0.111
The examinees are divided into three groups by ability level. Low: θ < -0.43; Medium: -0.43 ≤ θ < 0.43; High: θ ≥ 0.43.
With the same number of items, the CAT produced lower RMSE and higher Pearson correlation coefficient than the MSTs. In terms of CCR, the CAT had higher CCR than all of the no-overlap MSTs, but some with-overlap MSTs had even higher CCR than the CAT (also seen in Figure 5). The main reason is that the MST modules in the last stage were assembled to maximize the information at the classification bounds, while the CAT was designed to select items to maximize the information at the provisional ability estimate. Although the MSTs may not estimate the exact trait values as accurately as the CAT, they may still provide accurate classification results. In the CAT, the whole item bank of 600 items was considered active. On the contrary, in the MSTs, only those items selected into the ten parallel panels were considered active. Specifically, the best no-overlap MST had 224 items in its item pool, and the best with-overlap
27 MST had only 131 items in its pool.
In MST, all of the active items were exposed in
administration, but in CAT, 70 out of 600 items were never exposed to examinees. The item exposure rates are not directly comparable because the item pool sizes are different. However, the item exposure rates of MSTs were more uniform than the CAT, which is desirable. Comparing the best no-overlap MST with the CAT, although the MST used only one third of the active items in the CAT, item exposure rates were more uniform and the average overall/conditional test overlap rates were lower. The trade-off is in classification accuracy. Comparing the best with-overlap MST with the CAT, the MST used less than one fourth of the active items in the CAT, but had even higher classification accuracy and lower item exposure rate than the CAT. The trade-off is the average test overlap rate for the with-overlap MST is higher than the CAT, which might indicate a higher risk for a test security breach. Conclusion and Discussion This study demonstrated automated top-down assembly of MST for a large-scale classification test by using a real item bank of 600 items and a revised version of the NWADH heuristic method. It compared different MST designs, and it compared MST with CAT and a linear test form. The results of the comparisons among different MST designs indicate that no consistent differences were found (a) between the four-stage models and three-stage models; (b) among different module-length assignments; and (c) between true-score routing and the more complicated θ routing. There was a trade-off in item bank usage and measurement accuracy between allowing and not allowing items to appear in more than one module. Finally, backward assembly was found to be superior to forward assembly. The study also compared MST with a linear test form and a CAT. Compared with the linear test form, the MST both shortened the test from 30 items to 21 items and improved the
28 classification accuracy.
Compared with the CAT, there was a trade-off between the
classification accuracy and the item bank usage. The no-overlap MSTs led to more efficient item bank usage than the CAT, but it had sub-optimal classification accuracy. The with-overlap MSTs had the same level of classification accuracy as the CAT and lower item exposure rate, but higher average test overlap rate. It should be noted that, however, the design of the CAT used in the simulation study is typical of that in practical applications (i.e., not classification-oriented CAT). In the context of a classification test, some classification-oriented CAT designs are available (e.g., Eggen, 1999; Eggen & Straetmans, 2000; Thompson, 2011). Since classification accuracy and item bank usage highly depend on the design (e.g., item selection method, stopping rule, exposure control strategy), the comparison between the performance of these classificationoriented CAT designs and that of the MST design may be conducted in the future. Future studies can also explore other MST models. For example, if an even shorter test is desired, modules can have fewer items, and panels can have fewer stages. However, in general, two-stage models are not recommended due to policy concerns: examinees need a chance to recover if accidentally routed too low in the second stage (Zenisky et al., 2010). A variable-length MST is also possible. For example, based on the 1-2-3-4 model, examinees who have correctly (or incorrectly) responded to all items in the first two stages may be routed to an extremely difficult (or easy) module (this means that two more levels are added to the third stage). If these examinees still do very well (or poorly) in the third stage and it becomes obvious that they are in the highest (or lowest) classification category, the test will be terminated after the third stage (see, for example, Thompson, 2011, for more information about termination strategies). Otherwise, the examinees will be routed to the final stage. This design may look like a 1-2-5-4 model.
29 To better control the quality of the assembled panels, one could initially assemble a sufficient number of panels and then apply a filter to discard the panels that fail to satisfy too many content constraints, have too small test information, or have TIFs that deviate too far from the targets. Also, more assembly constraints can be included in the Automated Test Assembly (ATA) program, such as the expected testing time.
The heuristic methods can deal with many
constraints without dramatically increasing the computational time. However, the weights for each constraint need to be adjusted carefully according to importance. Finally, the framework of MST may be more naturally applied to a test that includes passage-based (or testlet-based) items. However, the IRT models used for the passage-based items may have significant effect on the assembly of modules and panels as well as the accuracy and efficiency of the test.
Comparing IRT models used for passage-based items (e.g.,
dichotomous model without considering the passage structure, polytomous model, and testlet model) in the context of MST and ATA may provide further information about the utility of the MST designs.
30
31 References Adema, J. J. (1990). The construction of customized two-stage tests. Journal of Educational Measurement, 27(3), 241-253. Armstrong, R. D., Jones, D. H., Koppel, N. B., & Pashley, P. J. (2004). Computerized adaptive testing with multiple-form structures. Applied Psychological Measurement, 28(3), 147164. Armstrong, R. D., & Roussos, L. (2005). A method to determine targets for multi-stage adaptive tests. No. 02-07). Newton, PA: Law School Admission Council. Belov, D. I., & Armstrong, R. D. (2008). A Monte Carlo approach to the design, assembly, and evaluation of multistage adaptive tests. Applied Psychological Measurement, 32(2), 119137. Breithaupt, K., & Hare, D. R. (2007). Automated simultaneous assembly of multistage testlets for a high-stakes licensing examination. Educational and Psychological Measurement, 67(1), 5-20. Chen, L-Y. (2011). An investigation of the optimal test design for multi-stage test using the generalized partial credit model. (Doctoral dissertation). The University of Texas at Austin, TX. Cheng, Y., & Chang, H. (2009). The maximum priority index method for severely constrained item selection in computerized adaptive testing. British Journal of Mathematical and Statistical Psychology, 62(2), 369-383. Eggen, T. J. H. M. (1999). Item selection in adaptive testing with the sequential probability ratio test. Applied Psychological Measurement, 23(3), 249-261. Eggen, T. J. H. M, & Straetmans, G. J. J. M. (2000). Computerized adaptive testing for classifying examinees into three categories. Educational and Psychological Measurement, 60(5), 713-734. Hambleton, R. K., & Xing, D. (2006). Optimal and nonoptimal computer-based test designs for making Pass–Fail decisions. Applied Measurement in Education, 19(3), 221-239. Hendrickson, A. (2007). An NCME instructional module on multistage testing. Educational Measurement: Issues and Practice, 26(2), 44-52. Jodoin, M. G., Zenisky, A., & Hambleton, R. K. (2006). Comparison of the psychometric properties of several computer-based test designs for credentialing exams with multiple purposes. Applied Measurement in Education, 19(3), 203-220. Keng, L. (2008). A comparison of the performance of testlet-based computer adaptive tests and multistage tests. (Doctoral dissertation). The University of Texas at Austin, TX.
32 Kim, H., & Plake, B. S. (1993, April). Monte Carlo simulation comparison of two-stage testing and computerized adaptive testing. Paper presented at the Annual Meeting of the National Council on Measurement in Education, Atlanta, GA. Lewis, C., & Sheehan, K. (1990). Using Bayesian decision theory to design a computerized mastery test. Applied Psychological Measurement, 14(4), 367-386. Luecht, R. M. (1998). Computer-assisted test assembly using optimization heuristics. Applied Psychological Measurement, 22(3), 224-236. Luecht, R. M. (2000, April). Implementing the computer-adaptive sequential testing (CAST) framework to mass produce high quality computer-adaptive and mastery tests. Paper presented at the Annual Meeting of the National Council on Measurement in Education, New Orleans, LA. Luecht, R. M. (2003, April). Exposure control using adaptive multi-stage item bundles. Paper presented at the Annual Meeting of the National Council on Measurement in Education, Chicago, IL. Luecht, R. M., Brumfield, T., & Breithaupt, K. (2006). A testlet assembly design for adaptive multistage tests. Applied Measurement in Education, 19(3), 189-202. Luecht, R. M., & Burgin, W. (2003, April). Test information targeting strategies for adaptive multistage testing designs. Paper presented at the Annual Meeting of the National Council on Measurement in Education, Chicago, IL. Luecht, R. M., & Nungester, R. J. (1998). Some practical examples of computer-adaptive sequential testing. Journal of Educational Measurement, 35(3), 229-249. Patsula, L. N. (1999). A comparison of computerized adaptive testing and multistage testing. (Doctoral dissertation). University of Massachusetts Amherst, MA. R Development Core Team (2011). R: A language and environment for statistical computing. R Foundation for Statistical Computing, Vienna, Austria. ISBN 3-900051-07-0, URL http://www.R-project.org/. Swanson, L., & Stocking, M. L. (1993). A model and heuristic for solving very large item selection problems. Applied Psychological Measurement, 17(2), 151-166. The MathWorks Inc. (2011). MATLAB version 7.12.0. Natick, Massachusetts: The MathWorks Inc. Thompson, N. A. (2011). Termination criteria for computerized classification testing. Practical Assessment, Research & Evaluation, 16(4). van der Linden, W. J. (2005). Linear models of optimal test design. New York: Springer.
33 Way, W. D. (1998). Protecting the integrity of computerized testing item pools. Educational Measurement: Issues and Practice, 17(4), 17-27. Zenisky, A., Hambleton, R. K., & Luecht, R. M. (2010). Multistage testing: Issues, designs, and research. In W. J. van der Linden & C. A. W. Glas (Eds.), Elements of adaptive testing (pp. 355-372). New York: Springer.
ACT Research Report Series 2012 (6)
Multistage Adaptive Testing for a Large-Scale Classification Test: Design, Heuristic Assembly, and Comparison with Other Testing Modes Yi Zheng Yuki Nozawa Xiaohong Gao Hua-Hua Chang September 2012
*050206120*
Rev 1