Key words- Landslide, Fuzzy theory, J-shape membership function, Gamma fuzzy ... and Alan from National Geology Institute, geological status of the region was ... Classes of weighting factors based on the slip occurred between 0 and 1 were ..... S Lee, Application and verification of fuzzy algebraic operators to landslide ...
IOSR Journal of Applied Physics (IOSRJAP) ISSN – 2278-4861 Volume 1, Issue 4 (July-Aug. 2012), PP 17-24 www.iosrjournals.org
Application of Satellite images and fuzzy set theory in Landslide hazard Mapping in Central Zab basin H. Shahabi * , S. Khezri , B. B. Ahmad1 and H. Allahvirdiasl1 1
2
1
Department of Remote sensing, Faculty of Geo Information and Real Estate, universiti Teknologi Malaysia, UTM, 81310 Johor Bahru, Johor, Malaysia 2 Department of Physical Geography, Faculty of Natural resources, University of Kurdistan, Iran
Abstract: Landslides are one kind of slopes processes have been take place in some area at worldwide and Iran every year, and they are associated with damaged, many people are harmed and losses their properties. The aim of this research landslide hazard assessment in central zab basin in the southwest mountainsides of West-Azerbaijan province, Iran by using information layers and effective factors in landslide hazard such us: slope, aspect, litho logy, land use, distance to drainage, distance to road, distance to fault and precipitation using fuzzy set theory, images satellite from Landsat ETM + sensor in 2009 and PAN sensor with 5.6 meters in 2010 from IRS-1D satellite, SPOT 5 satellite images in 2008, and GIS. The classification was done with histogram trend changes and available classifications. Weighting variables classes were determined between 0–1 (profusion proportion). Fuzzification each one of effective factors using IDRISI software terminated and after was assigned type and shape membership function. In this research, used J-shape membership function and gamma fuzzy operator to obtain landslide hazard susceptibility. Different maps of gamma fuzzy operator values 0.8 and 0.9 to make ready for study area. Obtained maps accuracy was evaluated with use of quality sum index (QS). Models evaluation results were showed 0.9 operator in gamma fuzzy model had best accuracy in making landslide susceptibility mapping in study area. Key words- Landslide, Fuzzy theory, J-shape membership function, Gamma fuzzy operator, central Zab basin.
I.
Introduction
Landslide hazard and risk zoning and mapping for urban and rural areas is widely performed around the world [1, 2, 3, and 4]. More than 95 percent material losses were taken place in undeveloped countries and 75 percent damage belongs to development nations. Landslides as geohazard make plenty socio-economic hazard. Although landslide economical damages in developing countries are more than other country, but according to UNDRS study this rate is about one or two percent of GNP [5]. So, human loses and economical damages relatively in Underdeveloped countries are more than development countries. According to this, management of natural hazard is necessary. Geohazard in Iran, such as earthquake, flood, and landslide are very plentiful, because lithological and topographical factors and another agent are active. More than half of Iran's area was located in mountain region, as mentioned in above many landslides take placed in these areas. Damaging has been made by landslides are considerable. This study was conducted at mountain region "Sradasht" in central zab basin in the southwest mountainsides of west-Azerbaijan province, Iran. The main object of this study is diagnostic of sensitive area to landslide using fuzzy logic operators and satellite images with aid of GIS. This method carried some statistical methods and produces some accurate result to predict geohazard for example landslide. Many researchers in some countries that have serious problems about landslides have been started. Prior works In this case was conducted by USA geo-technique engineering, later geologist and geomorphologist completed their works. Leroi [6] discuss the methods which can be used to assess probability of landsliding. Traditional methods of landslide hazard mapping have been based on extensive fieldwork by expert geologists in potentially dangerous areas. This is slow, expensive and very labor intensive operation, and as such cannot be widely applied. With the increasing availability of high resolution spatial data sets, GIS, and computers with large and fast processing capacity, it is becoming possible to partially automate the landslide hazard and susceptibility mapping process and minimize fieldwork. Recently, there have been studies on landslide hazard evaluation using GIS, and many of these studies have applied probabilistic models [7, 8, 9, 10, 11, 12, and 13]. As a new approach to landslide hazard evaluation using GIS, data mining, safety factor, fuzzy logic and artificial neural network models have been applied [14, 15, 16, 17, 18, and 19].
II.
Study area
Zab basin occupies southwestern section of West Azerbaijan and northwestern part of Kurdistan. The area under present study covers parts of mountains and slopes in southwestern West Azerbaijan in the central www.iosrjournals.org
17 | Page
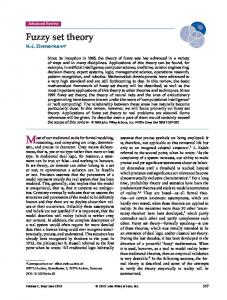
Use of Satellite images and fuzzy set theory in Landslide hazard Mapping in Central Zab basin portion of Zab basin between the latitudes of (36° 8' 25") N and (36° 26' 27") N and the longitudes of (45° 21' 21") E and (45° 40' 44") E. Central Zab basin has a north-south orientation and stretches almost 30km in eastwest direction. The study area covers some 520km 2 of its total area (Fig. 1). It is one of the settled geographical basins including a city, three towns or small cities, and over 80 villages [20]. Here, a north-west extension branches off from the east-west oriented ridges of Zab valley, creating a different landscape from that of the internal sections of Azerbaijan and Kurdistan. The major part of the study area is located in the SanandajSirjan zone and its east and eastern north parts located in the Mahabad- Khoy zone. In aspect of tectonic since the region is located in major Zagros thrust direction, faults are the main causes of pit formation. The region morphology strongly affected by tectonic forces [21].
Fig.1. Geographical posation of study area
III.
Material and Methods
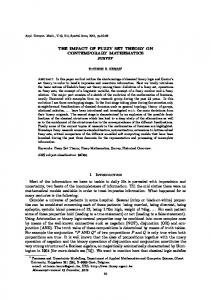
In landslide hazard zonation, the instable regional factors that their fluctuations were accompanied by differing frequencies of landslide events were defined as controlling factors in zonation. In the first step, through compilation and investigation of 1:250000 geological map of sardasht, Rabat and Alan from National Geology Institute, geological status of the region was carefully studied (Geological map of the case study). After preparation of the map for litho logical units, they were digitalized. We used 1:50000 scale topographic maps supplied by Army Geography Organization, to prepare the Digital Elevation Model (DEM), slope map, slope aspect, distance to fault and their related layers. All elevation points and 100 meter counter curves and waterways of zab basin were digitalized and all the needed operations for using this information in Arc GIS environment were carried out. Through digitalized counter curves and elevation points and Interpolation technique, Digital Elevation Model prepared. Geological, topographical and plant cover maps, satellite images and the information about rainfalls were used for information processing in GIS environment. Another dataset was land use, which was interpreted from Landsat ETM+ image on the 21 April 2009, it was calibrated using field observations. Because of significant cloud coverage, results of the classification were edited and simplified by manual digitization. The interpreted images were then digitally processed to further modify the boundaries by supervision classification with ERDAS (Earth Resource Data Analysis System) software. landslide-inventory map of the study area was identified by SPOT 5 satellite on the 25 May 2008 Extensive field studies were used to check the size and shape of landslides, to identify the type of movements and the materials involved, and to determine the state of activity (active, dormant, etc.) of the landslides. A total of 23 landslides were identified in the study area (Fig. 2).
Fig. 2. Landslide Inventory map of Zab Basin Layer of the roads on the satellite IRS-1D PAN imagery with a resolution of 5.6 m was obtained in 2010. At continue, layers prepared in this study in order to landslide hazard zonation by using different fuzzy operators like Fuzzy OR, Product fuzzy, Fuzzy algebraic product and fuzzy algebraic sum operator and fuzzy www.iosrjournals.org
18 | Page
Use of Satellite images and fuzzy set theory in Landslide hazard Mapping in Central Zab basin gamma 0.8 and fuzzy gamma 0.9 were analyzed. After the independent variables affecting the occurrence of landslides were identified, the next step, independent variables were categorized and combined with layers landslide. Classes of weighting factors based on the slip occurred between 0 and 1 were determined in each category (frequency ratio method) and different weight maps were constructed. Finally, the prediction of potential landslide hazard zonation was done. The fuzzy-logic method allows flexible combinations of weighted maps derived from any measurement scale. Given two or more maps with fuzzy-membership functions for the same set, five fuzzy operators, namely: 1) fuzzy-OR, 2) fuzzy-AND, 3) fuzzy algebraic sum, 4) fuzzy algebraic product, and 5) fuzzy-gamma, can be employed to combine membership values [22]. A script can be written in GIS to employ this method. Five fuzzy operators can be expressed mathematically as: OR MAX ( A , B , C ,....) (Fuzzy OR) (1)
AND MIN ( A , B , C ,....)
(Fuzzy AND)
(2)
(Fuzzy algebraic sum)
(3)
(Fuzzy algebraic product)
(4)
n
sum 1 (1 i ) i 1
n
product 1 i i 1
combination Fuzzya lg ebraicsum * Fuzzya lg ebraicproduct 1
(Fuzzy gamma)
(5)
Where: I is the fuzzy-membership function for the i-th map, and i=1, 2, …, n. Output membership values are controlled by various pieces of evidence. In the fuzzy-OR operator (Eq. (1)), the combination output membership value for any particular location is controlled by the maximum fuzzy-membership value of the input maps occurring at that location. In the fuzzy-AND operator (Eq. (2)), the output membership value for any particular location is controlled by the smallest fuzzy-membership value of the input maps occurring at that location. These operators are appropriate if the combined membership value at a location is controlled by the most suitable evidence maps. If two pieces of evidence favor a hypothesis so that the combined evidence is more supportive than one piece of evidence, then the fuzzy algebraic sum, fuzzy algebraic product, and fuzzy gamma operators are appropriate. In the fuzzy algebraic sum (Eq. (3)), the output value is always larger than or equal to the largest contributing fuzzy-membership value. The maximum limit of the output value is 1.0. The fuzzy algebraic product is complementary to the fuzzy algebraic sum (Eq. (4)), and the output value is always smaller than or equal to the smallest contributing fuzzy-membership value. The maximum limit of the value is 1.0. The fuzzygamma operation is defined in terms of the fuzzy algebraic sum and the fuzzy algebraic product (Eq. (5)). In the fuzzy-gamma operation, when gamma is 1, the combination is the same as the fuzzy algebraic sum, and when gamma is 0 the combination equals the fuzzy algebraic product. Therefore, the appropriate choice of gamma produces output values that ensure a flexible compromise between effects of the fuzzy algebraic sum and the effects of the fuzzy algebraic product [23]. The spatial relationships between the landslide location and each landslide-related factor were analyzed by using the probability model–frequency ratio. Finally, frequency ratios for each factors type or range were calculated by dividing the landslide occurrence ratio by the area ratio. If the ratio is greater than 1, the relationship between landslides and the factor's is higher and, if the ratio is less than 1, the relationship between landslide and each factor's type or range is lower. Then, the frequency ratio was normalized between 0.00 and 1.00 to create the fuzzy membership value [24]. 3.1. Landslide hazard zonation of the central Zab basin using fuzzy logic operators: ` The fuzzy set theory introduced by Zadeh [25] is one of the tools used to handle the complex problems. Therefore, the fuzzy set theory has been commonly used for many scientific studies in different disciplines. The fuzzy set theory employs the idea of a membership function that expresses the degree of membership with respect to some attribute of interest. With maps, generally, the attribute of interest is measured over discrete intervals, and the membership function can be expressed as a table relating map classes to membership values. The fuzzy logic method allows for more flexible combinations of weighted maps, and could be readily implemented with a GIS modeling language. The idea of using fuzzy logic in landslide hazard mapping is to consider the spatial objects on a map as members of a set. For example, the spatial objects could be areas on an evidence map and the set defined as areas hazardous to landslide [26]. Fuzzy membership values must lie in the range (0, 1), but there are no practical constraints on the choice of the fuzzy membership values.
www.iosrjournals.org
19 | Page
Use of Satellite images and fuzzy set theory in Landslide hazard Mapping in Central Zab basin IV.
Results and Discussion
That fuzzy set is a sufficient tool to convert quality to quantity, despair some people imaging fuzzy set theory is not a in depended approach to risk landslide zonation but it is a tool to promote accuracy different approaches. Values are chosen to reflect the degree of membership of a set, based on subjective judgment. Given two or more maps with fuzzy membership functions for the same set, a variety of operators can be employed to combine the membership values. Then each to obtained weights was normalized using frequency ratio and results were entered to "IDRISI" software [27]. In this study, we used membership function "J-shape". 1.1.
J-shape function This function is very contemporary and like as linear membership function. This function has three positions, including: increasing, decreasing and intermediate. If membership function is linear and increasing we must applied equation (6). If membership function is linear and decreasing, we must applied equation (7), [28 and 29].
MJI Z 1 1 ((Z C1 (C1 C0 )) 2
MJDZ 1 1 ((Z C2 (C3 C2 ))2
C1 Z if
C1 Z if
MJI Z 1
)6(
MJDZ 1
)7(
Where: C0, C1, C2 and C3 are the control of the membership function in J – shape (Fig. 3).
Fig.3. J-shape function in fuzzy set 1.2.
Gamma Operation Given the dramatic difference between the results of operations Product (equation 8) and Sum (equation 9) or in other words very high adjustment sensitivity of Product Operator and sensitivity to very low of operator Sum, another fuzzy gamma operator (equation 5) presented that it is the result of multiplying two operators and
is variable between zero and one. n
combination i , i 1
) 8(
n
combination 1 i 1 i i 1
combination Fuzzya lg ebraicsum * Fuzzya lg ebraicproduct
) 9(
1
) 10(
1.3.
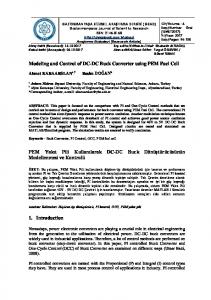
Affecting factors on the occurred landslides in the region The SPOT imagery is mainly composed of green, red, and near-infrared wavebands. In the green and red wavebands, the landslide has a stronger reflectance than other land covers. However, in the near-infrared waveband, vegetation reflects the near-infrared more strongly than bare soil (landslide). In this study, in order to effectively extract landslides from multitemporal imageries, the image differencing algorithm was used to generate the differentiated image from pre- and post-quake images. The algorithm is based on a pair of coregistered images of the same area collected at different times. The process simply subtracts one digital image, pixel-by-pixel, from another, to generate a third image composed of the numerical differences between the pairs of pixels [30]. The waveband combination (Gdif, Rdif, NIRdif) for the differentiated image can be expressed as (Eq. (11)): (Gdif, Fdif, NIRdif)= (G2-G1, R2-R1, NIR2-NIR1) (11) Where G2 - G1 is the difference of the green waveband between pre- and post-quake images, R2 - R1 is the difference of the red waveband between pre- and post-quake images, and NIR2 - NIR1 is the difference of the near-infrared waveband between pre- and post-quake images. The land use change types were categorized by the method of image subtraction, where the brightness value after hazard subtracts that before hazard. The three major change types are positive change, no change, www.iosrjournals.org
20 | Page
Use of Satellite images and fuzzy set theory in Landslide hazard Mapping in Central Zab basin and negative change. (1) Positive change is the differential brightness value greater than 0. Vegetation land cover has been substituted for the original bare land surface. In some areas vegetation work had been implemented and received a positive change value. (2) No change is the differential brightness value close to 0. These areas are not suffering from hazards such as undamaged buildings, unchanged vegetated areas and bare land. (3) Negative change is a differential brightness value less than 0 (Fig. 4).
Fig.4. SPOT satellite images at the central Zab basin landslide We select eight factors as s slope, aspect, litho logy, land use, distance to drainage, distance to road, distance to fault and precipitation namely. These factors divided to several classes that they had some landslides in their area. Extend area and frequency of landslides determined proportion and effect of each class to landslide occurs. Slope is an undeniable role to occur of landslide. Whatever increase slope, landslide is probability more occur, but this is not always. The result shows that class 30 -60% is the most susceptibility area than classes of slope and classes of all factors. Slope aspect has accelerated role in landslides event. Slope aspect often is controlling amount of water in the slopes and hillsides. The different parts of a hillside are affected by aspect unequally. the slope of the north had landslides more than other sides and half of the basin’s landslides occurred in the North classes and other classes have the lower proportion of landslides occurred. Lithology is also a mainly controlling parameter for landslide occurred area. This parameter showed a very robust influence on landslide event. Alluvial is sensitive rock to occur landslide. Almost, one third from landslides points, which occurred in the area, are in the alluvial class. Rock types are closely connected with lineaments so lineation has an effective role in a landslide occur. Lineament increase the fracture of rock; therefore, plenty of fracture affected to landslide occurrence. Then, Erodible rock is much more prone to landslides event whereas alluvial is more erosional and deeper weathering. Landuse showed strong relationship to landslides. Mane made forest are very sensitive for landslide occurred compare to other form of landuse. Although dry farm land has the most landslides among landuse classes, but the extent area is big than other classes particularly mane made forest classes. Second class pasture is the most of insensitive area in among landuse classes because it has a cover of plants. Drainage network is very important because of the cut slopes by the river, also amount of the moisture that river does within the slopes. The number of landslides is occurred in the class 0-200 m proximity was 11 landslides that it is from positive weight and contrast more than other classes. Road proximity is the most crucial factors in generate slope instability. Most of landslide occur chiefly were near to road (0-20 m), but area extend of this class is large, so contrast value is lower than another class (50-100 m), because it has plenty pixels compare to other classes. However, spatial relationship between landslides occurred, and road construction is very close especially in northwest of basin. Distance to fault is another factor in generate slope instability. Although distance to the fault is not as distance to the road from space effect for landslide occur, but in this case near class to lineament and fault have more landslides compare to other classes. About half of the landslides have occurred in Class 0-1000 m. precipitation has significant factor for landslide occurred area. It can be said with confidence, where rainfall is a low likelihood of landslides is very low. High and intense rainfall in the places that have other sensitive condition it can be triggered factor to accelerate landslides events. The class 700-800 mm plenty of landslides point, although the area extent class (700-800 mm) smaller than the class with higher precipitation.
www.iosrjournals.org
21 | Page
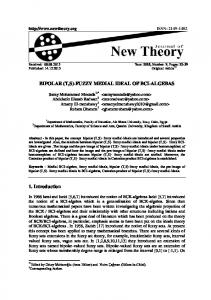
Use of Satellite images and fuzzy set theory in Landslide hazard Mapping in Central Zab basin Finally, In this study, 0.8 fuzzy gamma and 0.9 used for landslides zonation in the central zab basin (Fig.5 and Fig.6).
Fig.5. Application of fuzzy gamma ( = 0.8) operator
Fig.6. Application of fuzzy gamma ( = 0.9) operator 1.4.
Evaluation of operators using quality sum (QS) index If in the research, multi-hazard map is prepared, the researcher using the quality sum value, of more accurate maps and with more accuracy can be identified. Thus the zoning map with higher Qs have more accuracy [31].Fuzzy evaluation of different operators using the QS index based on the equation (12) was performed. 2 (12( n Qs Dr 1 * S i 1 Where: n: Number of risk categories S: Area ratio of each zone area to total area Dr: Area ratio in each category, the risk of landslide hazard zones for each area to total area ratio of total surface area of the landslide (Table.1 and Table. 2 ). Table 1. Percentage and area of landslide zonation map classes using the fuzzy gamma 0.8 Zoning classes % Of Landslide area Landslide () classes Area (hectares) classes (hectare) Low 113.23 54.10 55.76 42.54 Moderate 87.34 23.51 35.09 21.37 High 347.12 67.54 63.87 33.11 Very high 361.61 73.32 71.23 42.41 Table 2. Percentage and area of landslide zonation map classes using the fuzzy gamma 0.9 classes Area Landslide area Zoning classes % Of classes Landslide () (hectares) (hectare) Low 57.12 44.90 12.34 22.31 Moderate 148.51 66.13 23.45 32.87 High 276.13 72.76 57.71 61.09 Very high 389.88 89.23 81.14 71.88 In the fuzzy gamma operation, when λ is 1, the combination is the same as the fuzzy algebraic sum, and when λ is 0 the combination equals the fuzzy algebraic product. Judicious choice of λ produces output values that ensure a flexible compromise between the "increase" tendencies of the fuzzy algebraic sum and the "decrease" effects of the fuzzy algebraic product and the use of fuzzy gamma operation (0.8 and 0.9) in the generation of the landslide susceptibility map seems to be a reliable approach. www.iosrjournals.org
22 | Page
Use of Satellite images and fuzzy set theory in Landslide hazard Mapping in Central Zab basin V. Conclusion The fuzzy logic approach used in this paper provides a flexible method with which to include an expert’s opinion in developing an inference network. The variety of fuzzy operators enables the expert to examine different combinations and produce an intermediate map, or add any new data layer to the model and to test its affect on the final possibility map. Because the fuzzy membership functions assessed for factor maps were mainly extracted from the field data and satellite images, the procedure followed during the study should find locations of the known landslides. In order to control the performance of the produced susceptibility map, a comparison between the landslide susceptibility class zones on the map and the landslides was carried out. In the fuzzy algebraic operator to multiply the weight of each other's numbers tend towards zero. About 75 percent of the landslides in the classes are very low and low. In sum, Fuzzy pixels value to a very low accuracy in determining the willingness and ability to slip areas. The fuzzy gamma operator 0.8, the class is low to moderate in total 64% of the landslides occurred. Stories high and very high in total 75 percent of the landslides occurred. Gamma values assigned for each gamma combination operation play the most important role on the output fuzzy membership functions. Owing to the constant value for gamma, the outputs are essentially based on the fuzzy membership functions assessed to factor maps classes. The fuzzy gamma operator 0.9, approximately 72 percent of the landslides with large classes are very high. Fuzzy different operators by using the QS index showed that the fuzzy model gamma 0.9 was the most appropriate model to determine the ability of in the central zab basin. This landslide susceptibility map can be used as a planning tool but would rather not be recommended for individual site specific evaluation. Areas within the high and very high susceptibility categories should require further study by engineering geologists before development to determine the extent of possibly unstable conditions.
VI.
Acknowledgements
We are thankful to the Department of Remote sensing in Universiti Teknologi Malaysia (UTM) and International Doctorial Fellowship (IDF), for providing the facilities for this investigation.
References [1]
[2] [3]
[4]
[5] [6] [7] [8]
[9] [10] [11] [12] [13] [14] [15] [16] [17] [18]
H. J. Siddle, D. B. Jones, and H. R. Payne, Development of a methodology for landslip potential mapping in the Rhonda Valley. In Slope Stability Engineering, Developments and applications, Proc. Int. Conf. On Slope Stability, Isle of Wight, 15-18 April (Ed. R. J. Chandler), Thomas Telford, 1991, 137-148. E.M. Lee, J. C. Doorkamp, D. Brunsden, and N.H. Noton, Ground movement in Ventnor, Isle of Wight. Research Contract No. PECD 7/1/272. A report by Geomorphological Services Ltd for the department of environment, 1991. J.N. Hutchinson, and M. P. Chandler, A preliminary landslide hazard zonation of the under cliff of the Isle of Wight. In Slope stability engineering, development and applications. Proc. Int. Conf. On Slope stability, Isle of Wight, 15-18 April (Ed. R. J. Chandler), Thomas Telford, 1991, 197-206. A.T. Moon, R. J. Olds, R. A. Wilson, and B. C. Burman, Debris flow zoning at Montrose, Victoria. In Landslides, Proc. Sixth Int. Symp. On Landslides, February, Christchurch, New Zealand. A.A. Balkema, Rotterdam, The Netherlands, Vol. 2, 1992, 10151022. G. C. Morgan, G.E. Rawlings, and J. C. Sobkowicz, Evaluating total risk to communities from large debris flows. In Geotechnique and natural hazards. Proc. Geohazards ’92 Symposium, BiTech Publishers, Canada, 1992, 225-236. E Leroi, Landslide hazard-Risk maps at different scales: objectives, tools and development. In Landslides, Proc. Int. Symp. On Landslides, Trondheim, 17-21 June (Ed. K. Senneset), 1996, 35-52. A Akgun, S. Dag, F. Bulut, Landslide susceptibility mapping for a landslide-prone area (Findikli, NE of Turkey) by likelihood frequency ratio and weighted linear combination models. Environment Geology, 54(6), 2007, 1127–1143. A Clerici Perego, S. Tellini, and C. Vescovi, A GIS-based automated procedure for landslide susceptibility mapping by the conditional analysis method: the Baganza valley case study (Italian Northern Apennines), Environment Geology 50, 2006, 941– 961. W.R. Jibson, L.H. Edwin and A.M. John, A method for producing digital probabilistic seismic landslide hazard maps, Engineering Geology, 58, 2000, 271–289. C Baeza, J. Corominas, Assessment of shallow landslide susceptibility by means of multivariate statistical techniques. Earth Surface Processes and Landforms 26, 2001, 1251–1263. A Clerici, S. Perego, C. Tellini, and P. Vescovi, A procedure for landslide susceptibility zonation by the conditional analysis method. Geomorphology, 48, 2002, 349–364. L Donati, M.C. Turrini, An objective method to rank the importance of the factors predisposing to landslides with the GIS methodology: application to an area of the Apennines (Valnerina; Perugia, Italy). Engineering Geology, 63, 2002, 277–289. S Lee, J. Choi, K. Min, Probabilistic landslide hazard mapping using GIS and remote sensing data at Boeun, Korea. International Journal of Remote Sensing, 25, 2004, 2037–2052. H.T. Gomez, T. Kavzoglu, Assessment of shallow landslide susceptibility using artificial neural networks in Jabonosa River Basin, Venezuela. Engineering Geology, 78(1–2), 2005, 11–27. M Xie, T. Esaki, and M. Cai, A time-space based approach for mapping rainfall-induced shallow landslide hazard. Environment Geology, 46, 2004, 840–850. A Pistocchi, L. Luzi, P. Napolitano, The use of predictive modeling techniques for optimal exploitation of spatial databases: a case study in landslide hazard mapping with expert system-like methods. Environment Geology, 41, 2002, 765–775. S Lee, B. Pradhan, Probabilistic landslide risk mapping at Penang Island, Malaysia. Journal of Earth System Science, 115(6), 2006,1–12. B Pradhan, S. Lee, Utilization of optical remote sensing data and GIS tools for regional landslide hazard analysis by using an artificial neural network model at Selangor, Malaysia. Earth Science Frontier 14(6), 2007, 143–152.
www.iosrjournals.org
23 | Page
Use of Satellite images and fuzzy set theory in Landslide hazard Mapping in Central Zab basin [19] [20] [21] [22] [23] [24] [25] [26] [27] [28] [29] [30] [31]
B Pradhan, S. Lee, Landslide risk analysis using artificial neural network model focusing on different training sites. International Journal of Physical Sciences 3(11), 2008, 1–15. S Khezri, S. Roostaei, and A.H. Rajaie, Evaluation and mass movement hazard zonation in central section of Zab basin by using Anabalagan method, Humanities science Journal (issue geography), Vol.38, 2006, 32-42 (In Persian). S Khezri, Discovery of the “Tuzhal” Cave from Geomorphological Aspect. The 2nd International Geography Symposium GEOMED, 2010, Turkey: Kemer. C.F. Chung, a A.G. Fabbri, Prediction models for landslide hazard zonation using a fuzzy set approach. In: Marchetti, M., Rivas, V. (eds), Geomorphology & Environmental Impact Assessment, Balkema Publishers, 2001, 31-47. P.V. Gorsevski, P.E. Gessler, P. Jankowski, Integrating a fuzzy kmeans classification and a Bayesian approach for spatial prediction of landslide hazard, Journal of Geographical Systems, 5(3), 2003, 223-251. M Ilanloo, A comparative study of fuzzy logic approach for landslide susceptibility mapping using GIS: An experience of Karaj dam basin in Iran, Procedia Social and Behavioral Sciences 19, 2011, 668–676. L.A. Zadeh, Fuzzy sets. Information and Control, 8, 1965, 338–253. Biswajeet Pradhan, Saro Lee, Manfred F. Buchroithner, 2009, Use of geospatial data and fuzzy algebraic operators to landslidehazard mapping, Applied Geomatics 1, 3-15 S Lee, Application and verification of fuzzy algebraic operators to landslide susceptibility mapping, Environment Geology, 52, 2007, 615–623. P.V. Gorsevski, P. Jankowski, P.E. Gessler, Heuristic approach for mapping landslide hazard integrating fuzzy logic with analytic hierarchy process, Control and Cybernetics, 35, 2006, 1-26. H Schernthanner, Fuzzy logic approach for landslide susceptibility mapping (Rio Blanco, Nicaragua). Thesis, Institute of Geography, NAWI, Paris Lodron University Salzburg, Msc 2005, 81- 94. M.K. Ridd, J.J. Liu, A comparison of four algorithms for change detection in an urban environment, Remote Sensing of Environment, 63, 1998, 95–100. M.D. Gee, Classification of landslide hazard zonation methods and a test of predictive capability, Landslides, Balkema, Rotterdam, 1991, 947- 952.
www.iosrjournals.org
24 | Page