229
Part. Part. Syst. Charact. 23 (2006) 229–236
Application of X-ray Microtomography and Image Processing to the Investigation of a Compacted Granular System Xiaowei Fu*, James A. Elliott*, A. Craig Bentham**, Bruno C. Hancock***, Ruth E. Cameron* (Received: 20 November 2005; accepted: 26 March 2006)
DOI: 10.1002/ppsc.200601054
Abstract This paper outlines a novel technique, based on modern desktop X-ray microtomography (XMT) and image processing, to visualize and quantitatively investigate powder packing and particle movement during compaction, which relate to materials properties and processing conditions of pharmaceutical tablet manufacture by compaction. This technique has been validated by direct comparison with measurements of particle shape and
size by Scanning Electron Microscopy (SEM), and the results are also consistent with predictions made by Discrete Element Method (DEM) computer simulations. The technique has the potential for further quantitative investigation of powder compaction in pharmaceutical powder blends containing multiple components with ranges of particle sizes and shapes.
Keywords: compaction, granular media, image processing, packing, X-ray tomography
1 Introduction Issues relating to powder packing, and the subsequent compaction of powders are of great importance to the pharmaceutical, food and powder metallurgy industries. In order to produce a uniform, high quality end product in large volumes, control of this process must be stringent and this requires a fundamental understanding of powder compaction, segregation and flow, which need to be directed during tablet manufacturing. Previous measurements of the structure of the granular systems have been carried out since the 1960s using a mechanical
*
Dr. X. Fu, Dr. J. A. Elliott, Dr. R. E. Cameron, Pfizer Institute for Pharmaceutical Materials Science, Department of Materials Science and Metallurgy, University of Cambridge, Pembroke Street, Cambridge, CB2 3QZ (UK). E-mail:
[email protected] ** Dr. A. C. Bentham, Pfizer Global R&D, Sandwich, Kent, CT13 9NJ (UK). *** Dr. B. C. Hancock, Pfizer Global R&D, Groton, Connecticut, 06340 (USA).
© 2006 WILEY-VCH Verlag GmbH & Co. KGaA, Weinheim
disassembly approach [1], followed by magnetic resonance imaging (MRI) [2], scanning confocal microscopy [3] and tomographic methods [4]. Among these techniques, the non-destructive tomography method is considered to be the best and most efficient tool for characterizing packing structures. With the recent development of synchrotron X-ray Microtomography (XMT), several studies have used modern third-generation synchrotron sources to investigate granular packing [5,6] and plastic displacement within metals during compression [7]. However, measurements with synchrotron XMT depend on access to beam time, highly specialized equipment and skilled beam-line scientists. Following the emergence of desktop XMT apparatus (such as those manufactured by e.g. SkyScan Ltd., Belgium), some recent studies have been reported on the usage of desktop XMT to characterize dense packing systems. Sinka et al. [8] have used X-ray microtomography to determine the density distributions within pharmaceutical tablets, and Yang and Fu [9] used XMT to characterize powder processing. However, their analysis of the XMT data was confined to the two-dimensional information acquired. In this study, we have extended the application of desktop XMT to powder characterization by introducing
http://www.ppsc-journal.com
230
Part. Part. Syst. Charact. 23 (2006) 229–236
image processing algorithms and custom-made experimental accessories. The work described in this paper represents the first step towards studying a realistic pharmaceutical powder blend, and work is currently in progress to extend the methods to more complex powder mixtures. It should be emphasized that these systems are not intended to correspond directly to formulations used in the pharmaceutical or powder metallurgy industries but, rather, they consist of materials with well-characterized particle size and shape distributions that lend themselves to quantitative analysis by XMT. The systems studied to-date include: glass ballotini, sugar, and spheronized microcrystalline cellulose (Celphere) with particle sizes ranging between 180–300 lm. In this work, all X-ray microtomography measurements were performed using a SkyScan 1072 High Resolution desktop XMT system. A voxel size of 5 lm was used for all reconstructions considered in this study, which is close to the maximum spatial resolution of the instrument. A 3D watershed-based image processing algorithm was employed in the quantitative analysis of images acquired by XMT in order to determine the shape, size and position of each individual 3D particle within a sample. The results were then validated by Scanning Electron Microscopy (SEM) observations, and also compared against predictions made by Discrete Element Method (DEM) computer simulations, which calculate the packing fractions and radial distribution functions (RDF). By using an in situ compaction rig, the 3D motions of a number of tracer particles were tracked by XMT and thus, the particles’ displacement within the packing system undergoing compaction was monitored.
2 Image Processing and Sphere Recognition The SkyScan XMT desktop system offers a maximum spatial resolution of several micrometers, which allows
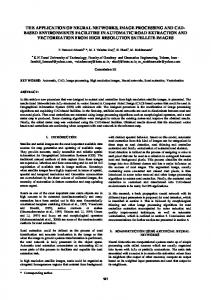
Fig. 1: (a) 2D sections and (b) 3D XMT reconstructed images showing randomly packed glass ballotini spheres with mean particle size of 200 ± 10 lm. The uniquely identified particles (in this case, spheres) are shown with different grayscale (c).
http://www.ppsc-journal.com
(a)
routine, non-destructive measurement of internal structure at the microscopic scale that is relevant to pharmaceutical powder systems. Apart from optimization of suitable parameters during image acquisition, extensive corrections of the resulting image are always necessary during image reconstruction so as to minimize a variety of artifacts, which include misalignment of sample rotation axis, beam hardening (which causes darkening at the surface of the sample) and ring artifacts for the rotating scanning system [10]. During post-image processing procedures, 3D maps were first generated by stacking a series of 2D layers with the nearest-neighbor interpolation algorithm [11], as illustrated in Figures 1a–b. The simple intensity threshold algorithms for identifying and separating individual particles do not work in 3D dense particle packings, where there may be many particles in contact and intensity variations within individual particles. In this paper, the method employed for separating the contacting surfaces between particles (mostly convex features in an image) is watershed segmentation [12], which relies on the fact that eroding the binary image will usually cause contacting features to separate before they disappear. The implementation of watershed segmentation using a Euclidean Distance Map (EDM) approach has been previously proved to be efficient, both in terms of speed and storage [13]. In the EDM method, only a single distance map image is required, and segmentation is constructed without iteration. In this study, the method has been extended for specific 3D case, where 3D segmentation is performed by searching 26 connecting neighbors for each voxel. The above image processing procedures are performed under Matlab® environment supplied by Matlab® image-processing toolbox, DIPlib (The Delft Image Processing library) and DIPimage [14]. The results of segmentation in 3D are illustrated in Figure 1c, in which all uniquely identified objects (in this case, spheroidal particles) are rendered using different grayscale.
(b)
(c)
© 2006 WILEY-VCH Verlag GmbH & Co. KGaA, Weinheim
231
Part. Part. Syst. Charact. 23 (2006) 229–236
3 Studies of Powder Packing In this section, we describe the use of desktop XMT to investigate the packing of two different granular systems, described in section 3.1. The size, shape and position of each individual particle are obtained via image processing on XMT images, and are then evaluated by comparing to those results obtained from SEM and DEM in section 3.2.
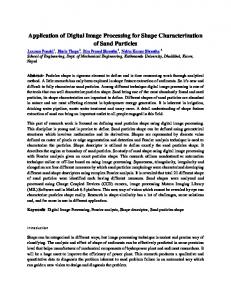
3.1 Materials and Methods Two types of glass ballotini spheres (Potters Industries, UK) were selected for characterization: mono-disperse spheres (200 ± 10 lm) having a relatively narrow size distribution, and poly-disperse spheres with size distribution ranging from 212 to 300 lm (Figure 2a). The two average particle sizes selected are representative of typical particle sizes found in pharmaceutical powder blends and allowed the ease of visualization of particles by XMT. For imaging experiments, glass spheres were poured into a borosilicate glass capillary tube of dia-
meter 3.0 mm using a paper funnel. The tubes were then filled to a height of approximately 2 cm before sealing with a Bunsen flame. Using this experimental set-up, the number of particles measured was about 2000, with both packing depth and width of 15–20 particles in each acquisition by XMT. Sugar spheres and cellulose spheres (Celphere CP-203, Asahi Kasei Corp, Japan) pharmaceutical samples of similar size distributions were also measured using the same method (Figure 2b). SEM analysis was performed to check the size distributions of poly-disperse spheres. A monolayer of particles was dispersed evenly on a planar substrate, and coated with a thin layer of gold. All analyses were performed using a JEOL JSM-820 Scanning Electron Microscope. Ten samples with approximately 2500 particles were analyzed in total. The 2D images obtained from the SEM observations were then digitized and presented to an image analysis program, ImagePro Plus™, which identified individual particles and recorded information about their morphology. For this hard sphere system, the size could be assessed accurately, although SEM is only capable of measuring the projected surface area, diameter or length. The XMT imaging was performed using a SkyScan 1072 Desktop machine, as described in section 1. The X-ray parameters were optimized with reference to systems analyzed. In this case, images were acquired at 50 kV using a 0.5 mm aluminum filter, a 4 lm pixel size, 0.23° angle step (i.e. 824 2D radiographs per 180° rotation) and 4 frame averages per acquired radiograph. Beam hardening corrections and ring artifact corrections were carried out during the cone-beam image reconstructions.
3.2 Results and Discussion (a)
(b)
Fig. 2: Morphology of (a) polydisperse glass ballotini spheres (mean size of 250 lm) and (b) Celphere (cellulose spheres) as observed by SEM.
© 2006 WILEY-VCH Verlag GmbH & Co. KGaA, Weinheim
Figure 1 illustrates the process of 3D XMT image creation based on a series of 2D reconstructed sections in the packing of mono-disperse glass spheres. The reconstructions for sugar spheres and cellulose spheres (Celphere) had a similar appearance with that of glass spheres (mean size of 250 lm) and thus were not presented here. After the image segmentation and object finding processes, parameters such as shape, size and position (center of mass) of each individual particle were recorded and all the 3D particles were “digitized” (a selection of which are listed in Table 1), on top of which, the size distributions, packing fractions and RDFs were computed. In order to validate the XMT results, the morphology and size distribution of identical samples were checked by SEM analysis. In this study, a sample of glass spheres with mean size 250 lm (shown in Figure 2a) was selected for XMT measurement, and also dispersed onto a
http://www.ppsc-journal.com
232
Part. Part. Syst. Charact. 23 (2006) 229–236
Table 1: Digital information of position, size and shape of a selection of Celphere granules acquired from XMT images. All units are in voxels (1 voxel=4×4×4 lm3). CMS.X, CMS.Y and CMS.Z stand for three coordinates of center of masses of particles in 3D space. Surface area is a count of the number of occurrences of a voxel in the region that is 6-way adjacent to a voxel not in the region. Volume is the calibrated volume of the 3D object. Diameter is calculated from the Volume of equivalent sphere. Sphericity is defined as the ratio of the Surface area of an equivalent sphere and the Sphericity is 1.0 for a perfect sphere. Particle Index
CMS.X (lm)
CMS.Y (lm)
CMS.Z (lm)
Surface Area (105 lm2)
Volume (106 lm3)
Diameter (lm)
Sphericity
1
1256.48
872.64
134.04
1.84
6.49
231.44
0.76
2
660.72
1069.24
133.68
1.74
6.02
225.64
0.78
3
173.24
917.00
157.04
1.85
6.79
234.96
0.82
4
980.04
1233.92
161.96
1.92
6.07
226.28
0.59
5
611.24
1319.60
156.32
1.77
5.64
220.82
0.65
6
710.12
278.88
173.52
1.76
6.21
228.01
0.79
7
510.48
476.84
168.72
1.62
5.54
219.60
0.82
8
790.60
756.04
172.84
1.80
6.42
230.58
0.80
9
355.80
1056.84
197.36
2.20
8.35
251.70
0.75
10
1363.52
240.04
168.92
1.32
4.06
197.87
0.80
number of planar substrates for SEM observation. The size of each individual particle was measured, and their cumulative volumes were computed. From Figure 3, it can be seen that the SEM results (in dash curve) were in good agreement with those obtained from the XMT technique (solid curve). We attribute the discrepancy between the two curves to the following reasons: (1) systematic errors during the segmentation process of XMT data, (2) a small degree of fracture/breakage in the glass samples which was not observed in the SEM, but detected by the presence of small particles in the XMT measurements, and (3) the loss of particles during sample preparation for SEM analysis. Nevertheless, the maximum deviation (around 5 lm) was acceptably small for a system with an average particle size of 250 lm. The Celphere system was analyzed in an identical way and
Cumulative vol/wt(%)
100 80 60 XMT SEM
40 20 0 180
200
220
240
260
280
300
320
Particle Size (µm) Fig. 3: Comparison of cumulative volumes obtained from SEM and XMT for sample of glass ballotini spheres with mean size 250 lm (shown in Figure 2a).
http://www.ppsc-journal.com
the results (not reproduced here) were rather similar, although there was a higher deviation between the two curves due to the difficulty in segmentation of Celphere particles, which had more complex shapes (as shown by the degree of sphericity in Table 1). Having validated the particle sizes and morphologies extracted from XMT against independent SEM measurements, we were able to calculate more detailed measures of the structure within the powder compact, such as the radial distribution function (RDF). Since there are few other experimental techniques that are able to measure the position of each particle in the compacted powder to a high degree of spatial accuracy as XMT, we compared these RDFs with theoretical predictions from DEM simulations. Through DEM simulations, we can calculate the positions, velocities and accelerations of all particles by solving Newton’s equations of motion, provided the effective force on each particle is known. The effective force on each particle is computed at each iteration by summing the force contributions from interparticle interactions (via contact force models) and external fields. Full computational details of the DEM simulations can be found in refs. [15,16]. In the “numerical experiments”, glass spheres were dropped onto a fixed bed of particles and allowed to settle under gravity until the average kinetic energy fell below 10–10 of the initial value (i.e. the particles came to rest). The simulations had 2-dimensional periodic boundary conditions [17]. The radial distribution function (RDF) is a particularly effective way of describing the average structure of particle packing systems [18]. The normalized RDF (G(r)) of mono-disperse glass spheres calculated from XMT
© 2006 WILEY-VCH Verlag GmbH & Co. KGaA, Weinheim
233
Part. Part. Syst. Charact. 23 (2006) 229–236
are plotted in Figure 4 (solid curve) and superimposed on those obtained from DEM (dashed curve). It can be clearly seen that the RDF for the structure packed under gravity measured by XMT was almost identical to the curve predicted by DEM simulations. The RDF indicated some typical features of loose random packing for hard spheres. For the mono-disperse system, the RDF had three peaks for inter-particle distances of less than 2r/, where r and represent inter-particle spacing and mean particle diameter respectively. The peaks at r/ = 1 and r/ = 2 represented the nearest neighbor contacts, and those contacts which formed with particle centers of mass separated by 2 particle diameters, respectively. The presence of the second peak at around r/ = 1.73 indicated some degree of shortrange close packing of spheres in a plane. The bulk packing fraction of mono-disperse glass spheres was calculated to be 60 ± 1% as measured by XMT, which produced a good agreement with that based on DEM calculation (59%) [17] and direct volume measurement of the experimental system by mercury porosimetry (60 ± 3%).
into a matrix of softer, less X-ray absorbent particles, consisting of sugar spheres, and following the displacement of the former as a function of the applied uniaxial pressure.
4.1 Materials and Methods A compaction rig, shown in Figure 5, was designed so that it could be placed inside the desktop tomography machine in order to scan the structure of the compacted powder. The rig consisted of a cylindrical polycarbonate die, with an internal diameter of 8 mm, and two metal punches whose position could be maintained with a locking mechanism. This enabled the powder to be compacted up to a certain pressure level before the whole system was locked, and then transferred into SkyScan machine for tomographical study. Such a quasi-static compression process will clearly neglect strain-rate dependent effects during compaction, but was found to be a good approximation powder compaction at low strain
1.4 1.2
XMT (mono-dispersed) DEM calculation
G(r)
1.0 0.8 0.6 0.4 0.2 0.0 0
1
2
3
4
r/ Fig. 4: Comparison of the RDFs of the monodisperse glass ballotini packing structure obtained from XMT (solid curve) and DEM simulation (dashed curve).
8 mm
4 Studies of Powder Compaction Since compaction is such an important process in the pharmaceutical industry, the understanding of particle displacement is essential for investigating the compaction behavior and mechanical properties of the tablets. Previous investigations on powder displacement have been carried out by numerical simulations such as Finite Element Method (FEM) [19], or experimental measurements such as Nuclear Magnetic Resonance (NMR) and acoustic ultrasound [20]. In this study, we have extended the application of desktop XMT to map the displacements of particles undergoing in situ quasi-static compression. This was achieved by the mixing of small amounts of “tracer” particles, consisting of glass spheres,
© 2006 WILEY-VCH Verlag GmbH & Co. KGaA, Weinheim
Screw Contacts Steel punch 60 mm
Polycarbonate Powder mixture Removable Steel Bottom
Fig. 5: Tablet compaction rig used for imaging powder compaction by XMT.
http://www.ppsc-journal.com
234
Part. Part. Syst. Charact. 23 (2006) 229–236
The powder mixture was mixed in a Turbula Mixer (Willy A. Bachofen AG, Basel, Switzerland) at 49 rpm for 15 minutes before pouring into the compaction rig. Following each pressure increment, the compacted powder was then transferred back into the SkyScan 1072 machine for XMT analysis. Images were recorded using 100 kV beam energy, a 1 mm aluminum filter, 0.23° step angle, 8.49 lm pixel size and an average of 4 frames per acquired radiograph.
4.2 Results and Discussion Using the image processing algorithms as described previously in Section 1, the glass tracer particles were successfully identified in 3D, as shown in Figure 7a–b. The
Compression axis
rates. The powder was compressed in discrete stages using a Universal Testing Machine (Instron 5567), with the powder arrangements at a range of compression pressures (0–10 kN) examined using XMT with a pressure increment of 2 kN. Four markers, with a diameter of 50 lm, made of lead were embedded into the polycarbonate die to establish a fixed coordinate system, which was crucial for matching the tracer particles before and after compaction. The sample was prepared using sugar spheres (whose morphology is shown in Figure 6a), and a small number of glass ballotini (