application of nanotechnology to geotechnical engineering has not received ...... 9. Several types of nanoparticles can be used for coating (US patents US ... Soaking of proppants in nanofluid may change the structure of stern layer ...... stabilizer, oil coating, and altering zeta potential [Byrne et al., 2009; Hibbeler et al., 2003; ...
Applications of Nanotechnology in Geotechnical Engineering by Xianglei Zheng
A Dissertation Presented in Partial Fulfillment of the Requirements for the Degree Doctor of Philosophy
Approved September 2016 by the Graduate Supervisory Committee: Jaewon Jang, Chair Claudia Zapata Edward Kavazanjian
ARIZONA STATE UNIVERSITY December 2016
ProQuest Number: 10243796
All rights reserved INFORMATION TO ALL USERS The quality of this reproduction is dependent upon the quality of the copy submitted. In the unlikely event that the author did not send a complete manuscript and there are missing pages, these will be noted. Also, if material had to be removed, a note will indicate the deletion.
ProQuest 10243796 Published by ProQuest LLC ( 2016 ). Copyright of the Dissertation is held by the Author. All rights reserved. This work is protected against unauthorized copying under Title 17, United States Code Microform Edition © ProQuest LLC. ProQuest LLC. 789 East Eisenhower Parkway P.O. Box 1346 Ann Arbor, MI 48106 - 1346
ABSTRACT Nanotechnology has been applied to many areas such as medicine, manufacturing, catalysis, food, cosmetics, and energy since the beginning 21st century. However, the application of nanotechnology to geotechnical engineering has not received much attention. This research explored the technical benefits and the feasibility of applying nanoparticles in geotechnical engineering. Specific studies were conducted by utilizing high-pressure devices, axisymmetric drop shape analysis (ADSA), microfluidics, time-lapse technology, Atomic Force Microscopy (AFM) to develop experiments. The effects of nanoparticle on modifying interfacial tension, wettability, viscosity, sweep efficiency and surface attraction forces were investigated. The results show that nanoparticles mixed in water can significantly reduce the interfacial tension of water in CO2 in the applications of nanofluidCO2 flow in sediments; nanoparticle stabilized foam can be applied to isolate contaminants from clean soils in groundwater/soil remediation, as well as in CO2 geological sequestration or enhanced oil/gas recovery to dramatically improve the sweep efficiency; nanoparticle coatings are capable to increase the surface adhesion force so as to capture migrating fine particles to help prevent clogging near wellbore or in granular filter in the applications of oil and gas recovery, geological CO2 sequestration, geothermal recovery, contaminant transport, groundwater flow, and stormwater management system.
i
DEDICATION
This dissertation is dedicated to my family, especially to my wife, Wei Yan, and my son, Aaron Zheng. Without their support, I could not have done this work.
ii
ACKNOWLEDGMENTS
I would like to thank the committee and all the people who take part in my research projects for the valuable supports and suggestions. I am very grateful to my advisor, Dr. Jaewon Jang, for his support and guidance throughout my five years’ research. I could not have finished my research without his help. I would like to thank Dr. Francois Perreault at Arizona State University, Dr. McElmurry at Wayne State University, and the Center for Solid State Science at Arizona State University for the support to use the nanoparticle and fine measurement devices. I would also like to thank Dr. Taesup Yun at Yonsei University, Seoul for the support on the analysis of CO2 sweep efficiency.
iii
TABLE OF CONTENTS Page LIST OF TABLES ................................................................................................................. vii LIST OF FIGURES .............................................................................................................. viii CHAPTER 1.
Introduction ................................................................................................................. 1 1.1.
Background and Objective .................................................................................. 1
1.2.
Organization of Dissertation ............................................................................... 2
2.
Literature Review........................................................................................................ 4
3.
Interfacial Tension and Contact Angle of CO2 –Water/Nanofluid-Quartz System .. 14 3.1.
Introduction ....................................................................................................... 14
3.2.
Experimental Details ......................................................................................... 18
3.2.1.
Material and Experimental Configuration. ............................................... 18
3.2.2.
Experimental Procedure ............................................................................ 19
3.3.
3.3.1.
IFT and CA of Pure Water-CO2-quartz System ....................................... 22
3.3.2.
Effects of Nanoparticles on IFT and CA. ................................................. 24
3.3.3.
Equilibration Time .................................................................................... 27
3.4. 4.
Results and Discussion ..................................................................................... 22
Conclusions ....................................................................................................... 28
Nanoparticles Stabilized Air Foam Used as a Barrier in Porous Media ................... 30 4.1.
Introduction ....................................................................................................... 30
4.2.
Background - Literature Review ....................................................................... 31
4.3.
Experimental Details ......................................................................................... 33 iv
CHAPTER
Page
4.3.1.
Nanoparticles and Surfactants................................................................... 33
4.3.2.
Foam Generation and Stability. ................................................................ 35
4.3.3.
Viscosity Measurement. ............................................................................ 35
4.3.4.
Breakthrough Pressure Measurement - Micromodel. ............................... 37
4.3.5.
Breakthrough Pressure and Hydraulic Conductivity - Sand Column ....... 38
4.4.
Results and Discussion ..................................................................................... 40
4.4.1.
Stability ..................................................................................................... 40
4.4.2.
Bubble Size Distribution ........................................................................... 43
4.4.3.
Effects of Time and Nanoparticle Concentration on Foam Viscosity. ..... 44
4.4.4.
Breakthrough Pressure in Foam-Saturated Micromodel........................... 46
4.4.5.
Breakthrough Pressure and Hydraulic Conductivity of Foam-filled Sand Columns. ................................................................................................... 46
4.5. 5.
Conclusions ....................................................................................................... 48
Effects of Nanoparticles on CO2 Invading Brine Saturated Microfluidic Chips ...... 50 5.1.
Introduction ....................................................................................................... 50
5.2.
Interfacial Tension and Contact Angle (wettability) ........................................ 55
5.2.1.
Experimental Details ................................................................................. 55
5.2.2.
Results and Analyses - Interfacial Tension, Contact Angle, and Wettability Change ...................................................................................................... 57
5.3.
Gaseous, Liquid, and Supercritical CO2 Injection ............................................ 59
5.3.1.
Experimental Details ................................................................................. 59
5.3.2.
Results and Analyses - Displacement Efficiency ..................................... 61 v
CHAPTER 5.4.
Experimental Details ................................................................................. 64
5.4.2.
Results and Analyses - Foam Viscosity and Displacement Efficiency .... 66
Conclusion ........................................................................................................ 68
Nanoparticle-coated Surface to Capture Migrating Fine Particles ........................... 70 6.1.
Introduction ....................................................................................................... 70
6.2.
Backgrounds – Fines Migration ........................................................................ 71
6.3.
Experimental Details ......................................................................................... 74
6.3.1.
Nanoparticles and Surface Coating Procedure ......................................... 74
6.3.2.
Surface Topography and Surface Force Measurement ............................. 75
6.3.3.
Sand Column Test for Fines Adsorption Efficiency ................................. 75
6.4.
Results and Analyses ........................................................................................ 77
6.4.1.
Surface Image and Surface Forces ............................................................ 77
6.4.2.
Fines Adsorption to the Nanoparticle-coated Sands ................................. 83
6.5. 7.
CO2 - water Foam Injection .............................................................................. 64
5.4.1.
5.5. 6.
Page
Conclusions ....................................................................................................... 87
Conclusion ................................................................................................................ 88 7.1.
Summaries......................................................................................................... 88
7.2.
Future Study ...................................................................................................... 90
References ......................................................................................................................... 92
vi
LIST OF TABLES Table
Page
2-1. The Effect of Nanoparticles on Interfacial Tension. (EG: Ethylene Glycol, G: Glycerol, SU: Sulphanole, S: Surfactant) .................................................................. 5 2-2. The Effect of Nanoparticles on Contact Angle. ......................................................... 6 2-3. The Effect of Nanoparticles on Thermal Conductivity. ............................................. 7 4-1. Fluids for Generating Air Foams. .............................................................................. 34 5-1. Physical and Interfacial Properties of Fluids Used in This Study. ............................ 54 6-1. The Volumetric Concentration of Nanoparticles in the Influent and Effluent. ......... 84
vii
LIST OF FIGURES Figure
Page
3-1. IFT and CA for Fluid-liquid-substrate System. ......................................................... 16 3-2. Experimental Configuration for IFT and CA Tests at High-pressures. ..................... 19 3-3. IFT and CA of Water Pressurized with CO2.. ........................................................... 22 3-4. IFT and CA of Pure Water and Nanofluids Pressurized with CO2. .......................... 25 3-5. The Effect of Nanoparticle Concentration on IFT..................................................... 26 3-6. Equilibration Time for Al2O3 Nanofluid. .................................................................. 28 4-1. Experimental Configurations of Viscosity and Breakthrough Pressure Measurement. .................................................................................................................................. 39 4-2. Foam Stability as a Function of Time. ...................................................................... 41 4-3. Coalescence of Air Bubbles In between Two Microscope Slides. ............................ 42 4-4. Properties of Foam as a Function of Time. ............................................................... 45 4-5. Breakthrough Pressure and Hydraulic Conductivity of Sand Filled with Foam. (estimated foam saturation ~92%). .......................................................................... 47 5-1. Fluid Invasion Pattern: Displacement Boundary and Efficiency. ............................. 53 5-2. A Brine Droplet on a Quartz Substrate Surrounded by CO2. .................................... 58 5-3. Experimental Configurations for CO2 Invasion into a Brine-saturated Microfluidic Chip. ......................................................................................................................... 60 5-4. Distribution of CO2 and Saline Water (blue) in the Microfluidic Chip after CO2 Breakthrough............................................................................................................ 62 5-5. The Saturation of CO2 in the Microfluidic Chip. ...................................................... 63
viii
Figure
Page
5-6. Experimental Configurations for Nanoparticle-stabilized CO2-water Foam Generation and Foam Invasion into a Brine-saturated Microfluidic Chip. ............. 65 5-7. The Invasion of CO2-water Foam into a Brine-saturated Microfluidic Chip. .......... 67 6-1. Experimental Configuration of Sand Column Test for Fines Adsorption. ................ 76 6-2. Surface Topology Obtained by AFM for Clean and Nanoparticle-coated Surfaces. 78 6-3. Force Profiles Measured between the Surface and the Tip of AFM Probe. .............. 79 6-4. Adhesion Forces Measured in Air. ............................................................................ 81 6-5. Attraction Forces and Adhesion Forces in Air and Water......................................... 82 6-6. Particle Size Distribution of the Kaolinite in the Influent (black), and 1st (red), 2nd (blue), and 3rd (green) Effluents. .............................................................................. 85 6-7. Fines Adsorption Efficiency of the Clean and Nanoparticle-coated Sand Columns. 86
ix
1. Introduction
1.1. Background and Objective Nanotechnology has been rapidly developing during the past two decades. National Nanotechnology Initiative (NNI) in 2007 defined the term “nanotechnology” as the understanding and control of matter at dimensions of roughly 1 to 100 nanometers, where unique phenomena enable novel applications. In 2000, the US government recognized that “nanotechnology can have a profound impact on our economy and society in the early 21st century, perhaps comparable to that of information technology or of cellular, genetic and molecular biology”. Since then, research on nanotechnology boomed in many fields such as medicine, manufacturing, catalysis, food, energy, and cosmetics. Up to date, great benefits have been obtained from the nanotechnology applications. For example, nanotechnology has been applied to diagnose disease and treat different cancers in medicine. There are over 50 cancer-targeting drugs based on nanotechnology have been in clinical trials in the United States [Roco et al., 2011]. Nanoscale semiconductor processors and memories have been widely used in electronic devices [S K Kim et al., 2010]. Food industry utilizes nanoparticles as antimicrobial food packaging materials to keep food fresh and extend the storage time [Rashidi and Khosravi-Darani, 2011]. Around 30–40% of the U.S. oil and chemical industries deal with nanostructured materials [Roco et al., 2011]. However, the application of nanotechnology in geotechnical engineering has not received much attention. Nanoparticles can be used to modify the properties of fluids and sediment in many applications such as CO2 geological sequestration, oil/gas-water multiphase flow in porous media, non-aqueous phase liquid (NAPL) remediation in soil, 1
the mitigation strategy for fines migration, and deep geothermal recovery. For example, nanoparticles are able to modify fluid flow, interfacial tension, viscosity, wettability, pore size distribution, which are key factors in many applications. Ordinarily, flowrate is the only factor that can be controlled in operation. Sometimes, alkaline and surfactants are applied to modify the interfacial tension and wettability to improve the productivity in petroleum engineering. However, the surfactants are ineffective in modifying the surface properties under harsh conditions such as high pressure and temperature conditions. Nanoparticles, on the contrast, can stably modify the properties under harsh environment, which will bring more benefits. The objective of this research is to explore the technical feasibility of nanoparticle application to geotechnical engineering. In this study, the effects of nanoparticles on the modification of interfacial tension, wettability, viscosity, and the surface attraction force will be investigated for the applications to groundwater and soil remediation, CO2 geological sequestration, fines migration, and enhanced oil/gas recovery.
1.2. Organization of Dissertation This research puts the emphasis on the fluid and sediment surface modification by nanoparticles and the applications to Geotechnical engineering. Specific studies in each chapter are summarized below. Chapter 2 documents the previous studies on nanotechnology that potentially benefit to the geotechnical engineering projects. Chapter 3 reports the effects of nanoparticles on interfacial tension and contact angle in a CO2-nanofluids-quartz system. The interfacial tension and contact angle are measured within a high-pressure resistant device at the equilibrium condition. 2
Chapter 4 studies the nanoparticle-stabilized air-water foams and the effects on the breakthrough pressure and hydraulic conductivity of a porous medium. Several types of nanoparticles are investigated. This chapter investigates the stability and viscosity of nanoparticle-stabilized air-water foam and explores the applications in groundwater/soil remediation. Chapter 5 investigates the CO2 injection efficiency into a brine-saturated microfluidic chip based on the techniques developed in the Chapter 4 and the improvement by the presence of nanoparticles, for the potential application to geological CO2 sequestration, CO2-enhanced oil recovery, and CH4-CO2 replacement in gas hydrate reservoir. Chapter 6 discusses the effects of fines fixation by nanoparticle-coated sand columns. The adhesion force and attraction force of nanoparticle-coated surfaces are measured, and a core-scale experiment is performed for the fines adsorption efficiency. The results help better understand the mechanism of fines fixation by porous media. Chapter 7 summarized the main points of the specific studies and suggests the future studies.
3
2. Literature Review
Nanoparticles are around two orders of magnitude smaller than colloid particles. Due to the small size, nanoparticles can migrate through pore throat in reservoir sediments [Tiantian Zhang et al., 2009b]. And nanoparticles can be functionalized to have specific mechanical, thermal, electrical, optical, magnetic, and chemical properties [Krishnamoorti, 2006]. Nanoparticles have been studied for applications such as (1) modification of interfacial tension (IFT), contact angle (CA), viscosity, and thermal conductivity [H Fan and Striolo, 2012; Maghzi et al., 2011; 2013; Rana et al., 2012; L Q Wang and Fan, 2011], (2) fixation of migrating fine particles by coating proppants’ surface [Masoudeh Ahmadi et al., 2011; Ali Habibi et al., 2011; Tianping Huang et al., 2008], (3) stabilization of emulsion and foam [Adkins et al., 2010b; Binks et al., 2008; DiCarlo et al., 2011; Nguyen et al., 2014], and (4) fluid mobility control for better sweeping efficiency [T P Huang and Clark, 2015; Ponnapati et al., 2011; Zeyghami et al., 2014]. Nanoparticles in fluid alter IFT and CA as shown in Table 2-1 and Table 2-2. As the concentration of nanoparticle in fluid increases, the IFT decreases. At a given particle weight concentration, IFT of the fluid including smaller size nanoparticles is lower than that of the fluid including bigger size of nanoparticles. Possible reason of the reduction in IFT is the alignment of nanoparticles at the interface. Hydrophobic nanoparticles make the interface to curve towards the water [Aminzadeh et al., 2012; Binks and Horozov, 2006; T. Zhang et al., 2009].
Coating is an efficient way to change the surface wettability. The development of 4
nanotechnology provides a convenient and effective way for the coating. The coating layer can be completed by spraying [Ogihara et al., 2015; Y F Zhang et al., 2014], plasma irradiation [Park et al., 2013; Takata et al., 2009], boiling induced precipitation [Hegde et al., 2012], etc. Super hydrophilic and super hydrophobic surfaces have been created by coating a layer of nanoparticles on solid surfaces [Fleming and Zou, 2013; Ogihara et al., 2015; Weng et al., 2014; Yang et al., 2012]. These show the high effectiveness of wettability altering by nanotechnology.
Table 2-1. The Effect of Nanoparticles on Interfacial Tension. (EG: Ethylene Glycol, G: Glycerol, SU: Sulphanole, S: Surfactant) Nanoparticle Configuration
Surface tension (mN/m) With nanoparticle
Temp .
Reference
Concen.
Without nanoparticle
15
0.1v%
72.5
64
25°C
TiO2
15
0.1v%
52
36
25°C
Murshed et al. [2008]
EG/G - Air
ZnO
60
3v%
S
1.07×S
-
Water - Air
CuO
30
8v% 4v%
72
38 51
25°C
Water - Air
CuO
50
3w%
71.2
59.8
30°C
Water - Air
Bi2Te3
2.5 10.4
0.318w% 0.318w%
72
48 70
-
Water - Air
Gold
5
0.0218w%
72.38
65.17
-
Water - Air
Laponite
20~30
2w%
73.6
40.97
-
SU - Oil
light nonferrous metal
90~110
0.001w%
10.9~ 31.4
1.09~ 9.2
-
Type
Size (nm)
Water - Air
TiO2
Water - Oil
Moosavi et al. [2010] Pantzali et al. [2009] G-S Wang and Bao [2009] Vafaei et al. [2009] Vafaei and Wen [2011] Chen et al. [2011] Suleimanov et al. [2011]
Nanoparticles can adsorb on mineral surface to change the wettability of the pore walls, which affects the pattern of water and gas flow in reservoir [B Ju et al., 2002]. The adsorption of lipophobic and hydrophilic polysilicon nanoparticles (LHPN) on the pore walls change the wettability of grain surface from oil-wet to water-wet. This wettability
5
alteration could result in the increase of water-flood sweep efficiency [B S Ju and Fan, 2009].
Table 2-2. The Effect of Nanoparticles on Contact Angle. Configuration
Type
Water on glass Water on silicon wafer
Bi2Te3
Water on copper
Carbon nanotube
Water on Si substrates
IO
Oil + SU 0.05w% on silica sand
nonferrous metal
Nanoparticle Size (nm) 2.5 10.4 2.5 10.4 φ15*10 000 14±5 87±6
Concen. 0.318w% 0.318w% 0.318w% 0.318w% 1v%
-
Contact angle (°) Without With nanoparticle nanoparticle 41.5 44.5 31 43 106 77 97.2 60 24 -
210±5 620±4 90~110
50
Vol.
10μl
Vafaei et al. [2006]
0.7μl 0.5μl
H S Xue et al. [2006]
-
Munshi et al. [2008]
-
Suleimanov et al. [2011]
57 67 0.001w%
23.4
19.1~ 23.4
Reference
In reservoir, the presence of oil can change surface wetting properties if the pore surface was originally saturated by water. [Abdallah et al., 2007]. A spectrum of wetting conditions was obtained by oil-aging method [Jadhunandan and Morrow, 1995], the aging process needs higher temperature (80℃) and longer time (more than 10 days). A layer of nano-biomaterial coating that changed the wettability of shale rock and thus improved the recovery efficiency has been observed [Mohebbifar et al., 2015]. Several studies [Dehghan et al., 2010; Jadhunandan and Morrow, 1995; Maghzi et al., 2011; Meybodi et al., 2011] have reported that the change of wettability has impact on the displacement efficiency, residual oil saturation and irreducible water saturation.
Some studies [Maghzi et al., 2012; Mohebbifar et al., 2015] use nanofluid to alter the wettability of reservoir and increase the oil recovery. The nanofluid flooding tests [Hendraningrat and Torsaeter, 2014; Maghzi et al., 2012] reveal a significant increment 6
of oil recovery with the existence of nanoparticles due to wettability change as well as interfacial tension reduction. Oil in water emulsion or water in oil emulsion may be created by snap-off mechanism[Roof, 1970] when inject oil and water alternately. The improvement of oil recovery with prepared emulsion has been approved [Son et al., 2014; Tiantian Zhang et al., 2009a].
Table 2-3. The Effect of Nanoparticles on Thermal Conductivity. Base fluid
Type
Water
TiO2
Water
Water
Nanoparticle Size (nm) Concen. 1v%~ 4v% 21 1v%~ 4v%
Al2O3
Al2O3
120
40-50
1v%~ 4v% 1v%~ 4v% 3.7v%~ 9.3% 3.7v%~ 9.3%
Thermal conductivity (W/(m knf kb/knf 0.64~ 1.016~ 0.63 0.68 1.079 kb
0.65 0.63 0.65 -
0.67~ 0.73
1.031~ 1.123
0.650~ 0.68 0.67~ 0.73 0.6631~ 0.7241 0.707~ 0.7743
1.032~ 1.079 1.031~ 1.123 1.06~ 1.16 1.07~ 1.18
K)) Temp.
Reference
30 °C 60 °C 30 °C
Yiamsawas d et al. [2012]
60 °C 35 °C 65 °C
Barbes et al. [2013]
Metal-type nanoparticles are frequently used to increase thermal conductivity of fluids. Table 2-3 includes thermal conductivity results obtained by using water as a base fluid. Data shows even small volume fraction of nanoparticles in fluid can increase thermal conductivity up to 20%. Masuda et al. [1993] extensively compiles experimental data on thermal conductivity of nanofluid. Some data shows 40% thermal conductivity increase using just 8 vol% of nanoparticles. The suggested reasons for thermal conductivity increase include (1) nanoparticle Brownian motion, (2) Brownian-motion-induced convection, (3) liquid layering at the liquid-particle interface, and (4) nanoparticle cluster/aggregate [J Fan and Wang, 2011].
7
In addition, the nanoparticles adsorbed (or coated) on the mineral surface can capture formation fines to prevent fines migration and clogging, so as to maintain hydraulic conductivity [Ali Habibi et al., 2011; Tianping Huang et al., 2008; Ogolo et al., 2012].
Fluid flow through porous media is inherently associated with the migration of fine particles. Colloidal and hydrodynamic forces govern the detachment of fine particles from pore wall. The migration of fine particles and ensuing clogging is the main reason of decreasing flow rate through in porous media. Coating of nanoparticles on the surface of coarse grains can be a promising method to prevent fines’ migration. The effect of coating methods, nanoparticle types, and nanoparticle concentration on preventing fines ’ migration is not fully explored. The quantitative capacity to capture migrating fines is not well known.
Among many remediation methods for fines clogging, the coating of nanoparticles on surfaces is a promising method to prevent fines migration [T. Huang et al., 2008]. Nanoparticles are coated on proppants’ surface in order to capture fines at the end of fracture openings and prevent fines migration into a wellbore. Nanoparticles can be adsorbed on proppants’ surface while nanoparticles and proppants are pumped down through a wellbore, and the coating is thought to strengthen the attraction force between fines and surfaces. By coating proppants’ surface with nanoparticles, the diffuse double layer repulsion and London-van der Waals attraction can be changed so that the attraction forces increases [M. Ahmadi et al., 2011].
8
Several types of nanoparticles can be used for coating (US patents US 7721803B2 and 8397812B2). Ahmadi et al. [2013] studied the fines adsorption on MgO nanoparticlecoated glass beads and found that the adsorption efficiency was improved by 85% at MgO concentration of 0.2% under the injection rate of 0.42 cc/min, compared to the case of clean glass beads. The zeta potential was claimed to be the reason why nanoparticle coating has the capability of fixing fines. Arab et al. [2014] treated sand columns with five types of nanoparticles (γ-Al2O3, CuO, MgO, SiO2, and ZnO). Zeta potential of nanoparticle-coated glass beads was measured as surface charge. The results show that γ-Al2O3 treated sand column has the most adsorption efficiency, and the surface charge was increased dramatically. Although many attempts have been done on the correlation of fines fixation with zeta potential, the attraction force between nanoparticle-coated surface and fines is still vague. The force has to be obtained from the correlation between zeta potential and electrical force [D. Arab and P. Pourafshary, 2013].
The results of several studies that explored the effect of nanoparticle coating on the adsorption of fines on proppants’ surface are summarized below.
The amount of nanoparticles used for coating. For in-situ application, the weight of nanoparticles mixed in carrier fluid ranges from 6kg per 1000liters of fluid to 60kg per 1000liters of fluid [T Huang et al., 2013], and 1gallon of nanoparticles is used for 1000lb of proppants [Belcher et al., 2010]. The weight percent of nanoparticle in laboratory experiments ranges from 0.05 to 0.2wt% of the proppants’ weight [Belcher et al., 2010; A. Habibi et al., 2011] .
9
Nanoparticle type. Magnesium oxide (MgO), silica (SiO2), aluminum oxide (Al2O3) are used for laboratory experiment [M. Ahmadi et al., 2011; A. Habibi et al., 2011].
Proppant type. Silica sands and glass beads (420~590μm) are used in laboratory experiments.
Coating methods. (1) Dry nanoparticle power is mixed with dry proppants, or (2) proppants are soaked in nanofluid (fluid including nanoparticles) for more than 24 hours. Soaking of proppants in nanofluid may change the structure of stern layer that affects the trend of zeta potential across the distances of separation [M. Ahmadi et al., 2011].
Adsorption efficiency. The nanoparticle coating obtained by using MgO nanofluid of 0.1wt.% concentration shows 61~79% of fines adsorption efficiency compared to the adsorption efficiency 57~69% of clean glass bead pack [M. Ahmadi et al., 2011; A. Habibi et al., 2011].
Nanoparticle coating methods that have been developed are summarized below.
Sol-gel process. This is the earliest developed method to prepare nanocomposite (hybrid) coatings. The coatings with desirable properties can be formed only through baking at high temperature. Organic-inorganic hybrid coatings have been extensively studies based on sol-gel process in recent years [Zhou et al., 2009]
Self-assembly method. There are three types of self-assembly methods: evaporation induced self-assembly (EISA) process, self-assembly nanophase particle (SNAP) coating process, and electrostatical self-assembly (ESSA) process. 10
Other methods. In thermal spray method, thermal input in flight melts nanoparticles, leading to high degree of particle deformation, whereas thermal input into the substrate fuses the particles together after deposition [Petrovicova et al., 2000; Schadler et al., 1997]. For mixing method, metal-type nanoparticles (copper oxide) are mixed with dry sand particles (quartz sand), and the mixture is shaken overnight, washed repeatedly with water to remove unattached nanoparticles, and dried at 400°C [Ben-Moshe et al., 2012]. In addition, boiling nanofluid with sediment particles can result in nanoparticle coating on sediment particle. Finally, coating agents such as oil, alcohol, glycol, and glycol ethers can help nanoparticle coating on proppants’ surface.
Among the developed coating methods, the soaking method does not require to change the temperature and pressure conditions of hydrate-bearing sediments which are generally saturated with saline water. Therefore, the injection of nanofluids into hydrate-bearing sediment prior to gas production via depressurization is thought be the most effective way to make nanoparticle-coating on sediment grain surface in economical way (No need to change temperature and pressure condition).
Apart from the advantages above, nanoparticles are utilized to stabilize foams. A foam is an aqueous dispersion of a gas in liquid, with thin films of liquid (called lamellae) separating the regions of gas. Foams are thermodynamically unstable, but the stability can be improved with surfactants [S Y Zhang et al., 2008], solid particles [Binks and Horozov, 2005], polymers [Alargova et al., 2004], and biopolymers [Engelhardt et al., 2012].
11
Compared with other stabilizing method, to stabilize foams with nanoparticles has the following advantages [Rodriguez et al., 2009; H. Yu et al., 2010].
Durability under high-temperature. Compared to surfactants that are
degradable under high-temperature condition, nanoparticles will be stable under harsh environmental condition of reservoirs. [D A Espinoza et al., 2010]
High adhesion energy. The long-term stability of nanoparticle-coated
droplets comes from high adhesion energy of nanoparticle adsorption at the interface between two liquids. The adsorbed nanoparticles at the interface neither desorb nor destabilize droplets even though there are no free nanoparticles in fluids. [Dickson et al., 2004; Melle et al., 2005]
Low retention of nanoparticles in reservoir rock. Properly coated-
nanoparticles do not adsorb on the surface of reservoir rocks. [Rodriguez Pin et al.; Haiyang Yu et al.]
Better CO2 solvation capability. Surfactants that have CO2-wet tail have
poor solvation force and ensuing weak stabilization. Nanoparticles have better CO2 solvation capability.[Dickson et al., 2004]
Versatile functionality. Nanoparticles can be functionalized for many
different purposes such as paramagnetic nanoparticles. These paramagnetic nanoparticles can be used to control fluid flow in porous media or detect the distribution of oil in pore spaces [Prodanovic et al.; Haiyang Yu et al.]. Possibly, the functionalized nanoparticles can be used to monitor the flow of injected CO2 or to detect any possible leakage in the long term.
12
Foams have been studied for enhanced oil/gas recovery (EOR) [Y Z Li et al., 2015; Mas-Hernandez et al., 2015; Nguyen et al., 2014; Yan et al., 2006], non-aqueous phase liquids (NAPLs) remediation [Lee et al., 2014; Mulligan and Wang, 2006; X W Wang et al., 2015], and CO2 geological storage [Vitoonkijvanich et al., 2015; Worthen et al., 2013c].
For the purpose of CO2 geological sequestration or CO2-enhanced oil recovery, foams dramatically increase the viscous number. Therefore, a stable high displacement efficiency can be achieved in oil recovery or CO2 sequestration to get higher recovery efficiency or bigger storage capacity.
In contrast with the spotlight on the CO2-water foam, rare attention is put on the nanoparticle stabilized air-water foam and its applications except for the firefighting [Vinogradov et al., 2016] and aquifer remediation [Hirasaki et al., 2003]. Due to the significant ability to decrease the mobility of flow, air foams could also be utilized to build a barrier between the contaminated soil and the clean ones. The contaminant could be insulated from the surrounding groundwater known as groundwater barrier. To achieve this purpose, a foam with long-term stability and suitable viscosity is critical.
13
3. Interfacial Tension and Contact Angle of CO2-Water/Nanofluid-Quartz System
3.1. Introduction Polymer surfactants are used to modify interface or fluid properties in many applications. However, polymer surfactants are unstable under high-pressure and hightemperature conditions found in deep sediments, and the efficiency of the surfactants is questionable [Rossen, 1996]. Compare with polymer surfactants, the modification with nanoparticles are generally stable under extreme conditions such as high-pressure, hightemperature, and high-salinity conditions that can be frequently encountered in deep ground and ocean sediments [Binks and Horozov, 2005]. Because of the advantages of using nanoparticles for modifying fluid and sediment properties, nanoparticles have a potential to be used in high-pressure CO2-involved applications such as geological CO2 sequestration, CO2 enhanced oil recovery, CO2-enhanced coal-bed methane recovery, and CH4-CO2 replacement in hydrate-bearing sediments. For the pure water droplet in CO2, IFT drops with the increasing CO2 pressure in the CO2-involved applications. Gibbs adsorption isotherm equation [Butt et al., 2003] suggests that the IFT decreases with the increasing amount of other substances at the interface. Spycher et al. [2003] studied the solubility of CO2 in water within a great span of temperature and pressure and found that the solubility of CO2 increases significantly in a gaseous state and then slowly in liquid state. The molecular dynamic simulation conducted by Nielsen et al. [2012] shows that CO2-water interaction decreases the IFT.
14
Nanoparticles alter the interface properties of fluid in air such as IFT and CA [Munshi et al., 2008; Murshed et al., 2008; Pantzali et al., 2009; Vafaei et al., 2009; Vafaei et al., 2006]. As the concentration of nanoparticle in fluid increases, the IFT decreases. At a given particle weight concentration, IFT of the fluid including smaller size nanoparticles is lower than that of the fluid including bigger size of nanoparticles. There are several explanations on the mechanism of IFT reduction due to nanoparticle inclusion. One of the possible several reasons for IFT reduction is (1) the alignment of nanoparticles at the interface between two liquids. Hydrophobic nanoparticles at the water interface make the interface to curve towards the water [Aminzadeh et al., 2012; Binks and Horozov, 2006; T. Zhang et al., 2009]. Another reason is (2) the increasing amount of surface potential by the electric double layer of the nanoparticles. Ions can affect similarly to surfactants at the charged liquid surfaces, and the IFT decreases with the amount of surface potential [Butt et al., 2003]. In addition, (3) Brownian motion of nanoparticles is also thought to be the reason of IFT reduction [Murshed et al., 2008]. The contact angle (CA) formed by two fluids resting on a substrate reflects the mutual interactions among the three neighboring phases (Figure 3-1a). The contact angle is expressed as function of IFTs between liquid-fluid TLF, liquid-substrate TLS, and fluidsubstrate TFS
𝑐𝑜𝑠𝜃 =
𝑇𝐿𝑆 − 𝑇𝐹𝑆 𝑇𝐿𝐹
15
(1)
As the IFT between liquid and fluid TLF decreases, the CA of wetting liquid decreases (Figure 3-1b) and the CA of non-wetting liquid increases (Figure 3-1c) if assumed that the IFTs between liquid and substrate TLS or fluid and substrate TFS are constant. In most situations, the three IFTs change together. (a)
(c)
(b)
Non-wetting liquid
Figure 3-1. IFT and CA for Fluid-liquid-substrate System. (a) IFTs between Liquid-Fluid TLF, Liquid-Substrate TLS, and Fluid-Substrate TFS, and CA θ. (b) Wetting liquid on a substrate. (c) Non-wetting liquid on a substrate. The dotted line shows the droplet geometry when TLF decreases. Carbon dioxide tends to de-wet surfaces, which results in contact angle (CA) variation after CO2 invades into water-saturated media. Therefore, the capillary pressure does not scale with the IFT due to this wettability change [Pierre Chiquet et al., 2005; Plug and Bruining, 2007]. In the simulations of CO2 invasion into porous media, the effect of IFT is importantly considered, whereas the effect of CA is overlooked [Polak et al., 2015; Zhu et al., 2015]. The de-wetting effect of CO2 has been reported by many researchers. P. Chiquet et al. [2007a] and Y Kim et al. [2012] believe that the de-wetting effect is a result of the low pH of water that saturated with CO2. The pH value was reported around 3 [Kaszuba et al., 2003; Schaeff and McGrail, 2004]. P. Chiquet et al. [2007a] assumed that there is a thin 16
water layer between the droplet and the solid surface. Normally, the thin water layer is stabilized by the electrostatic interactions between the mineral/brine and brine/CO2 interfaces. The low pH decreases the surface charge density [Marinova et al., 1996] and causes the interactions less effective to stabilize the thin water layer. Therefore, the surface becomes less water-wet. Y Kim et al. [2012] believe that the low pH inhibiting the deprotonation of silanol caused the de-wetting of silica surface. On the other hand, Tripp and Combes [1998] studied the supercritical CO2 as a solvent. They measured the infrared spectra of the silica surface submerged in supercritical CO2 and found that the absorbed water reduced dramatically, and that free silanol and absorbed CO2 increased. In addition to the de-wetting effect, the pinning effect is another phenomenon found in the CO2-water-mineral system. The pinning effect was always observed during the evaporation process of droplets [Larson, 2014; J G Zhang et al., 2015]. The water-airmineral contact triple line is fixed during the water is evaporating. The droplet becomes flatter and the CA decreases due to more water evaporates from the crown of the droplet than that from the edge. Nanoparticles mixed in fluid decrease the tension of interfaces such as between water and air, or oil and air under atmospheric pressure [H Fan and Striolo, 2012; Murshed et al., 2008]. However, to the authors’ best knowledge, the experimental measurement of IFT and CA of nanofluid (nanoparticle mixed in water) on a quartz substrate at high CO2 pressure condition (nanofluid-CO2-quartz system) is not available in literature. These values are relevant to geothermal recovery, geological CO2 sequestration, CO2 enhanced coal-bed methane recovery, CO2 enhanced oil recovery and CH4-CO2 replacement in 17
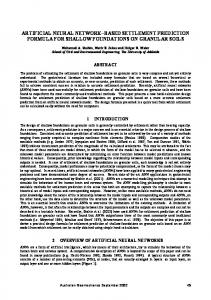
hydrate-bearing sediments. In this study, the effect of nanoparticles in water on IFT and CA under high CO 2 pressure (pressure range from 0MPa to 12MPa) is investigated. The effect of droplet generation and test procedure, wettability and IFT changes by nanoparticles, and CO2 dewetting effect are discussed. 3.2. Experimental Details 3.2.1. Material and Experimental Configuration. Nanoparticles used in this study to form nanofluids are aluminum oxide (Al2O3, Alfa Aesar, particle size: 45nm), zinc oxide (ZnO, Alfa Aesar, particle size: 70nm), magnesium oxide (MgO, US Research Nanomaterials, particle size: 50nm), and titanium dioxide (TiO2, US Research Nanomaterials, particle size: 30~50nm). The concentration of the nanofluids is 0.1wt %. A high-pressure resistant chamber is fabricated with stainless steel 316 for IFT and CA measurement (Figure 3-2a). The chamber has a transparent sapphire window that allows visual observation of droplets inside the chamber under high pressure. The chamber could be pressurized with CO2 (Airgas, Coleman grade with purity 99.99%) up to ~13MPa by a gas booster. Both pendent droplet and sessile droplet are generated in the stainless steel highpressure chamber. A stainless steel syringe (2.5ml, Analytical West) is used to inject fluid. The volume of a droplet is 10~30µl. A stainless steel tube (Outer diameter: 1.59mm, Inner diameter: 1.0mm) is used to generate the droplets. A quartz glass disc (McMaster-Carr, 18
made of 99.995% silicon dioxide) is used as a substrate. A picture of the droplet is taken through the sapphire window with a high-resolution camera (Nikon, D5200). The pressure and temperature inside the chamber are measured by a pressure transducer (Omega, PX309) and a K-type thermocouple and recorded by a data logger (Agilent, 34972A). The thermocouple is located close to the droplet for the accurate measurement of temperature near the interface. In order to minimize the effect of mass transfer through the interface between nanofluid and CO2 [Hebach et al., 2005], a small amount of water (~5mL) is placed at the bottom of the pressure chamber prior to CO2 pressurization to make watersaturated CO2.
Figure 3-2. Experimental Configuration for IFT and CA Tests at High-pressures. (a) Highpressure chamber made of stainless steel 316. A pressure-proof transparent sapphire window allows visual observation. (b) Peripheral devices for high-pressure testing. An image of fluid droplet is taken by a camera through the sapphire window. 3.2.2. Experimental Procedure Two pressurization methods, here called droplet-first and pressurization-first methods, are used. In the droplet-first method, a substrate is located in the chamber prior 19
to assembling the chamber. A small amount of water is then injected, followed by CO2 purge at a very small pressure for three minutes to replace the air inside the chamber. A droplet is generated through the capillary tube on the substrate and the pressure is then increased to the target pressure. Pictures are taken every ten minutes. The droplet equilibration process is monitored by measuring the IFT and volume of the droplet through the analysis of the pictures. If there are no changes in IFT and volume, the test proceeds to the next pressure stage. This droplet-first process allows us to get the equilibrium condition quickly, but the droplet may be affected by pinning effect [Bostwick and Steen, 2009]. The pressurization-first method pressurizes the chamber pressure prior to droplet generation. After a target pressure is reached, a droplet is generated on a substrate to measure IFT and CA. Once a measurement is completed for a given pressure level, the chamber is depressurized, then subjected to vacuum pressure, and pressurized again for the measurement under a higher pressure-level. The process eliminates the droplet pinning effect, but CO2 adsorbs on the substrate surface resulting in CO2 de-wetting effect [Y Kim et al., 2012]. During the time span of geological CO2 sequestration, the initially injected CO2 flows through water-saturated pores. However, some water may flow into CO2 saturated pores later due to local pressure change. There are many measurements for the IFT between pure water and CO2. Some of the values [D. Nicolas Espinoza and J. Carlos Santamarina, 2010a; S Kim and Santamarina, 2014] were measured by droplet-first method, and some others [S. Bachu and D. B. Bennion, 2009; D Y Yang et al., 2008] were measured by pressurization-first method. This study explores the IFT values measured by these two 20
procedures. The IFT and CA are measured at pressures 0.2MPa, 1MPa, 3MPa, 5MPa, 7MPa, 9MPa, and 12MPa. All measurements are performed at room temperature. P. Chiquet et al. [2007b] reported that there are major errors in the IFT calculation at the temperature below 343K and the pressure above 20MPa if the densities of CO2 and water are estimated by the pure material isopycnic equations rather than directly using the measured values. However, temperature change in the range of 300 to 383K at fixed pressure has a slight influence on the IFT [Nielsen et al., 2012]. Pictures are analyzed by using the axisymmetric drop shape analysis (ADSA) software to calculate IFT and CA [del Río and Neumann, 1997; Hoorfar and Neumann, 2004].
The theoretical Laplacian curve that has a minimum discrepancy with the
experimentally observed droplet profile is found by using the ADSA technique. The CA and IFT are determined based on this curve. In addition, radius curvature, surface area, and volume of the droplet also obtained [D Yang et al., 2008]. This technique needs the density difference between liquid and fluid for calculation. Here, the density of water was obtained by IAPWS-IF97 [Alvarez and Barbato, 2006; Wagner et al., 2008], and the density of CO2 was calculated with the equations developed by Duan and Sun [2003]. In the calculation of IFT for this study, the densities of water and CO2 are obtained from the pure water and pure CO2 at the corresponding pressures and temperatures. This may cause errors for the IFT values. Sutjiadi-Sia et al. [2008b] gives two examples of this error. However, the error is within 5% under the pressure and temperature conditions in this study based on the report from P. Chiquet et al. [2007a]. 21
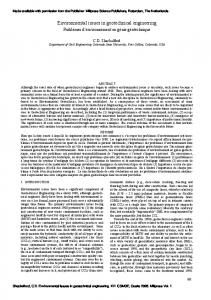
3.3. Results and Discussion 3.3.1. IFT and CA of Pure Water-CO2-quartz System The IFT between pure water and gaseous/liquid CO2 decreases from near 72mN/m with increasing CO2 pressure, and reaches an asymptotic value of ~20mN/m as shown in Figure 3-3(a). The results are consistent with the values found in literature [Stefan Bachu and D. B. Bennion, 2009; D. N. Espinoza and J. C. Santamarina, 2010; Nielsen et al., 2012; Sutjiadi-Sia et al., 2008a; b].
(a)
(b)
Figure 3-3. IFT and CA of Water Pressurized with CO2. (a) IFT obtained by pendent and sessile droplet method for the droplet-first and the pressurization-first conditions. Pendent droplet and sessile droplet are shown in the inset figure. (b) CA on glass surface under droplet-first (empty and crossed makers) and pressurization-first condition (solid markers). The solid triangular markers show the CA on new substrates, and the square markers show the CA on the used one. 22
There is a slight inconsistency of IFT under different pressurizing methods. The inconsistency is believed to result from the temperature and pressure variation. The results show that the test procedure affects slightly on IFT at the equilibrium condition. Values of IFT between distilled water and gaseous/liquid CO2 measured by the pendant droplet method and the sessile drop method are compared to investigate the effect of the droplet shapes. As shown in Figure 3-3(a), a high degree of consistency between pendent droplet and sessile droplet at equilibrium is obtained. This means neither droplet generation nor test procedure has an impact on IFT. The IFT should be the same at the same pressure and temperature conditions as long as the mass transfer between CO2 and water is at equilibrium. This study exhibits the de-wetting effect of CO2 in gaseous and liquid states. The effects of pressurization method and substrate on CA of pure water are evaluated as shown in Figure 3-3(b). The CA under the pressurization-first method has a big span from 46°to 140°. In contrast, the CA with droplet-first process shows a rise from 48°to 58°at the beginning, and then keep a constant value. The rising of CA with pressure under the pressurization-first process suggests a dewetting effect of gaseous and liquid CO2. Before water droplet was generated in the pressurization-first mode, the chamber is pressurized by CO2 to maintain a suitable pressure. The substrate surface has been coated by the pressurized CO2 during this process. The effects of the substrates on CA are examined for the pressurization-first method. The CAs of single-used-substrate method and the multi-new-substrate method are 23
compared. The used substrate is the silica plate that used for the droplet-first method and has been placed in the air for 12 days after the droplet-first experiment. The solid square symbols represent the CAs on the used substrates, and the triangular symbols show the CA on the new substrates (Figure 3-3). There is an obvious shift between the CAs on the new silica substrates and the used substrates. The de-wetting effect of CO2 is still effective after the substrate has been exposed to atmospheric condition for twelve days. The variation of the CAs is 40°~50°. In the droplet-first mode, however, some areas were covered by the droplet. Thus, there is no de-wetting effect at the place where covered by water. That confirmed the CO2 de-wetting effect from the opposite standpoint. Nevertheless, the liquid-fluid-solid triple contact line may be fixed by the pinning effect. In this water-CO2-quartz system, the waterCO2-quartz contact triple line is fixed during the water is diffusing into the CO2. There is more water being diffused into the dense CO2 from the crown of the droplet than that from the edge. Then, the droplet becomes flat, which results in the reduction in the contact angle. 3.3.2. Effects of Nanoparticles on IFT and CA. The experimental results show that the IFTs of both pure water and nanofluid droplets decrease with increasing pressure, and that the reduction rate with pressure in liquid CO2 are much smaller than that in gaseous CO2 as showed in Figure 3-3(a) and Figure 3-4(a). The effect of nanoparticles on the reduction of the IFT in gaseous CO2 is not obvious, however, a significant reduction occurred in high pressure CO2. The modifying efficiency by nanoparticles, the ratio of difference over the initial IFT, remains higher level under high pressure. The IFT of Al2O3 nanofluid was around 12mN/m at the pressure over 24
7MPa, which decreased by 40% from the pure water (around 20mN/m). The decreasing rates for ZnO, MgO and TiO2 are 20%, 35%, and 36%. The IFT decreases with the increasing nanoparticle concentration.
(a)
(b)
Figure 3-4. IFT and CA of Pure Water and Nanofluids Pressurized with CO2. (a) IFT. (b) CA. IFT decreases as pressure increases. The tested nanoparticles showed the capability of modifying IFT and surface wettability. The effect of nanoparticle concentration on the interfacial tension is studied at a given pressure condition. Figure 3-5 shows the trend of IFT of Al2O3 nanofluid in CO2 at 9MPa. The IFT decreases significantly with the concentration increases from 0.01wt% to 0.1wt%, but the increment is slight from 0.1wt% to 1wt%. The nanoparticles in this test are oxides, which are always negatively charged and 25
distributed at the interface. The ions that the nanoparticle introduced at the interface will decrease the IFT, and the IFT decreases with the increasing nanoparticle concentration at the interface.
Figure 3-5. The Effect of Nanoparticle Concentration on IFT. The interfacial tension value of Al2O3 nanofluid decreases as nanoparticle concentration increases. The value decreases significantly with concentration increases from 0.01wt% to 0.1wt%, then slightly from 0.1wt% to 1wt%. The wettability enhancement by nanoparticles is observed from Figure 3-4(b). The CAs of nanofluids are smaller than those of pure water under all pressures. The enhancement may be caused by the pinning effect and the settlement of nanoparticles on the substrate [Askounis et al., 2015; Vafaei and Wen, 2010]. The nanoparticles deposited on the quartz surface increases the surface charge and surface energy, and results in an augment of adhesion.
26
3.3.3. Equilibration Time The equilibration has an impact on the measurements. However, the equilibration time varies from 10min to 700min. Stable IFT and CA values can be obtained only after equilibrium. Figure 3-6 shows the values of IFT, CA, and volume evolution from 0.2 MPa to 12MPa. The equilibration time from 5MPa to 7MPa is much longer than other stages due to phase change.
(1)
(2)
(3)
(4)
(5)
27
(6)
(7)
Figure 3-6. Equilibration Time for Al2O3 Nanofluid. (1) CO2 pressure at 12MPa that is increased from 9MPa. The equilibration time is about 400min. (2) CO2 pressure at 9MPa that is increased from 7MPa. The equilibration time is about 30min. (3) CO2 pressure at 7MPa that is increased from 5MPa, phase change at 6.3MPa. The equilibration time is about 700min. (4) CO2 pressure at 5MPa that is increased from 3MPa. The equilibration time is about 60min. (5) CO2 pressure at 3MPa that increased from 1MPa. The equilibration time is about 20min. (6) CO2 pressure at 1MPa that is increased from 0.2MPa. The equilibration time is about 160min. (7) CO2 pressure at 0.2MPa that is increased from atmospheric pressure. The equilibration time is about 10min. 3.4. Conclusions This study examines the effects of droplet generation and test methods on the IFT and CA in a water-CO2-quartz system and explored the impact of nanoparticles on the system. The experiment results show that consistent IFT values are obtained at the same equilibrium condition, no matter how the droplet is generated or how the system reaches to equilibrium. The CA values, however, are affected by the test procedures including pressurization-first and droplet-first process. The CA measured by the pressurization-first process clearly shows the CO2 adsorption on the substrate, whereas CA measured by droplet-first process maintains a constant value. The results indicate a complex wetting condition in the water/nanofluids-CO2-mineral system, which will significantly impact on 28
the CO2-water/nanofluids multiphase flow. The interfacial tension of all tested fluids decreases with increasing pressure, and the decreasing rate in liquid CO2 is much smaller than in gaseous CO2. The tested nanofluids have smaller IFTs than those of pure water. The reduction of IFT by nanoparticles remains significant even under high-pressure condition. Among four tested nanoparticles, Al2O3 and TiO2 nanoparticles are effective in decreasing IFT. It is believed from the thermodynamic point of view that the molar concentration increase of CO2 and ions at the interface causes the IFT decrease with increasing pressure. A significant drop in CA was observed for all tested nanofluids at each pressure stage. The change of surface charge contributes to the CA alteration. The time to reach equilibrium condition differs depending on pressure level. The equilibration time from 5MPa to 7MPa is the longest due to the phase change, which is around 700 minutes.
29
4. Nanoparticles Stabilized Air Foam Used as a Barrier in Porous Media
4.1. Introduction A foam is an aqueous dispersion of a gas in a liquid, with thin films of liquid (called lamellae) separating gas bubbles. Foams are thermodynamically unstable, but the stability can be improved by surfactants [S Y Zhang et al., 2008], solid particles [Binks and Horozov, 2005], polymers [Alargova et al., 2004], and biopolymers [Engelhardt et al., 2012]. Compared with those foam stabilization methods, the use of nanoparticles for foam stabilization has several advantages such as durability under high-temperature [D A Espinoza et al., 2010], high adhesion energy at interface [Dickson et al., 2004; Melle et al., 2005], low retention of nanoparticles in reservoir rock [Rodriguez et al., 2009; H. Yu et al., 2010], high CO2 solvation capability [Dickson et al., 2004], and versatile functionality [Prodanović et al., 2010; H. Yu et al., 2010]. Stabilized foams have been used for the enhanced oil/gas recovery (EOR) [Y Z Li et al., 2015; Mas-Hernandez et al., 2015; Nguyen et al., 2014; Yan et al., 2006], the remediation of non-aqueous phase liquids (NAPLs) [Lee et al., 2014; Mulligan and Wang, 2006; X W Wang et al., 2015], and CO2 geological storage [Vitoonkijvanich et al., 2015; Worthen et al., 2013c]. The stabilized CO2-water foam can be used for geological CO2 sequestration and CO2-enhanced oil recovery. Due to the high viscosity of CO2-water foam, the high oil or water displacement efficiency can be achieved in oil production or geological CO2 sequestration, which enhances oil recovery rate or CO2 storage capacity. In addition, the nanoparticles injected for CO2 sequestration will remain in pore spaces 30
with CO2 for a long-time and may prevent a rapid catastrophic failure in case CO2 escapes through a crack or fault in CO2 reservoirs. In contrast with a lot of interests in the CO2-water foam study, there are not many studies on the nanoparticle stabilized air-water foams. Some examples include the use for the firefighting [Vinogradov et al., 2016] and aquifer remediation [Hirasaki et al., 2003]. Due to the ability to decrease the flow rate significantly, the air-water foam could be also utilized as a barrier to rapidly isolate contaminants in soils for temporary purpose. The contaminants can be isolated by a foam barrier to protect groundwater until other permanent treatment methods are applied. To achieve this purpose, a long-term stability and suitable viscosity of the air-water foam are important. In this study, the stability and viscosity of the air-water foam generated with the help of different types of nanoparticles are investigated. In addition, the breakthrough pressure is also measured as well as hydraulic conductivity in a core-scale experiment. 4.2. Background - Literature Review An interface exists at the boundary between two immiscible fluids such as wateroil, air-water, CO2-water, and CO2-oil. Depending on the phase of two fluids, the mixture can be called either emulsion in which liquid phase droplets are dispersed in another liquid fluid or foam in which gaseous phase droplets are dispersed in liquid fluid. Colloidal particles tend to adsorb at the interface [Binks and Horozov, 2006; Pickering, 1907; Ramsden, 1903] and reduce mass transfer through the interface, which generates a stabilized emulsion or foam. The stability of emulsion (called Pickering emulsion) is affected by particle size, shape, concentration, wettability, and particle-particle interactions 31
at the liquid-liquid interface [Adkins et al., 2007]. For example, particles that have a contact angle slightly less than 90°(water-wet) tend to stabilize oil droplets-in-water emulsion whereas particle that have a contact angle slightly higher than 90°(oil-wet) stabilize water droplets-in-oil emulsion [Golomb et al., 2004; Golomb et al., 2006]. The hydrophilic/CO2philic balance (HCB) of nanoparticles is a key factor that affects the stability of the CO2water foam [Worthen et al., 2013b]. The surfactants added in the fluid may change the wettability of particles due to the adsorption of surfactant molecules onto particle surfaces [Binks and Horozov, 2005; Binks et al., 2008]. It is found that the ability to generate stable foam is enhanced by using both surfactants and nanoparticles together [X Q Dong et al., 2010; S Y Li et al., 2016; Worthen et al., 2013a]. Nevertheless, some studies reported the destabilization of the surfactant-particle mixture [Alargova et al., 2004; Subramaniam et al., 2006]. The viscosity of foam is affected by many factors such as an injection pressure and flow rate of two fluids, pore size of the foam generator, nanoparticle concentration, and foam bubble size. The viscosity of the water - oil emulsion is inversely proportional to the droplet size [Pal, 1996]. The bubble size of the foam generated by a mixing method decreases with the increasing mixing speed, decreasing solution feeding rate, and cooling temperature [J U Kim et al., 2013]. The foam viscosity increases as the foam bubble size becomes more homogeneous, which results in a higher resistance to flow [Schramm and Wassmuth, 1994]. The smaller silica nanoparticles are found to have a greater ability in generating stabilized foams [I Kim et al., 2016].
32
A permeable reactive groundwater barrier has been studied to remove the contaminants in soil [Gao et al., 2015; Thiruverikatachari et al., 2008]. Foams have great advantages of large specific surface area and low interface slip velocity [Stevenson and ebrary Inc., 2012], which are preferable for the permeable reactive groundwater barriers. For the generation of air-water foam, air and water can be injected simultaneously through porous media. The vigorous agitation of the fluid in the air can also generate the air-water foam. Most researchers use the co-injection method in making CO2 foam at highpressure condition [Adkins et al., 2010a; H Wang and Chen, 2013; Worthen et al., 2013c]. However, the foam generation efficiency of the co-injection method is restricted by the flow rate and the size of porous media. Especially for the application in shallow surface (e.g., vertical barrier), the agitation method can make a large volume of foams that can be injected at the target depth without having clogging issues in porous foam generators. 4.3. Experimental Details 4.3.1. Nanoparticles and Surfactants. Two commercial silica nanoparticles (AEROSIL R974 and NYACOL DP9711) are used to stabilize the foam. The AEROSIL R974 (Cary Company) is a nanoparticle powder with the particle size of 5-50nm. The NYACOL DP9711 (NYACOL Nano Technologies, Inc.) is a nanoparticle suspension with the particle size of 20nm. Two types of surfactants are also used: sodium dodecyl sulfate SDS (purity≧99.0%, Sigma-Aldrich) and hexadecyltrimethylammonium bromide CTAB (purity~99%, Sigma-Aldrich). Four types of fluids are prepared by using the nanoparticles and the surfactants (Table 4-1). Ethanol (purity≧99.5%, Sigma-Aldrich) is utilized to wet the hydrophobic AEROSIL R974 33
nanoparticles. The contact angle of water on AEROSIL R974 is around 120°[Degussa, 1993]. Due to this high hydrophobicity of the nanoparticles, the nanoparticles may float on the water surface if ethanol is not added. To prepare (1) AEROSIL R974 nanofluid (2wt% of nanoparticles in water), ethanol is first added to wet the silica nanoparticles. After deionized (DI) water (Reverse Osmosis system plus Three Stage DI Filtration System, US Water Systems Company) is added to the solution, the solution is heated in a reflux set-up at around 80°C for 2hrs to evaporate the ethanol initially added to the solution. Later, the solution is stirred with a magnetic stirrer for 12hrs and in an ultrasound bath (Branson 2800) for 20min. The same procedure used for AEROSIL R974 solution is used again to prepare (2) AEROSIL R974+SDS solution. The only difference is that 0.1wt% SDS is added to the solution after heating. (3) CTAB solution and (4) CTAB+NYACOL DP9711 solution are obtained by adding DI water to commercial solutions. Table 4-1. Fluids for Generating Air Foams. Nanofluid AEROSIL R974 (1wt% and 0.5%) + ethanol (2wt%) SDS (0.1wt%) + AEROSIL R974 (1wt%) + ethanol (2wt%) CTAB (0.1wt%) CTAB (0.1wt%) + NYACOL DP9711 (1wt%)
Note: The 2wt% ethanol was utilized to wet the hydrophobic nanoparticles. The final concentration was less than 0.5% by heating the solution at 80℃. SDS: sodium dodecyl sulfate. CTAB: Hexadecyltrimethylammonium bromide.
34
4.3.2. Foam Generation and Stability. The Parr stirrer (Parr Instrument, Model 4563) mixes two fluids to generate the foam. The rotational speed of the stirrer is 1700rpm. The volume of the stirring chamber is 300mL. The air-nanofluid foam is generated by vigorously agitating a solution for 10min at the air pressure around 300kPa. Foams made from the four types of fluid by a stirring method are collected into vials. Pictures are taken by a camera (Nikon D5200) periodically to observe the foam stability in terms of a foam height. The volume fraction of gas in the generated foam is 0.75~0.85. The foam stability as a function of time is obtained by comparing the normalized foam height. The generated foam is also introduced in between two microscope slides (the distance between two slides is 200μm). Then, the stability of the bubbles in the foams is observed with a microscope (AmScope, IN300TC-10MA) and the bubble size distribution is obtained from time-lapse images by using ImageJ. 4.3.3. Viscosity Measurement. The nanofluid forming the most stable foam is selected from the previous foam stability test and is used to conduct a viscosity experiment. The viscosity of a foam is measured by measuring pressure difference between two ends of a stainless steel tube with a known length when a foam flows through the tube at a known flow rate (Figure 4-1a). A syringe pump (KD Scientific, 410P) is used to inject the foam. The inner diameter of the stainless steel tube is 0.533mm, and the length of the tube is 124cm. Two pressure transducers (Omega PX309) measure the pressures at two locations of the tube separated 35
by 41cm. The viscosity is calculated by dividing the shear stress (τ) with the shear rate (γ) [Adkins et al., 2010b], that was utilized by other researchers to study the CO2 foam viscosity [Worthen et al., 2013a; Worthen et al., 2013c; Z Xue et al., 2016; J J Yu et al., 2014]. η=τ/γ
(4-1)
The shear stress τ is determined by the shear force F and the area A parallel to the applied force vector: 𝐹
𝜏=𝐴=
∆𝑃(𝜋𝑅 2 ) 2𝜋𝑅𝐿
=
∆𝑃𝑅
(4-2)
2𝐿
The shear rate γ of a Newtonian fluid flowing within a pipe is determined:
𝛾=
4𝑣 𝑅
=
4
𝑄 𝜋𝑅2
𝑅
4Q
= πR3
(4-3)
The viscosity of foam can be calculated: 𝜏
𝜋 ∆𝑃𝑅 4
𝜂=𝛾=8∙
(4-4)
𝐿𝑄
In Equation 4, △P is the pressure difference measured by the two pressure transducers; R is the inner radius of the stainless steel capillary tube; L is the length of the tube; Q is the foam flow rate; v is the average flow velocity; η is the viscosity. The effect of time on the viscosity of foams is investigated for the AEROSIL R974 solutions with 0.5wt%, 1wt% and 2wt% nanoparticle concentration. The initially generated foams are introduced to several syringes and sealed for the viscosity measurement at 36
different time. The foam prepared and stored in each syringe is injected into the capillary tube for the viscosity measurement. 4.3.4. Breakthrough Pressure Measurement - Micromodel. The experimental configuration is shown in Figure 4-1b. A microfluidic chip (Micronit, Netherlands) has 377 grains with diameter of 800μm and the pore throat of the chip is 105μm (refer a similar experimental setup for foam flow [Géraud et al., 2016]). A stainless steel syringe can inject water or foam into the microfluidic chip. A high precision pressure transducer (Omegadyne PX329-002G5V) measures input pressure. A camera (Nikon D5200 with an AF-S Micro Nikkor lens) takes a picture of displacement pattern. Once the microfluidic chip is saturated with a foam, the pressure is increased slowly by injecting water through a syringe pump at a constant flow rate of 4μL/min. The breakthrough pressure PB is defined as the pressure of the water invading into the foam-saturated microfluidic chip when there occurs water percolation path from the input to the output port of the microfluidic chip. During the injection of water at a slow flow rate, the water pressure increases until the water percolation path is obtained. As soon as there is a water percolation, the water flows through the percolated channel, then, the water pressure decreases. Therefore, the maximum pressure difference between the input and output port of the microfluidic chip is called breakthrough pressure PB (shown in the inset figure of Figure 4-4b). As soon as the foams are generated from the 0.5wt% AEROSIL R974 solution for the previous viscosity measurement, the same foams are also injected into three identical 37
microfluidic chips for breakthrough pressure measurement. Then, the three chips are used for breakthrough pressure measurement on the 1st, 3rd, and the 7th day after the foam injection. 4.3.5. Breakthrough Pressure and Hydraulic Conductivity - Sand Column The graded Ottawa sands (Humboldt Mfg. Co.) are used for the column test. The specific gravity is 2.65. The effective diameter D10, D30, and D60 are 0.27mm, 0.35mm, and 0.46mm, respectively. The coefficient of uniformity is Cu=1.66, and coefficient of curvature is Cc=0.98. The sands (total weight 1150g) are compacted into a permeameter (Humboldt Mfg. Co.) that is 7.62cm in diameter and 15.0cm in length. Three permeameter cells filled with sands with the same porosity (36%) are prepared. The foam generated from the 0.5wt% AEROSIL R974 solution by using the Parr mixer is introduced to a water-saturated sand column through the bottom port of the permeameter. The weight of displaced water is used for the calculation of foam saturation. The foam injection is stopped when the foam flows out steadily from the outlet. The breakthrough pressure of a sand column is measured by injecting water at 0.8mL/min flow rate (Figure 4-1b). The breakthrough pressure of the first sand column is measured as soon as the foam is injected. The breakthrough pressures for the rest two sand columns are measured at four and seven days after the foam is injected. A falling-head test method is used to measure the hydraulic conductivity of the foam-filled sand columns after the foam breakthrough. The hydraulic conductivity of a clean sand column is measured before a foam is injected. The hydraulic conductivity of the 38
foam-filled sand columns is measured on the 1st, 4th, and the 7th day after the foam breakthrough.
(a)
(b)
Micromodel
Sand column
Figure 4-1. Experimental Configurations of Viscosity and Breakthrough Pressure Measurement. (a) Viscosity measurement. The inner diameter of the stainless steel tube is 0.51mm. (b) Breakthrough pressure measurement.
39
The breakthrough pressure of a sand column is measured by injecting water at 0.8mL/min flow rate (Figure 4-1b). The breakthrough pressure of the first sand column is measured as soon as the foam is injected. The breakthrough pressures for the rest two sand columns are measured at four and seven days after the foam is injected. A falling-head test method is used to measure the hydraulic conductivity of the foam-filled sand columns after the foam breakthrough. The hydraulic conductivity of a clean sand column is measured before a foam is injected. The hydraulic conductivity of the foam-filled sand columns is measured on the 1st, 4th, and 7th day after the foam breakthrough. 4.4. Results and Discussion 4.4.1. Stability Foam stability identified by the height of foams as a function of time is dependent on nanoparticle type and the presence of surfactants (Figure 4-2). The foam produced from the AEROSIL R974 solution has the highest stability among four types of solutions. The height of the foam generated from the AEROSIL R974 solution is maintained over 80% of the original height even after 17days. However, if the surfactant (0.1wt% of SDS) is added to the AEROSIL R974 solution, the foam stability is dramatically reduced. The foam height of the solution drops down to 10% of the initial height within 30min. It may be because the wettability of the nanoparticles in the AEROSIL R974 solution is modified to be strong hydrophilic due to the SDS surfactant adsorption onto the nanoparticle surface [Binks and Horozov, 2005; Binks et al., 2008]. Once the surface of nanoparticles becomes hydrophilic after the SDS surfactants are adsorbed on the nanoparticle surface, the foam stability 40
decreases.
(a)
(
a
(
b
)
(1)
(2)
(3)
(4)
(1)
(2)
(3)
(4)
(1)
(2)
(3)
(4)
)
(b)
Figure 4-2. Foam Stability as a Function of Time. (a) The flouid from left to right are (1) AEROSIL R974, (2) AEROSIL R974 with SDS, (3) NYACOL DP9711 with CTAB, and (4) CTAB solution. Pictures of foam taken at 5min (left), 3hrs (center), and 17days (right) after foam generation. (b) Foam height h normalized by the initial foam height h0. The stabilities of the foams made by CTAB solution and NYACOL DP9711+CTAB solution are similar: They are destabilized dramatically at time=10hrs after the foam generation. The foam made from NYACOL DP9711 solution is destabilized quickly as soon as it is generated; the result is not included in Figure 4-2. 41
(a)
0h (190)
3h (144)
9h (95)
21h (92)
(b)
Figure 4-3. Coalescence of Air Bubbles In between Two Microscope Slides. (a) Pictures of air bubble and bubble numbers at 0hr, 3hr, 9hr, and 21hr after foam generation. (b) Bubble size distribution at time=0hr, 3hr, 9hr, and 21hr. Note: the distance between two slides is 200μm. The viscosity of the foam is 11.7cP and the breakthrough pressure is 21.3kPa at time=0hr. 42
4.4.2. Bubble Size Distribution A very small amount of the foam generated from AEROSIL R974 solution is introduced in between two microscope slides. The initial bubble size of the foam ranges from 25μm to 350μm. Figure 4-3a shows the air bubbles as a function of time after the foam is generated. The bubble size distribution is shown in Figure 4-3b. The measured viscosity of the foam as soon as it is generated is η=11.7cP. The distance between two slides is d=200μm. Therefore, for the bubble whose radius is less than 100μm, the radius R is taken as measured Rm. For the bubble whose radius larger than R=100μm (The bubble should be squeezed in between two microscope slides), a radius of the bubble in spherical shape is calculated [Gaillard et al., 2015]:
3
4
1/3
𝑅 = (4𝜋 (2𝜋𝑑(𝑅𝑚 − 𝑑)2 + 𝜋 2 𝑑 2 (𝑅𝑚 − 𝑑) + 3 𝜋𝑑 3 ))
(4-5)
As shown in Figure 4-3b, initially the most frequent radius of bubbles is 50μm, and few bubbles larger than 300μm are also observed. The total number of bubbles is N=190 at the initial observation. At time=3hrs, the total number of bubbles decreases down to N=144, and the most frequent radius increases to around R=75μm. The maximum radius is R=340μm. At the time of 9hrs after the foam generation, the total number of bubbles is N=95 and the most frequent radius increases up to R~100μm. The maximum radius increases to R=370μm. This phenomenon can be explained by the Ostwald ripening effect in which larger bubbles continue to grow at the expenses of smaller bubbles. Based on the analysis in Figure 4-3, the size of bubbles smaller than R=100μm decreases and some of the small bubbles disappear, and bubbles bigger than R=100μm continue to grow in their sizes. And, at time=21hrs, the total number of bubbles reduces by only three (N=92), and 43
the most frequent radius is maintained at R=100μm. The maximum bubble radius is R=400μm. Here, two competing processes exist: Ostwald ripening effect (originating the mass transfer from small bubbles to large bubbles) and the existence of nanoparticles at the interface (impeding the mass transfer between the bubble and the surrounding fluid). Based on the observation, the reason why active Ostwald ripening process is observed for the first 9hrs may be because initially there could be high solubility gradient from small bubbles to large bubbles and this could overcome the effect of nanoparticles on preventing mass transfer, but later once the small bubbles are disappeared, the nanoparticles at the interface can slow down the mass transfer due to the reduced solubility gradient. 4.4.3. Effects of Time and Nanoparticle Concentration on Foam Viscosity. For the foam generated with the 0.5wt% solution, the viscosity measurement is repeated five times at time=0.2, 24, 72, 121, and 169hrs after the foam generation, and only one viscosity measurement is conducted for 1wt% and 2wt% solution at the same time condition. As shown in Figure 4-4a, the viscosity of the foam decreases with increasing time. For 0.5wt% solution, the viscosity decreases from η=27cP to η=7cP during the initial 72hrs, and thereafter it drops very slowly down to η=4.4cP at t=167hrs. The viscosities of the foams for 1wt% and 2wt% solution are higher than the viscosity of the foam for 0.5wt% solution at a given time condition. However, the difference in viscosities between 1wt% and 2wt% solutions is not clearly pronounced. The inner diameter of the stainless steel tube that are used for viscosity 44
measurement is 533µm and the maximum bubble diameter of the foam shown in Figure 43a is d=650micron, therefore, large bubble can plug fluid flow through the tube, which means that pressure drop along the tube is controlled by the friction between the large bubble and the wall. The effect of bubble size, liquid fraction, fluid velocity on the friction has been explored by Cantat [2013] .
(a)
(b) PB
Figure 4-4. Properties of Foam as a Function of Time. (a) Viscosity. (b) Breakthrough pressure PB. Inset figure shows one breakthrough pressure test result (water is injected into the micromodel at a constant rate of 4μL/min). Note that the same symbol denotes the foam made from the same batch.
45
4.4.4.
Breakthrough Pressure in Foam-Saturated Micromodel.
The breakthrough pressure for the foams generated from 0.5wt% AEROSIL R974 solution decreases with time. The breakthrough pressure is PB~30kPa initially, then decreases to PB~14kPa after three days, and PB~8kPa after seven days. The reduction in the viscosity and breakthrough pressure is a result of the foam degradation as a function of time. The viscosities of all foams decrease with time. The decreasing rate during the initial 72hrs is relatively high, and then the viscosities are maintained almost constant until 168hrs. This trend is also captured by the breakthrough pressure measurement. 4.4.5. Breakthrough Pressure and Hydraulic Conductivity of Foam-filled Sand Columns. Three sand columns with the same porosity n=0.36 are used for this test. The hydraulic conductivity of water-saturated sand column is k~0.46mm/s. The foam generated from 0.5wt% AEROSIL R974 solution is injected into each sand column. The breakthrough pressure is measured at time=0, 4, and 7days after the foam injection. Thereafter, the hydraulic conductivity is measured at time=0, 4, and 7days after the breakthrough. Figure 4-5 shows the breakthrough pressure and the hydraulic conductivity evolution after breakthrough. The breakthrough pressure decreases with increasing time that is also shown in the microfluidic chip test. The breakthrough pressure drops quickly during the first four days and then decreases slowly. Actual values of the breakthrough pressure of sand columns are smaller than those of the microfluidic chip. It is because (1) the size of pore throats is smaller for the microfluidic chip than the sand column (small 46
pore throat limits the mobility of gas bubble. Higher pressure is required for gas bubbles to pass through smaller pore throat), and (2) three-dimensional sand column may have heterogeneous pore size distribution, so that the water has a better chance to find the drainage path at lower water pressure.
Figure 4-5. Breakthrough Pressure and Hydraulic Conductivity of Sand Filled with Foam. (estimated foam saturation ~92%). (a) Breakthrough pressure. (b) Hydraulic conductivity after breakthrough. Note: the hydraulic conductivities of the clean sands are 0.22 mm/s (square), 0.73mm/s (triangle), and 0.43mm/s (circle), respectively. The porosity of the sand pack is 36%. 47
The hydraulic conductivity is measured at time=0, 4, and 7days after the water. The hydraulic conductivity of the foam-filled sand column is almost two orders of magnitude lower than that of the water-saturated sand column even after the water breakthrough. Due to this reduced hydraulic conductivity even after the water breakthrough, the stabilized foam could be used to control hydraulic conductivity for temporary method. 4.5. Conclusions Nanoparticle-stabilized air-water foams are generated from several nanoparticle and surfactant solutions by mixing method. The properties of foam and foam-filled microfluidic chips and sand columns are investigated. The foam generated from 0.5wt% AEROSIL R974 solution shows high stability: the normalized height of the foam is maintained over 80% of the initial height even after 17days. The analysis of bubble size distribution shows that the Ostwald ripening effect is observed during the initial stage. The viscosity of the foam is η=25cP initially and decreases down to η=4.4cP after one week. The foam generated with higher nanoparticle concentration shows higher viscosities, but there is no apparent difference between 1wt% and 2wt% solutions. Breakthrough pressures for the microfluidic chip and sand column decreases with increasing time since foam is injected. And, the hydraulic conductivity of the foam-filled sand columns right after the water breakthrough also increases with increasing time, but the values of the foam-filled sand columns are almost two orders of magnitude lower than the hydraulic conductivity of the water-saturated sand column. Based on the results, the
48
nanoparticle-stabilized foam could be applied to control groundwater flow for soil remediation. The results of this study show that there is a possibility of using nanoparticlestabilized air-water foam to prevent contaminant transport along with groundwater flow, but, further research considering different soil type, contaminant type, foam durability, and up-scaling technique from the lab to in-situ test is needed.
49
5. Effects of Nanoparticles on CO2 Invading Brine Saturated Microfluidic Chips
5.1. Introduction According to the EPA report (U.S. Inventory of Greenhouse Gas Emissions and Sinks: 1990-2014), carbon dioxide (CO2) occupies 80% of a total US greenhouse gas emission in 2014, and the fossil fuel power plants produce 30% of the greenhouse gas generated in the United States [E P A EPA, 2016]. Carbon dioxide capture and sequestration (CCS) can reduce CO2 emissions significantly from fossil fuel burning power plants and large industrial sources such as cement production. The CO2 emission from a 500 MW coal-burning power plant is roughly 3 million tons per year [MIT, 2007]. CCS technology can reduce CO2 emissions from the power plants by 80~90%. The reduction of CO2 emission by CCS with a 90% efficiency is equivalent to planting more than 62 million trees and waiting at least 10 years for them to grow or avoiding annual electricity-related emissions from more than 300,000 homes [EPA, 2013]. The depleted oil and gas reservoirs, deep saline formations with very low permeability caprock, and unmineable coal seams are potential candidates for geological CO2 storage. The phase of CO2 injected into the formations can be gas, liquid, or supercritical state depending on temperature and pressure condition. For example, the CO2 was injected into coal seams at the gaseous or liquid state at the injection rate of 1.6~3.5ton/day in Hokkaido, Japan [Yamaguchi et al., 2009]. In the Alberta basin, Canada, the supercritical CO2 is injected at the injection rate of 208~5000m3/h [Bachu et al., 2004].
50
In Iceland, the mixture of gaseous CO2 and water is injected at the injection rate of 6.03ton/day [Aradottir et al., 2012; Matter et al., 2011]. During the injection of CO2 into the porous rock, the CO2 displaces the existing pore fluid such as brine and oil that are more viscous than the CO2. Several pore-scale microfluidic chip experiments and numerical simulations have been performed to understand the mechanism of immiscible fluid displacement in porous media [Chang et al., 2009; Cottin et al., 2010; Ferer et al., 2004; C Y Zhang et al., 2011]. The displacement pattern of the immiscible fluids in porous media is affected by the capillary number C and viscous ratio M [Lenormand et al., 1988]. 𝑣𝜇
𝑖𝑛𝑣 C = 𝑇 𝑐𝑜𝑠𝜃
(5-1)
𝑠
M=
𝜇𝑖𝑛𝑣
(5-2)
𝜇𝑑𝑒𝑓
where v is the velocity of invading fluid, Ts the interfacial tension between invading and defending fluids, θ is the contact angle in the system of invading fluid-defending fluidsubstrate, and μinv and μdef are the viscosities of the invading fluid (e.g., CO2 in this study) and defending fluid (e.g., brine in this study). Depending on the combination of these viscous and capillary forces, the displacement pattern is classified as either (1) viscous fingering, (2) capillary fingering or (3) stable displacement. The boundaries for the displacement pattern are shown on logC-logM plot (Figure 5-1a). This “phase boundary” is affected by spatial and statistical pore size distribution and domain size and dimension [Lenormand et al., 1988; Liu et al., 2013; Shi et al., 2011; C Y Zhang et al., 2011]. And the values of logC and logM used for several experimental and numerical studies are 51
superimposed in Figure 5-1a. Capillary fingering occurs under the low injection rate condition (logC99.0%) is tried to generate the CO2-water foam, but the foam was destabilized within several minutes. Therefore, the AEROSIL R974 nanofluid is not used in this study. The foam was generated by injecting the nanofluid and gaseous CO2 at P=3MPa simultaneously into a stainless steel tube filled with sands using ISCO pump A and B (Figure 5-6). The diameter of sands ranges from 0.125mm to 0.177mm. The inside diameter of the stainless steel tube is 4.57mm, and the length is 100mm. The void ratio of the sand pack is e=0.58. Two pieces of #200 wire mesh are placed at both ends of the tube 64
to hold the sand particles. The volumetric ratio of the CO2 flow rate to the nanofluid flow rate into the sand pack is 8:1. The generated CO2-water foam is collected in the viewing chamber with a sapphire window through which the foam stability can be monitored.
Figure 5-6. Experimental Configurations for Nanoparticle-stabilized CO2-water Foam Generation and Foam Invasion into a Brine-saturated Microfluidic Chip. For the foam injection experiment, the microfluidic chip is initially saturated with brine by the syringe pump, then the syringe injection valve is closed. Then, the syringe is replaced by a clean one for the foam injection. During the CO2-water foam generation, the CO2 pressure is monitored. When the foam generation is stable, the foam is injected through the capillary tube for the viscosity measurement. Once the viscosity measurement is completed, the foam in the viewing chamber is introduced in the syringe. Then, the foam is injected into the brine-saturated microfluidic chip. The used injection rates are 10μl/min and 100μl/min for the CO2-water foam. Five runs were performed for each injection rate condition. The camera takes pictures every 510 seconds. The pictures are analyzed to obtain the water saturation and CO2 saturation.
65
Viscosity measurement. Once the foam is collected in the viewing chamber, the foam is injected into the stainless steel capillary tube (41cm in length, 0.533 mm inner diameter). Two pressure transducers (PT2 and PT3 in Figure 5-6) measure the pressure difference between both ends. The foam viscosity is calculated by dividing the shear stress τ with the shear rate γ [Adkins et al., 2010a; Worthen et al., 2013a; Worthen et al., 2013c; Z Xue et al., 2016; J Yu et al., 2014]. The shear stress τ is determined by the shear force F and the area A parallel to the applied force vector: 𝐹
𝜏=𝐴=
∆𝑃(𝜋𝑅 2 ) 2𝜋𝑅𝐿
=
∆𝑃𝑅 2𝐿
(5-3)
The shear rate γ of a Newtonian fluid flowing within a pipe is determined:
𝛾=
4𝑣 𝑅
=
𝑄 𝜋𝑅2
4
𝑅
4Q
= πR3
(5-4)
The viscosity of foam can be calculated: 𝜏
𝜋 ∆𝑃𝑅 4
𝜂=𝛾=8∙
(5-5)
𝐿𝑄
In the equations, ΔP is the pressure difference between the two pressure transducers, R is the radius of the stainless steel capillary tube, L is the length of the tube, Q is the foam flow rate, v is the average flow velocity, and η is the viscosity. 5.4.2. Results and Analyses - Foam Viscosity and Displacement Efficiency The results are shown in Figure 5-7. The CO2 saturation after the foam injection depends on the stability and quality of the foam. The foam quality is the ratio of gas volume
66
over the total foam volume (including water phase). The injection of the CO2-water foam at 1μL/min flow rate was performed but not included in this study due to the foam destabilization during the experimental time span; it took 4hrs for the foam generated and stored in the syringe pump to start invading to the microfluidic chip. 10μL/min
100μL/min
Figure 5-7. The Invasion of CO2-water Foam into a Brine-saturated Microfluidic Chip. (a) Distribution of CO2-water foam and brine for two flow rate conditions (10μL/min and 100μL/min). (b) The saturation of CO2 in a microfluidic chip. The invasion test is repeated five times for each condition of flow rate and CO2 phase. The CO2-water foam displaces almost all the brine in the microfluidic chip because of the high viscosity. But, the foam is a CO2 and water mixture inherently including water. Therefore, the generation of the foam with high quality is critically important to increase the displacement ratio for CO2 sequestration purpose. Higher foam quality will result in higher CO2 saturation and higher CO2 storage capacity.
67
At the given injection rate, temperature, and pressure conditions, the CO2 saturation is increased from 41% for gaseous CO2 injection to 62.6% for the CO2-water foam injection when the injection rate is 10μL/min, and from 55.6% for gaseous CO2 injection to 68.4% for the CO2-water foam when the injection rate is 100μL/min. The improvement rates are 52.7% and 23.0%, respectively. Therefore, the high quality and stable CO2–water foam has the potential to increase CO2 storage capacity more than 20-50%, compared to gaseous CO2 injection. 5.5. Conclusion The study investigated the CO2 displacement (sweep) pattern and efficiency by injecting gaseous, liquid, supercritical CO2, and CO2-water foam into a brine-saturated microfluidic chip. The injection rate was controlled. In order to obtain the capillary number and viscosity ratio during the CO2 injection, pore-scale properties (interfacial tension and contact angle) in the system of CO2-brine-substrate were investigated. The interfacial tension and contact angle of the brine-CO2-glass system are measured with a high pressure device. The interfacial tension values of brine in CO2 are less than those of pure water. The values of contact angle measured by two pressurization procedure (droplet generation first vs pressurization first) show clearly the effect of CO2 adsorption onto the substrate on wettability change. Over a long-time span from CO2 injection for storage, the wettability of pore surface is expected. At the given temperature and pressure conditions, CO2 displaced more brine with the increasing injection rate. The liquid CO2 can displace more brine in the microfluidic 68
chip than does the supercritical and gaseous CO2 due to a high viscosity ratio. And as the capillary number increases, the CO2 saturation after the invasion also generally increases. The injection of the CO2-water foam dramatically improves the CO2 saturation at the same injection rate and back pressure. At the same injection rate, temperature and pressure conditions, the CO2 saturation in the microfluidic chip was increased from 41% to 59% when the injection rate is 10μL/min. The foam quality and stability also affect the CO2 saturation. The high quality and stable CO2 foam has the potential to increase CO2 storage capacity more than 20-50%. It is suggested that the increase in viscosity and velocity of the invading fluid contributes to the increasing in sweep efficiency.
69
6. Nanoparticle-coated Surface to Capture Migrating Fine Particles
6.1. Introduction Fine particles, also called fines or formation fines, are small discrete solid particles usually smaller than 75μm. Fines include clay mineral, quartz, amorphous silica, feldspar, and carbonates [Khilar and Fogler, 1998]. More than 95% of petroleum reservoirs contain clay minerals [Berry et al., 2008]. However, non-clay fines constitute a significant portion of formation fines in Gulf Coast reservoirs [Stanley et al., 1995]. Fluid flow in porous media induces fines to be detached from pore wall and migrate in pore space. Fines migration depends on mineralogy, morphology, and the amount of fines in pore space [Zaltoun and Berton, 1992]. The issues (e.g., clogging, flow rate reduction) related to fines migration can be found in many applications such as geological CO2 sequestration [D N Espinoza and Santamarina, 2012; Mangane et al., 2013], in-situ gas hydrate production [Anderson et al., 2014; Yamamoto and Dallimore, 2008], geothermal recovery [Rosenbrand et al., 2015; You et al., 2015], and contaminant transport [Saiers and Lenhart, 2003; W Zhang et al., 2010] in addition to conventional oil and gas recovery [Fogden et al., 2011; Tang and Morrow, 1999]. For example, during in-situ gas hydrate production test, the migrating fines clog by forming bridges at pore throats and eventually generate clogging annular rings around the production well, which reduces flow rate and potentially triggers sand production [Santamarina and Jang, 2009]. The methods developed to mitigate fines migration include acidification, chemical stabilizer, oil coating, and altering zeta potential [Byrne et al., 2009; Hibbeler et al., 2003; 70
T Huang et al., 2002; Kakadjian et al., 2007; Rozo et al., 2007; Sharma, 1996; Velazquez et al., 2012]. Some chemical stabilizers such as organo-silane additives and chemical additives are very effective in stabilizing clay minerals, but less effective in preventing the hydrodynamic entrainment of non-clay particles [Stanley et al., 1995]. The mitigation methods are sometimes impractical or unsatisfactory because, for example, acid treatment leads to well damage and clay stabilizer injection for high pH treatment results in pore blocking [Ahmadi et al., 2013; El-Monier and Nasr-El-Din, 2011; Hibbeler et al., 2003]. However, the coating of nanoparticles on the sediment surface can be an alternative method to prevent fines migration [Danial Arab and Peyman Pourafshary, 2013; Arab et al., 2013]. Nanoparticles have been used to coat proppants’ surface in order to capture migrating fines. The nanoparticle-coated proppants show the enhanced ability to capture migrating fines at the tip of fracture openings, which prevents fines migrating and concentration near a wellbore [T. Huang et al., 2008]. In this study, the properties of nanoparticle-coated surface are investigated to mitigate the migration of fines. The morphology of the nanoparticle-coated surface is characterized and the attraction and adhesion forces between the surfaces and the tip of the atomic force microscope are measured. In addition, the core-scale experimental study is performed for fines’ adsorption efficiency. 6.2. Backgrounds – Fines Migration The Derjaguin–Landau–Verwey–Overbeek (DLVO) theory and the GouyChapman-Stern model have been used to explain the behavior of fines near the surface. The surface forces affecting fines behavior include electric double layer repulsion VDLR, 71
London-van der Waals attraction VLVA, and Born repulsion VBR [Bhattacharjee and Elimelech, 1997; Hibbeler et al., 2003; Khilar and Fogler, 1998]. In addition to these DLVO interaction forces, hydrodynamic force VHR also contributes to repulsion force on fines. The equations for these surface forces are summarized below [Israelachvili, 2011; Khilar and Fogler, 1998]. Electric double layer repulsion (VDLR) for sphere-plate geometry (constant potential case): 𝑉𝐷𝐿𝑅 =
𝜖𝑎𝑝 4
1+𝑒𝑥𝑝(−𝜅ℎ)
2 2 )𝑙𝑛(1 [2𝜓01 𝜓02 ln (1−𝑒𝑥𝑝(−𝜅ℎ)) + (𝜓01 + 𝜓02 − 𝑒𝑥𝑝(−2𝜅ℎ))]
(6-1)
where 𝜖 is the dielectric constant, ap is particle radius, 𝜅 −1 is Debye length, ψ is surface charge, and h is separation distance. London-van der Waals attraction (VLVA) for sphere-plate geometry: 𝑉𝐿𝑉𝐴 = −
𝐴132 2(1+𝐻) 6
𝐻
[𝐻(2+𝐻) + ln (2+𝐻)]
(6-2)
where A132 is the Hamaker constant between pore surface and fines separated by an aqueous medium, and H=h/ap. Born Repulsion (VBR) for sphere-plate geometry:
𝐴
𝜎
6
8+𝐻
132 𝑉𝐵𝑅 = 7560 (𝑎 ) [(2+𝐻)7 + 𝑝
6−𝐻 𝐻7
]
(6-3)
where σ is the atomic collision diameter in Lennard-Jones potential.
72
Hydrodynamic force – repulsion (VHR) for rotating spherical fines: 𝑉𝐻𝑅 =
5 𝑣2ℎ 2𝜋𝜌 𝑎𝑝
3
(6-4)
𝑅3
where ρ is fluid density, ap is fines’ radius, v is fluid velocity, h is separation distance, and R is pore radius. Therefore, the total surface interaction force is the summation of the repulsive and attractive forces:
VT= VDLR+VLVA+VBR+VHR
(6-5)
The positive total surface force means the repulsive force between fines and pore wall resulting in the detachment of fines, and the negative total force means the attraction force between them. The double layer repulsion and London-van der Waals attraction can be modified by the coating of nanoparticles on the surface so that the attraction forces increase. The total surface interaction forces (Equation 5) calculated for the clean surface and nanoparticle-coated surfaces show that the nanoparticle coating dramatically reduces the double layer repulsion, thus the repulsive energy barrier of the surface diminishes or disappears [M. Ahmadi et al., 2011; Danial Arab and Peyman Pourafshary, 2013; Arab et al., 2014; Arab et al., 2013]. Ahmadi et al. [2013] studied the fines adsorption on MgO nanoparticle-coated glass beads and found that the adsorption efficiency was improved by 85%, compared to the case of clean glass beads. The zeta potential was claimed to be the reason why the nanoparticle coating increases the capability of fixing fines. Arab et al. 73
[2014] treated sand columns with five types of nanoparticles (γ-Al2O3, CuO, MgO, SiO2, and ZnO); the results show that γ-Al2O3 coated sand column has the highest adsorption efficiency, and the surface charge was increased dramatically. Although many studies have performed the experiments for fines adsorption onto the nanoparticle-treated surfaces and calculated the total surface interaction forces for the nanoparticle coating, the measurement of the surface interaction force is not available in the literature. The surface force (attraction and adhesion) measurement and the fines adsorption efficiency experiment have been performed in this study. 6.3. Experimental Details 6.3.1. Nanoparticles and Surface Coating Procedure The types of nanoparticles used for this study include MgO (US Research Nanomaterials, 50nm), Al2O3 (Alfa Aesa, 45nm), and TiO2 (US Research Nanomaterials, 30~50nm). The nanoparticles were delivered in the form of colloidal dispersion. The nanoparticle size measured by ZetaPals (Brookhaven Instruments Corp.) is widely distributed and the average diameter is 2810nm (MgO), 587nm (Al2O3), and 467nm (TiO2), suggesting nanoparticles are agglomerated in the solution. Neither dispersant nor ultrasonic dispersant equipment was used to break up the nanoparticle clumps. The nanoparticle colloid was diluted so that the nanofluid concentration (the weight concentration of nanoparticle in water) used for surface coating was 0.1wt%. Nanoparticle coating was performed by submerging clean quartz plates (McMaster, 99.995% SiO2) into the nanofluids for 24hrs followed by gentle rinsing in water and air-drying.
74
6.3.2. Surface Topography and Surface Force Measurement The atomic force microscope AFM (Multimode8, Bruker Inc.) was used to obtain the image of nanoparticle-coated surface and measure attraction and adhesion forces between the nanoparticle-coated quartz surface and the silicon tip of the AFM probe. A silicon probe with a silicon tip (SPM Probe Model: ACTA-W) was used. The tip is pyramidal shape with the height of 15μm. The deflection of the probe (cantilever) is detected by using a laser [Hu et al., 1998; Nonnenmacher et al., 1991; Xu and Arnsdorf, 1995]. The surface topology was obtained by using a tapping mode of the AFM. The scanned surface area was 2μm×2μm. The lateral resolution for scanning was ~0.98nm (2μm/2048), and the vertical resolution was ~0.1nm. The surface imaging was performed in air. The force between the tip of the probe and the surface was calculated by using the spring constant of the probe and the detected deflection. The surface force measurement was performed in both air and deionized water condition. 6.3.3. Sand Column Test for Fines Adsorption Efficiency Quartz sands that have particle size between 250μm and 425μm were used to prepare sand columns. The sands were washed under flowing water for 5min and dried in an oven at 105°C for 24hrs. Then, the sands were packed into four plastic cylinders with the same porosity 36%. The dimension of the sand column is 7.6cm in diameter and 15.5cm in length (Figure 6-1). 75
Figure 6-1. Experimental Configuration of Sand Column Test for Fines Adsorption. The dimension of the sand column is 7.6cm in diameter, and 15.5cm in length. One sand column was immerged in water, and three sand columns were immerged in each type of the nanofluid for 48hrs. The nanofluid concentration used for coating was 0.1weight%. After 48hrs of the immersion, the sand columns were washed with flowing water for 3min to remove the extra nanoparticles that were not firmly attached onto the sand surfaces. Then, the sand columns were flooded with the kaolinite suspension including 0.25wt% of kaolinite (Wilklay SA1, Wilkinson Kaolin Associates, Gordon, Georgia) in water. The volume of the injected kaolinite suspension at each time was equivalent to the total pore volume of the sand column. The kaolinite suspension injection was repeated three times so that the total volume of the injected kaolinite suspension was three times the pore volume of the sand column. The influent (kaolinite suspension with 0.25wt%) and the effluents from the sand columns were collected to measure particle size distribution and the total volume fraction by a particle size analyzer (MasterSizer 2000, 76
Malvern Instrument Ltd). The Malvern MasterSizer 2000 uses laser diffraction method: based on the Mie theory considering the optical properties of both solid (particle) and liquid (water), the particle size is obtained by measuring the angular variation in the intensity of the scattered light. The particle size detectable by this equipment ranges from 10nm to 1000μm. 6.4. Results and Analyses 6.4.1. Surface Image and Surface Forces The surface topology of the clean and nanoparticle-coated quartz surfaces is obtained (Figure 6-2). Two- and three-dimensional views are shown (Note that the scale in z-axis of the 3D figures is different). Even the clean quartz plate has rough surface. The obtained surface topology shows that most nanoparticles are agglomerated. There is certain surface area that is not covered by nanoparticles. However, some particular surface area is covered by several layers of nanoparticles. Especially for Al2O3 coated surface, the maximum height of the nanoparticle coating is 155.5nm for the given scanning area of 2μm×2μm. Compared to the MgO and Al2O3 coated surface, the surface topology of the TiO2-coated surface shows that TiO2 nanoparticles are evenly distributed. This nanoparticle distribution on the surface may affect the attraction and adhesion force measurement. The measured surface forces between the surface and the silicon tip of the AFM probe are shown in Figure 6-3.
77
2D plan view
3D view
500nm
Clean
5.2 nm 0.0 nm 0 0.5
0
1.0 0.5 1.0
1.5 1.5
2.0 μm
500nm
MgO
25.2 nm 3.7 nm 0 0.5
0
1.0 0.5 1.0
1.5 1.5
2.0 μm
500nm
Al2O3
155.9 nm 8.6 nm 0 0.5 0
1.0
0.5 1.0
1.5 1.5
2.0 μm
500nm
TiO2
29.9 nm 0.9 nm 0 0.5 0
1.0
0.5 1.0
1.5 1.5
2.0 μm
Figure 6-2. Surface Topology Obtained by AFM for Clean and Nanoparticlecoated Surfaces. The scanning has been performed for the area of 2μm×2μm. Note that the vertical scale of 3D images is different for each nanoparticle coating: 5.2nm, 25.2nm, 155.5nm, and 29.9nm for the clean, MgO, Al2O3, TiO2-coated surfaces, respectively.
78
0.4 0.3 0.2 0.1 0 -0.1
0.2 0.1 0 -0.1
-0.2
-0.2 300
0.4
350
400 Z [nm]
450
500
300 0.4
3
(c)
0.1 1
2
Force [uN]
0.2
0
350
400 Z [nm]
450
500
400 Z [nm]
450
500
(d)
0.3
0.3 Force [uN]
(b)
0.3 Force [uN]
Force [uN]
0.4
(a)
5
-0.1
0.2 0.1 0 -0.1
4
-0.2
-0.2 300
350
400 Z [nm]
450
500
300
350
Figure 6-3. Force Profiles Measured between the Surface and the Tip of AFM Probe. A blue line represents force profile measured while the probe approaches to the surface, and a red line shows force profile while the probe retracts. (a) Clean quartz surface. (b) MgO nanoparticle coated quartz surface. (c) Al2O3 nanoparticle treated quartz surface. (d) TiO2 nanoparticle treated quartz surface. A blue line represents the force profile measured while the probe approaches the surface, and a red line means the force measurement while the probe retracts from the surface. At the beginning of the measurement, the probe starts moving toward the surface at the point 1 in Figure 6-3c. When the probe approaches closely to the surface, the tip of the probe is snapped onto the surface due to the attraction force at the point 2. As the probe continues to move toward the surface, the force measured by the tip increases (at the point 3). Then, the force decreases as the probe retreats from the surface. Due to adhesion, the 79
force at the point 4 is at minimum. As the probe moves further from the surface, the tip of the probe is detached from the surface and the force becomes zero again at the point 5. Here, the force difference between at the point 1 and at the point 2 is the attraction force, and force difference between at the point 4 and at the point 5 is the adhesion force. The attraction and adhesion force measurement was performed on four different locations arbitrarily chosen for each surface. At each location, the measurement was repeated five times. Therefore, a total of 20 attraction and 20 adhesion forces were measured for each surface. Figure 6-4 shows only adhesion forces measured on the clean quartz surface and the nanoparticle-coated quartz surfaces. Each symbol represents single measurement. Symbols with the same shape and color represent the adhesion forces measured at the same location. Different shape and color of symbols mean the measurement performed at different locations, but on the same surface. Especially, the clean quartz surface shows consistent adhesion forces (at fad≈0.06μN) that are independent on the measured location (Figure 6-4a). However, for the nanoparticle-coated surface, it is shown that the adhesion forces are highly dependent on the measurement location. However, the adhesion forces measured at the same location show reproducible values.
80
0.25
0.25
0.2
Adhesion [uN]
Adhesion [uN]
(a) 0.15 0.1 0.05
(b)
0.2 0.15 0.1 0.05
0
0 420
430
440
450
460
470
420
430
Z [nm] 0.25
450
460
470
460
470
Z [nm] 0.25
(c)
(d)
0.2 Adhesion [uN]
0.2 Adhesion [uN]
440
0.15 0.1
0.15 0.1 0.05
0.05
0
0 420
430
440
450
460
420
470
430
440
450
Z [nm]
Z [nm]
Figure 6-4. Adhesion Forces Measured in Air. (a) Clean quartz surface. (b) MgO nanoparticle coated quartz surface. (c) Al2O3 nanoparticle coated quartz surface. (d) TiO2 nanoparticle coated quartz surface. The mean attraction and adhesion forces with a standard deviation measured in the air and water condition are shown in Figure 6-5. First of all, the attraction and adhesion forces measured in the air are higher than those measured in the water. This may be because the London-van der Waals attraction is larger in the air than in the water condition while the double layer repulsion is higher in the water than in the air (Note that the Hamaker constant is A132=6.5×10⁻²⁰J for SiO2-Air-SiO2, compared to A132=0.5~1.0×10⁻²⁰J for SiO2Water-SiO2 and the dielectric constant is ε≈1 for the air and ε≈87 for the water
81
[Israelachvili, 2011], see the Equations 1~3 for the effect of these constants on the repulsion and attraction forces).
(a)
(b)
(c)
(d)
Figure 6-5. Attraction Forces and Adhesion Forces in Air and Water. (a) Attraction force in air. (b) Adhesion force in air. (c) Attraction force in water. (d) Adhesion force in water. The attraction forces measured in the air and water condition (Figure 6-5a&c) do not show any evident effect of the nanoparticle coating. The surface coated with TiO2 nanoparticles shows a little high attraction in both air and water conditions. For the 82
attraction force measured in air, the MgO- and Al2O3-coated surfaces show even lower attraction forces compared to the clean surface. However, the effect of the nanoparticle coating on the adhesion force is pronounced (Figure 6-5b&d). Both in the air and water conditions, the clean quartz surface has the lowest adhesion force, and the TiO2-coated quartz surface has the highest adhesion force. In addition, note that the standard deviation in the adhesion forces measured for the nanoparticle-coated surfaces is higher than that measured for the clean surface. This is explained by the heterogeneous nanoparticle coating on the surface. The measured attraction forces indicate that the ability of the nanoparticle-coated surface to capture fines migrating through porous media may be similar to the clean surface. However, the nanoparticle-coated surfaces have higher adhesion force, which means that once fines are attached on the surface, the nanoparticle-coated surface has higher ability to keep the fines on the surface, compared to the clean surface. 6.4.2. Fines Adsorption to the Nanoparticle-coated Sands Sand column test is conducted to explore the effect of the nanoparticle-coated surface on fines migration. The particle size distribution and the total volumetric concentration of kaolinites in the influent and the effluent are shown in Figure 6-6 and Table 6-1. The particle size measured by the laser diffraction method is affected by the particle shape and orientation [Tinke et al., 2008]. The scattered light energy is proportional to the particle cross-sectional area [Bowen, 2002; Eshel et al., 2004]. Therefore, the size of spherical particle can be exactly measured while the size of platy and cylindrical particle is underestimated by 31% and 71%, respectively [Gabas et al., 1994]. The weight fraction 83
of kaolinite suspension is 0.25wt%. And the converted volume fraction is 0.0962vol% (=0.25wt%/(2.6g/cm3)). The fines volumetric concentration measured by a particle size analyzer is 0.0679vol% (Table 6-1), which confirms that the particle size is underestimated by 30%. Table 6-1. The Volumetric Concentration of Nanoparticles in the Influent and Effluent. Clean surface [vol%]
Nanoparticle-coated surface [vol%] MgO
Influent
Al2O3
TiO2
0.0679
1st influent
0.0035
0.0014
0.0012
0.0007
2nd influent
0.0147
0.0044
0.0031
0.0009
3rd influent
0.0221
0.0095
0.0070
0.0024
The results in Table 6-1 show that the concentration of the kaolinite particles in the effluents is less than that in the influent, which means some of the kaolinite particles have been attached on the sand surface. As more volume of the kaolinite suspension is injected, the kaolinite concentration in the effluent increases. Even the clean sand surface shows the apparent ability to capture migrating fines. The fines’ concentration in the 1st effluent is only ~5% (=0.0035vol%/0.0679vol%) of the influent concentration. However, the fines’ concentration increases in the 2nd effluent and 3rd effluents. When compared to the pristine sand, the nanoparticle-coated sands show dramatically enhanced ability to capture migrating fines. For the MgO-coated and the Al2O3-coated sand packing, only ~2% of fines originally injected into the packing came out in the 1st effluent. Then the fines’ concentration in the 3rd effluent increases up to 14% (=0.0095vol%/0.0679vol%) for the
84
MgO- and 10% (=0.0070vol%/0.0679vol%) for Al2O3-coated surfaces. For the TiO2coated surface, very low fines’ concentration is observed even after the 3rd injection. The particle size distribution PSD of the kaolinite in the influent and effluent is shown in Figure 6-6. 5.0
5.0
(a) Clean surface
(b) MgO coated 4.0
Influent Volume [%]
Volume [%]
4.0 3.0 2.0
3rd
1.0
1st
0.0 0.01
0.1
1 10 Par cle size [μm]
100
0.01
1000
0.1
1 10 Par cle size [μm]
100
1000
100
1000
5.0
5.0
(c) Al2O3 coated
4.0 Volume [%]
Volume [%]
2.0 1.0
2nd
0.0
4.0
3.0
3.0 2.0 1.0
(d) TiO2 coated
3.0 2.0 1.0
0.0
0.0 0.01
0.1
1 10 Par cle size [μm]
100
1000
0.01
0.1
1 10 Par cle size [μm]
Figure 6-6. Particle Size Distribution of the Kaolinite in the Influent (black), and 1st (red), 2nd (blue), and 3rd (green) Effluents. (a) Clean surface. (b) MgO nanoparticle-coated surface. (c) Al2O3 nanoparticle-coated surface. (d) TiO2 nanoparticle-coated surface. A black line shows the particle size distribution of the influent. The measured size of kaolinite particles in the suspension ranges from 0.1 to 100μm. And red, blue, and green lines represent the size distribution of the kaolinite particles included in the 1st, 2nd, and 3rd effluent. As more volume of the kaolinite suspension is injected, the PSD curve (red, blue, green) in the effluent moves toward the black line (initial influent’s PSD curve). 85
Adsorp on efficiency [ ]
1.0 0.9 0.8 0.7
Clean surface MgO coated Al2O3 coated
0.6
TiO2 coated
0.5 1
2
3
Volume of injected suspension [Pore volume] Figure 6-7. Fines Adsorption Efficiency of the Clean and Nanoparticle-coated Sand Columns. Here, the fines adsorption efficiency E is defined as E=(Cin-Cout)/Cin using the fines concentration in the influent Cin and the fines concentration in the effluent Cout. Higher efficiency means more fines are adsorbed in the surface. The fines adsorption efficiency E calculated from the results in Table 6-1 is shown in Figure 6-7. For the clean sand, the efficiency dramatically decreases from E=0.95 after the 1st injection to E=0.67 after the 3rd injection. Especially for the TiO2-coated sand column, the fines adsorption efficiency maintains high even after the 3rd injection. The fines adsorption efficiency may be affected by many factors such as nanoparticle type and nanofluid concentration used for coating, the injection rate of the fines suspension, the mineral type of fines, the size of fines, the salinity of pore fluid, the 86
amount of fines already adsorbed on the surface, and particle size and porosity of coated sediments. 6.5. Conclusions The properties of the nanoparticle-coated surface and its effect on fines migration are explored in this paper. The images of the nanoparticle-coated surfaces show that nanoparticles are agglomerated and the surface is not evenly coated with the nanoparticles. The attraction and adhesion forces measured between the surface and the tip of the AFM probe show that the nanoparticle coating increases adhesion force, while there is no evident effect on attraction force. Among the used nanoparticles (MgO, Al2O3, and TiO2), the TiO2 nanoparticle coating shows the highest adhesion force. The enhanced adhesion force by the nanoparticle coating may contribute to retaining fines on the nanoparticle-coated surface. The nanoparticle-treated sand packing shows the increased fine fixation efficiency. Among three types of the tested nanoparticles, the TiO2-coated sand column shows the highest ability to retain migrating fines after three pore-volume injection, which is consistent with the results of the adhesion force measurement. The achievements of this study can be applied to fabricate engineered granular system that can be applied to oil and gas recovery, geological CO2 sequestration, geothermal recovery, contaminant transport, groundwater flow, and stormwater management system.
87
7. Conclusion
7.1. Summaries Nanoparticles have been used to modify the properties of fluid and sediment surface for potential application to geotechnical engineering. Salient conclusions follow. Interfacial tension and contact angle in CO2-nanofluid-quartz system. The studies show that nanoparticles can stably and dramatically decrease the interfacial tension of water in compressed CO2 even at high-pressure condition. It is believed from the thermodynamics view that the molar concentration of CO2 and ions increasing at the interface caused the IFT drops with pressure. Several types of nanoparticles (Al2O3, ZnO, MgO and TiO2 nanoparticles) are studied. The Al2O3 nanoparticle is the most effective in reducing the interfacial tension. The decreasing rate is 40% from the pure water at the pressures over 7MPa. The decreasing rates for ZnO, MgO and TiO2 are 20%, 35%, and 36%. The enhancement of surface wettability by the studied hydrophilic nanoparticles is revealed at high pressures. More tests for the wettability alteration due to CO2 adsorption on the quartz surface need to run for this study. The data are useful for the applications of nanofluid-CO2 multiphase flow in sediments. Nanoparticle-stabilized air-water foam. A highly stable air-water foam stabilized by nanoparticle solely is generated in this study. The normalized height keeps over 80% after 17days for specific nanoparticle. The Ostwald ripening of bubbles is observed in the beginning nine hours after foam is made. 88
The bubble size distribution does not change significantly after nine hours. The apparent viscosity is around 25cP at the nanoparticle concentration of 0.5wt% and can be improved to 33cP with a nanoparticle concentration of 1wt%. However, the nanoparticle concentration is less effective in improving the apparent viscosity when it is larger than 1wt%. The apparent viscosity drops with time to around a third of the initial values after 7days of foam generation. The hydraulic conductivity of sand filled with foam is three orders of magnitude less than the that of the clean sand before a breakthrough, and two orders of magnitude less after breakthrough. This study explored the potential of applying nanoparticle stabilized foam as a groundwater barrier. Nanoparticle-stabilized CO2-water foam. Carbon dioxide in various phases (gaseous, liquid, and supercritical CO2) and a water-CO2 foam stabilized by nanoparticles are injected into a brine-saturated microfluidic chip to explore the displacement efficiency. At the same temperature and pressure conditions, CO2 displaced more saline water with the increasing injection rate due to a high capillary number. The liquid CO2 can displace more saline water in a micromodel than the supercritical CO2 and gaseous CO2 due to the high viscosity ratio. Nanoparticle stabilized CO2-water foam dramatically improves the CO2 invasion efficiency in the micromodel at the same injection rate and pressure conditions. At the same injection rate, temperature and pressure conditions, a water-CO2 foam dramatically improves the CO2 saturation from 41% to 59% when the injection rate is 10μL/min. The foam quality and stability affect the CO2 saturation in micromodel. The high quality and stable CO2 foam have the potential to increase CO2 storage capacity by 20-50%. It is 89
believed that the improvement in viscosity and velocity of the invading fluid contributes to increasing in sweeping efficiency. Nanoparticle-coated surface to capture migrating fine particles This study investigated the surface force modification by nanoparticle coatings. Attraction and adhesion forces between the nanoparticle-coated surface and the tip of the AFM are measured. Among the three types of nanoparticle coatings (MgO, Al2O3, and TiO2), the TiO2 nanoparticle coating shows the highest adhesion force. The enhanced adhesion force by the nanoparticle coating may contribute to retaining fines on the nanoparticle-coated surface. The TiO2-coated sand column shows the highest ability to retain migrating fines after three pore-volume injection, which is consistent with the results of the adhesion force measurement. The adsorption efficiencies are over 0.95 even after three pore-volume of fine suspension flooding for TiO2 and Al2O3 coated proppant, which are 40% more than the uncoated proppant. In summary, nanoparticles have great potential for geotechnical applications. The achievements of this research could be applied to CO2 geological sequestration, deep geothermal recovery, oil/gas recovery, fines fixation, and groundwater and soil remediation. 7.2. Future Study The suggestion for future studies is summarized in bullet point.
A collection of more data of IFT and CA to corroborate the effect of nanoparticles on the modification of interface properties. 90
Investigation of the use nanoparticle stabilized air-foam to treat contaminant or to deliver reactive chemicals in permeable reactive barriers.
Generation of a high quality CO2 foam to improve the sweep efficiency at higher pressure and temperature.
Investigation of the effect of nanoparticle concentration on surface force modification and hydraulic conductivity change. Nanoparticles needs to be dispersed using dispersant chemicals or ultrasonic equipment to generate nanoparticle-coated surface during preparation.
Collection of a larger number of surface attractive force measurements and the nanoscale forces between fine particle-coated tip and nanoparticle coated surfaces.
In addition to the results of this study, nanoparticles have an ability to be functionalized. For example, the wettability of the surface can be modified by nanoparticles. The modification of wettability by using hydrophilic and hydrophobic nanoparticles can be applied to other research.
91
References Abdallah, W., et al. (2007), Fundamentals of WettabilityRep., 44-61 pp, Schlumberger Wettability Workshop, Bahrain. Adkins, S. S., D. Gohil, J. L. Dickson, S. E. Webber, and K. P. Johnston (2007), Water-incarbon dioxide emulsions stabilized with hydrophobic silica particles, Physical chemistry chemical physics : PCCP, 9(48), 6333-6343, doi: 10.1039/b711195a. Adkins, S. S., X. Chen, I. Chan, E. Torino, Q. P. Nguyen, A. W. Sanders, and K. P. Johnston (2010a), Morphology and stability of CO2-in-water foams with nonionic hydrocarbon surfactants, Langmuir : the ACS journal of surfaces and colloids, 26(8), 5335-5348, doi: 10.1021/la903663v. Adkins, S. S., X. Chen, I. Chan, E. Torino, Q. P. Nguyen, A. W. Sanders, and K. P. Johnston (2010b), Morphology and Stability of CO2-in-Water Foams with Nonionic Hydrocarbon Surfactants, Langmuir, 26(8), 5335-5348, doi: 10.1021/la903663v. Ahmadi, M., M. R. Ghasemi, and H. H. Rafsanjani (2011), Study of Different Parameters in TiO2 Nanoparticles Formation Journal of Materials Science and Engineering, 5(2011), 87-93. Ahmadi, M., A. Habibi, P. Pourafshry, and S. Ayatollahi (2011), Zeta potential investigation and mathematical modeling of nanoparticles deposited on the rock surface to reduce fine migration, SPE 142633. Ahmadi, M., A. Habibi, P. Pourafshary, and S. Ayatollahi (2013), An Experimental Study of Interaction between Nanoparticles' Deposition on a Sintered Porous Medium and Migratory Fines, J Porous Media, 16(5), 459-467. Alargova, R. G., D. S. Warhadpande, V. N. Paunov, and O. D. Velev (2004), Foam superstabilization by polymer microrods, Langmuir, 20(24), 10371-10374, doi: DOI 10.1021/la048647a. Alvarez, M., and S. Barbato (2006), Calculation of the thermodynamic properties of water using the IAPWS model, J Chil Chem Soc, 51(2), 891-900. Aminzadeh, B., D. A. DiCarlo, D. H. Chung, A. Kianinejad, S. L. Bryant, and C. Huh (2012), Effect of nanoparticles on flow alternation during CO2 injection, SPE 160052.
92
Anderson, B., R. Boswell, T. S. Collett, H. Farrell, S. Ohtsuki, M. White, and M. Zyrianova (2014), Review of the findings of the Ignik Sikumi CO2-CH4 gas hydrate exchange field trial, paper presented at 8th International conference on gas hydrate, Beijing, China. Arab, D., and P. Pourafshary (2013), Nanoparticles-assisted surface charge modification of the porous medium to treat colloidal particles migration induced by low salinity water flooding, Colloids and Surfaces A: Physicochemical and Engineering Aspects, 436, 803-814, doi: 10.1016/j.colsurfa.2013.08.022. Arab, D., and P. Pourafshary (2013), Nanoparticles-assisted surface charge modification of the porous medium to treat colloidal particles migration induced by low salinity water flooding, Colloid Surface A, 436, 803-814, doi: DOI 10.1016/j.colsurfa.2013.08.022. Arab, D., P. Pourafshary, and S. Ayatollahi (2014), Mathematical Modeling of Colloidal Particles Transport in the Medium Treated by Nanofluids: Deep Bed Filtration Approach, Transport Porous Med, 103(3), 401-419, doi: 10.1007/s11242-014-03085. Arab, D., P. Pourafshary, S. Ayatollahi, and A. Habibi (2013), Remediation of colloidfacilitated contaminant transport in saturated porous media treated by nanoparticles, International Journal of Environmental Science and Technology, 11(1), 207-216, doi: 10.1007/s13762-013-0311-3. Aradottir, E. S. P., E. L. Sonnenthal, G. Bjornsson, and H. Jonsson (2012), Multidimensional reactive transport modeling of CO2 mineral sequestration in basalts at the Hellisheidi geothermal field, Iceland, International Journal of Greenhouse Gas Control, 9, 24-40, doi: 10.1016/j.ijggc.2012.02.006. Askounis, A., K. Sefiane, V. Koutsos, and M. E. R. Shanahan (2015), Effect of particle geometry on triple line motion of nano-fluid drops and deposit nano-structuring, Adv Colloid Interfac, 222, 44-57, doi: 10.1016/j.cis.2014.05.003. Bachu, S., and D. B. Bennion (2009), Interfacial tension between CO2, freshwater, and brine in the range of pressure from (2 to 27) MPa, temperature from (20 to 125)C, and water salinity from (0 to 224000)mgL-1, J. Chem. Eng. Data, 54, 765-775. Bachu, S., and D. B. Bennion (2009), Interfacial Tension between CO2, Freshwater, and Brine in the Range of Pressure from (2 to 27) MPa, Temperature from (20 to 125) degrees C, and Water Salinity from (0 to 334 000) mg(.)L(-1), J Chem Eng Data, 54(3), 765-775, doi: 10.1021/je800529x. 93
Bachu, S., Jan M. Nordbotten , and M. A. Celia (2004), Evaluation of the spread of acid gas plumes injected in deep saline aquifers in western Canada as an analogue to CO2 injection in continental sedimentary basins, paper presented at Seventh International Greenhouse Gas Technologies Conference, Elsevier, Vancouver, BC. Barbes, B., R. Paramo, E. Blanco, M. J. Pastoriza-Gallego, M. M. Pineiro, J. L. Legido, and C. Casanova (2013), Thermal conductivity and specific heat capacity measurements of Al2O3 nanofluids, J Therm Anal Calorim, 111(2), 1615-1625, doi: DOI 10.1007/s10973-012-2534-9. Belcher, C., K. Seth, R. Hollier, and B. Paternostro (2010), Maximizing production life with the use of nanotechnology to prevent fines migration, SPE 132152. Ben-Moshe, T., I. Dror, and B. Berkowitz (2012), Copper Oxide Nanoparticle-Coated Quartz Sand as a Catalyst for Degradation of an Organic Dye in Water, Water, Air, & Soil Pollution, 223(6), 3105-3115, doi: 10.1007/s11270-012-1093-9. Berry, S. L., J. L. Boles, H. D. Brannon, and B. B. Beall (2008), Performance evaluation of ionic liquids as a clay stabilizer and shale inhibitor, in SPE International symposium and exhibition on formation damage control, edited, Lafayette, LA., USA. Bhattacharjee, S., and M. Elimelech (1997), Surface element integration: A novel technique for evaluation of DLVO interaction between a particle and a flat plate, J Colloid Interf Sci, 193, 273-285. Binks, B. P., and T. S. Horozov (2005), Aqueous foams stabilized solely by silica nanoparticles, Angew Chem Int Edit, 44(24), 3722-3725, doi: DOI 10.1002/anie.200462470. Binks, B. P., and T. S. Horozov (2006), Colloidal particles at liquid interfaces, Cambridge University Press, Cambridge, UK. Binks, B. P., M. Kirkland, and J. A. Rodrigues (2008), Origin of stabilisation of aqueous foams in nanoparticle-surfactant mixtures, Soft Matter, 4(12), 2373-2382, doi: 10.1039/b811291f. Bostwick, J. B., and P. H. Steen (2009), Capillary oscillations of a constrained liquid drop, Phys Fluids, 21(3), doi: Artn 032108 10.1063/1.3103344. Bowen, P. (2002), Particle Size Distribution Measurement from Millimeters to Nanometers and from Rods to Platelets, Journal of Dispersion Science and Technology, 23(5), 631-662, doi: 10.1081/dis-120015368. 94
Butt, H.-J., K. Graf, and M. Kappl (2003), Physics and chemistry of interfaces, xii,361 p. pp., Wiley-VCH ; John Wiley, Weinheim Chichester. Byrne, M., S. Waggoner, and H. Carigali (2009), Fines migration in a high temperature gas reservoir - Laboratory simulaiton and implications for completion desing, paper presented at SPE European Formation Damage Conference, Scheveningen, Netherlands. Cantat, I. (2013), Liquid meniscus friction on a wet plate: Bubbles, lamellae, and foams, Physics of Fluids, 25(3), 031303, doi: 10.1063/1.4793544. Cao, S. C., S. Dai, and J. Jung (2016), Supercritical CO2 and brine displacement in geological carbon sequestration: Micromodel and pore network simulation studies, International Journal of Greenhouse Gas Control, 44, 104-114, doi: 10.1016/j.ijggc.2015.11.026. Chang, L. C., J. P. Tsai, H. Y. Shan, and H. H. Chen (2009), Experimental study on imbibition displacement mechanisms of two-phase fluid using micro model, Environmental Earth Sciences, 59(4), 901-911, doi: DOI 10.1007/s12665-009-00856. Chen, R.-H., T. X. Phuoc, and D. Martello (2011), Surface tension of evaporating nanofluid droplets, International Journal of Heat and Mass Transfer, 54(11-12), 2459-2466, doi: 10.1016/j.ijheatmasstransfer.2011.02.016. Chiquet, P., D. F. Broseta, and S. Thibeau (2005), Capillary Alteration Of Shaly Caprocks By Carbon Dioxide, edited, Society of Petroleum Engineers. Chiquet, P., D. Broseta, and S. Thibeau (2007a), Wettability alteration of caprock minerals by carbon dioxide, Geofluids, 7(2), 112-122, doi: 10.1111/j.14688123.2007.00168.x. Chiquet, P., J. L. Daridon, D. Broseta, and S. Thibeau (2007b), CO2/water interfacial tensions under pressure and temperature conditions of CO2 geological storage, Energ Convers Manage, 48(3), 736-744, doi: 10.1016/j.enconman.2006.09.011. Cottin, C., H. Bodiguel, and A. Colin (2010), Drainage in two-dimensional porous media: From capillary fingering to viscous flow, Physical Review E, 82(4), doi: Artn 046315 Doi 10.1103/Physreve.82.046315. CraneCo. (1988), Flow of fluids through valves, fittings, and pipe, edited, SC, USA.
95
Dehghan, A. A., R. Kharrat, and M. H. Ghazanfari (2010), Visualization and Quantification of Asphaltinic-Heavy Oil Displacement by Co-Solvents at Different Wettability Conditions, Petrol Sci Technol, 28(2), 176-189, doi: Doi 10.1080/10916460802706497. DeHoff, K. J., M. Oostrom, C. Zhang, and J. W. Grate (2012), Evaluation of two-phae relative permeability and capillary pressure relations for unstable displacements in a pore network, Vadose Zone Journal, 11(4), doi: doi:10.2136/vzj2012.0024. del Río, O. I., and A. W. Neumann (1997), Axisymmetric drop shape analysis: Computational methods for the measurement of interfacial properties from the shape and dimensions of pendant and sessile drops, Journal of Colloid and Interface Science, 196, 136-147. DiCarlo, D. A., B. Aminzadeh, M. Roberts, D. H. Chung, S. L. Bryant, and C. Huh (2011), Mobility control through spontaneous formation of nanoparticle stabilized emulsions, Geophys Res Lett, 38, doi: Artn L24404 10.1029/2011gl050147. Dickson, J. L., B. P. Binks, and K. P. Johnston (2004), Stabilization of carbon dioxide-inwater emulsions with silica nanoparticles, Langmuir, 20(19), 7976-7983, doi: 10.1016/la0488102. Dong, B., Y. Y. Yan, and W. Z. Li (2011), LBM Simulation of Viscous Fingering Phenomenon in Immiscible Displacement of Two Fluids in Porous Media, Transp. Porous Media, 88(2), 293-314, doi: 10.1007/s11242-011-9740-y. Dong, X. Q., J. A. Xu, C. B. Cao, D. J. Sun, and X. R. Jiang (2010), Aqueous foam stabilized by hydrophobically modified silica particles and liquid paraffin droplets, Colloid Surface A, 353(2-3), 181-188, doi: 10.1016/j.colsurfa.2009.11.010. Duan, Z. H., and R. Sun (2003), An improved model calculating CO2 solubility in pure water and aqueous NaCl solutions from 273 to 533 K and from 0 to 2000 bar, Chem Geol, 193(3-4), 257-271, doi: Doi 10.1016/S0009-2541(02)00263-2. El-Monier, E. A., and H. A. Nasr-El-Din (2011), A New Al-Based Stabilizer for High pH Applications, edited, Society of Petroleum Engineers. Engelhardt, K., A. Rumpel, J. Walter, J. Dombrowski, U. Kulozik, B. Braunschweig, and W. Peukert (2012), Protein Adsorption at the Electrified Air-Water Interface: Implications on Foam Stability, Langmuir, 28(20), 7780-7787, doi: 10.1021/la301368v.
96
EPA
(2013), Carbon Dioxide Capture http://www.epa.gov/climatechange/ccs/index.html.
and
Sequestration,
EPA, E. P. A. (2016), Inventory of U.S. greenhouse gas emissions and sinks: 19902014Rep., Washington DC. Eshel, G., G. J. Levy, U. Mingelgrin, and M. J. Singer (2004), Critical evaluation of the use of laser diffraction for particle-size distribution analysis, Soil Sci. Soc. Am. J., 68, 736-743. Espinoza, D. A., F. M. Caldelas, K. P. Johnston, S. L. Bryant, and C. Huh (2010), Nanoparticle-Stabilized Supercritical CO2 Foams for Potential Mobility Control Applications, edited, Society of Petroleum Engineers. Espinoza, D. N., and J. C. Santamarina (2010), Water-CO2-mineral systems: Interfacial tension, contact angle, and diffusion-Implications to CO2 geological storage, Water Resources Research, 46, doi: Artn W07537 10.1029/2009wr008634. Espinoza, D. N., and J. C. Santamarina (2010a), Water-CO2-mineral systems: Interfacial tension, contact angle, and diffusion—Implications to CO2 geological storage, Water Resources Research, 46(7), W07537, doi: 10.1029/2009WR008634. Espinoza, D. N., and J. C. Santamarina (2010b), Water-CO2-mineral systems: Interfacial tension, contact angle, and diffusion-Implications to CO2geological storage, Water Resources Research, 46(7), n/a-n/a, doi: 10.1029/2009wr008634. Espinoza, D. N., and J. C. Santamarina (2012), Clay interaction with liquid and supercritical CO2: The relevance of electrical and capillary forces, Int J Greenh Gas Con, 10, 351-362, doi: 10.1016/j.ijggc.2012.06.020. Fan, H., and A. Striolo (2012), Nanoparticle effects on the water-oil interfacial tension, Phys Rev E, 86(5), doi: ARTN 051610 10.1103/PhysRevE.86.051610. Fan, J., and L. Q. Wang (2011), Review of Heat Conduction in Nanofluids, J Heat TransT Asme, 133(4), doi: Artn 040801 10.1115/1.4002633. Fenghour, A., W. A. Wakeham, and V. Vesovic (1998), The viscosity of carbon dioxide, J Phys Chem Ref Data, 27(1), 31-44. Ferer, M., C. Ji, G. S. Bromhal, J. Cook, G. Ahmadi, and D. H. Smith (2004), Crossover from capillary fingering to viscous fingering for immiscible unstable flow:
97
Experiment and modeling, Physical Review E, 70(1), doi: Artn 016303 Doi 10.1103/Physreve.70.016303. Fleming, R. A., and M. Zou (2013), Silica nanoparticle-based films on titanium substrates with long-term superhydrophilic and superhydrophobic stability, Appl Surf Sci, 280, 820-827, doi: DOI 10.1016/j.apsusc.2013.05.068. Fogden, A., M. Kumar, N. R. Morrow, and J. S. Buckley (2011), Mobilization of Fine Particles during Flooding of Sandstones and Possible Relations to Enhanced Oil Recovery, Energ Fuel, 25(4), 1605-1616, doi: 10.1021/ef101572n. Gabas, N., N. Hiquily, and C. Laguerie (1994), Response of Laser Diffraction Particle Sizer to Anisometric Particles, Part Part Syst Char, 11(2), 121-126, doi: DOI 10.1002/ppsc.19940110203. Gaillard, T., C. Honorez, M. Jumeau, F. Elias, and W. Drenckhan (2015), A simple technique for the automation of bubble size measurements, Colloids and Surfaces A: Physicochemical and Engineering Aspects, 473, 68-74, doi: http://dx.doi.org/10.1016/j.colsurfa.2015.01.089. Gao, W. C., Y. X. Zhang, X. Y. Zhang, Z. L. Duan, Y. H. Wang, C. Qin, X. Hu, H. Wang, and S. Chang (2015), Permeable reactive barrier of coarse sand-supported zero valent iron for the removal of 2,4-dichlorophenol in groundwater, Environ Sci Pollut R, 22(21), 16889-16896, doi: 10.1007/s11356-015-4912-x. Géraud, B., S. A. Jones, I. Cantat, B. Dollet, and Y. Méheust (2016), The flow of a foam in a two-dimensional porous medium, Water Resources Research, 52(2), 773-790, doi: 10.1002/2015wr017936. Golomb, D., E. Barry, D. Ryan, C. Lawton, and P. Swett (2004), Limestone-ParticleStabilized Macroemulsion of Liquid and Supercritical Carbon Dioxide in Water for Ocean Sequestration, Environmental Science & Technology, 38(16), 4445-4450, doi: 10.1021/es035359c. Golomb, D., E. Barry, D. Ryan, P. Swett, and H. Duan (2006), Macroemulsions of Liquid and Supercritical CO2-in-Water and Water-in-Liquid CO2Stabilized by Fine Particles, Industrial & Engineering Chemistry Research, 45(8), 2728-2733, doi: 10.1021/ie051085l. Habibi, A., M. Ahmadi, P. Pourafshary, and S. Ayatollahi (2011), Reduction of fines migration by nanofluids injection, An experimental study, SPE 144196.
98
Habibi, A., M. Ahmadi, P. Pourafshary, s. Ayatollahi, and Y. Al-Wahaibi (2011), Reduction of Fines Migration by Nanofluids Injection: An Experimental Study, doi: 10.2118/144196-PA. Hebach, A., G. Martin, A. Kogel, and N. Dahmen (2005), Interfacial tension during mass transfer of CO2 into water in a water-saturated CO2 atmosphere at 298K and 6.6MPa, J. Chem. Eng. Data, 50, 403-411. Hegde, R. N., S. S. Rao, and R. P. Reddy (2012), Studies on nanoparticle coating due to boiling induced precipitation and its effect on heat transfer enhancement on a vertical cylindrical surface, Exp Therm Fluid Sci, 38, 229-236, doi: 10.1016/j.expthermflusci.2011.12.011. Hendraningrat, L., and O. Torsaeter (2014), Effects of the Initial Rock Wettability on Silica-Based Nanofluid-Enhanced Oil Recovery Processes at Reservoir Temperatures, Energ Fuel, 28(10), 6228-6241, doi: DOI 10.1021/ef5014049. Hibbeler, J., T. Garcia, and N. Chavez (2003), An integrated long-term solution for migratory fines damage, paper presented at SPE Latin American and Caribbean Petroleum Engineering Conference, Port-of-Spain, Trinidad. Hirasaki, G. J., C. A. Miller, H. Meinardus, and V. Dwarakanath (2003), Application of foam for aquifer remediation., Abstr Pap Am Chem S, 225, U685-U685. Hoorfar, M., and A. W. Neumann (2004), Axisymmetric Drop Shape Analysis (ADSA) for the determination of surface tension and contact angle, J Adhesion, 80(8), 727-743, doi: 10.1080/00218460490477684. Hu, K., M. Brust, and A. J. Bard (1998), Characterization and surface charge measurement of self-assembled CdS nanoparticle films, Chem. Mater., 10, 1160-1165. Huang, T., P. M. McElfresh, and A. Gabtysch (2002), High temperature acidizing to prevent fines migration, paper presented at SPE International Symposium and Exhibition on Formation Damage Control, Lafayette, USA. Huang, T., J. B. Crews, and J. R. Willingham (2008), Using Nanoparticle Technology to Control Fine Migration, edited, Society of Petroleum Engineers. Huang, T., J. B. Crews, and J. R. Willingham (2008), Using nanoparticle technology to control formation fines migration, SPE 115384.
99
Huang, T., J. B. Crews, J. R. Willingham, J. R. Pace, and C. K. Belcher (2013), Nano-sized particle-coated proppants for formation fines fixation in proppant packs, edited. Huang, T. P., and D. E. Clark (2015), Enhancing Oil Recovery With Specialized Nanoparticles by Controlling Formation-Fines Migration at Their Sources in Waterflooding Reservoirs, Spe J, 20(4), 743-746. Israelachvili, J. N. (2011), Intermolecular and surface forces, 3rd ed., 674 pp., Elsevier. Jadhunandan, P. P., and N. R. Morrow (1995), Effect of Wettability on Waterflood Recovery for Crude-Oil Brine Rock Systems, Spe Reservoir Eng, 10(1), 40-46, doi: Doi 10.2118/22597-Pa. Ju, B., S. Dai, Z. Luan, T. Zhu, X. Su, and X. Qiu (2002), A Study of Wettability and Permeability Change Caused by Adsorption of Nanometer Structured Polysilicon on the Surface of Porous Media, edited, Society of Petroleum Engineers. Ju, B. S., and T. L. Fan (2009), Experimental study and mathematical model of nanoparticle transport in porous media, Powder Technol, 192(2), 195-202, doi: 10.1016/j.powtec.2008.12.017. Kakadjian, S., F. Zamora, and J. J. Venditto (2007), Zeta potential altering system for increased fluid recovery, production, and fines control, paper presented at SPE International Symposium on Oilfield Chemistry, Houston, TX, USA. Kaszuba, J. P., D. R. Janecky, and M. G. Snow (2003), Carbon dioxide reaction processes in a model brine aquifer at 200 degrees C and 200 bars: implications for geologic sequestration of carbon, Appl Geochem, 18(7), 1065-1080, doi: 10.1016/S08832927(02)00239-1. Khilar, K. C., and H. S. Fogler (1998), Migration of fines in porous media, Kluwer Academnic Publishers, Dordrecht, The Netherlands. Kim, I., A. J. Worthen, K. P. Johnston, D. A. DiCarlo, and C. Huh (2016), Size-dependent properties of silica nanoparticles for Pickering stabilization of emulsions and foams, Journal of Nanoparticle Research, 18(4), 82:81~12, doi: 10.1007/s11051-016-33950. Kim, J. U., B. H. Park, and M. H. Lee (2013), Critical parameters to determine mean bubble size of generated foams from a foam generator, J Appl Polym Sci, 130(3), 2062-2067, doi: 10.1002/app.39401.
100
Kim, S., and J. C. Santamarina (2014), Engineered CO2 injection: The use of surfactants for enhanced sweep efficiency, International Journal of Greenhouse Gas Control, 20, 324-332, doi: 10.1016/j.ijggc.2013.11.018. Kim, S. K., S. W. Lee, J. H. Han, B. Lee, S. Han, and C. S. Hwang (2010), Capacitors with an Equivalent Oxide Thickness of < 0.5 nm for Nanoscale Electronic Semiconductor Memory, Adv Funct Mater, 20(18), 2989-3003, doi: 10.1002/adfm.201000599. Kim, Y., J. M. Wan, T. J. Kneafsey, and T. K. Tokunaga (2012), Dewetting of Silica Surfaces upon Reactions with Supercritical CO2 and Brine: Pore-Scale Studies in Micromodels, Environ Sci Technol, 46(7), 4228-4235, doi: 10.1021/es204096w. Krishnamoorti, R. (2006), Extracting the Benefits of Nanotechnology for the Oil Industry, doi: 10.2118/1106-0024-JPT. Larson, R. G. (2014), Transport and deposition patterns in drying sessile droplets, Aiche J, 60(5), 1538-1571, doi: 10.1002/aic.14338. Lee, S., G. Lee, and S. I. Kam (2014), Three-Phase Fractional Flow Analysis for FoamAssisted Non-aqueous Phase Liquid (NAPL) Remediation, Transport Porous Med, 101(3), 373-400, doi: 10.1007/s11242-013-0250-y. Lenormand, R., E. Touboul, and C. Zarcone (1988), Numerical models and experiments on immiscible displacements in porous media, Journal of Fluid Mechnics, 189, 165187. Li, S. Y., Z. M. Li, and P. Wang (2016), Experimental Study of the Stabilization of CO2 Foam by Sodium Dodecyl Sulfate and Hydrophobic Nanoparticles, Ind Eng Chem Res, 55(5), 1243-1253, doi: 10.1021/acs.iecr.5b04443. Li, Y. Z., D. DiCarlo, X. F. Li, J. L. Zang, and Z. N. Li (2015), An experimental study on application of nanoparticles in unconventional gas reservoir CO2 fracturing, Journal of Petroleum Science and Engineering, 133, 238-244, doi: 10.1016/j.petrol.2015.05.023. Liu, H., A. J. Valocchi, Q. Kang, and C. Werth (2013), Pore-Scale Simulations of Gas Displacing Liquid in a Homogeneous Pore Network Using the Lattice Boltzmann Method, Transp. Porous Media, 99(3), 555-580, doi: 10.1007/s11242-013-0200-8. Maghzi, A., A. Mohebbi, R. Kharrat, and M. H. Ghazanfari (2011), Pore-Scale Monitoring of Wettability Alteration by Silica Nanoparticles During Polymer Flooding to Heavy Oil in a Five-Spot Glass Micromodel, Transport Porous Med, 87(3), 653-664, doi: DOI 10.1007/s11242-010-9696-3. 101
Maghzi, A., A. Mohebbi, R. Kharrat, and M. H. Ghazanfari (2013), An Experimental Investigation of Silica Nanoparticles Effect on the Rheological Behavior of Polyacrylamide Solution to Enhance Heavy Oil Recovery, Petrol Sci Technol, 31(5), 500-508, doi: 10.1080/10916466.2010.518191. Maghzi, A., S. Mohammadi, M. H. Ghazanfari, R. Kharrat, and M. Masihi (2012), Monitoring wettability alteration by silica nanoparticles during water flooding to heavy oils in five-spot systems: A pore-level investigation, Exp Therm Fluid Sci, 40, 168-176, doi: DOI 10.1016/j.expthermflusci.2012.03.004. Mangane, P. O., P. Gouze, and L. Luquot (2013), Permeability impairment of a limestone reservoir triggered by heterogeneous dissolution and particles migration during CO2rich injection, Geophys Res Lett, 40(17), 4614-4619, doi: 10.1002/grl.50595. Marinova, K. G., R. G. Alargova, N. D. Denkov, O. D. Velev, D. N. Petsev, I. B. Ivanov, and R. P. Borwankar (1996), Charging of oil-water interfaces due to spontaneous adsorption of hydroxyl ions, Langmuir, 12(8), 2045-2051, doi: DOI 10.1021/la950928i. Mas-Hernandez, E., P. Grassia, and N. Shokri (2015), Foam improved oil recovery: Foam front displacement in the presence of slumping, Colloid Surface A, 473, 123-132, doi: 10.1016/j.colsurfa.2014.12.023. Masuda, H., A. Ebata, K. Teramae, and N. Hishinuma (1993), Alteration of Thermal Conductivity and Viscosity of Liquid by Dispersing Ultra-Fine Particles Dispersion of Al2O3, SiO2 and TiO2 Ultra-Fine Particles, Netsu Bussei, 7(4), 227-233, doi: 10.2963/jjtp.7.227. Matter, J. M., et al. (2011), The CarbFix Pilot Project–Storing carbon dioxide in basalt, Energy Procedia, 4, 5579-5585, doi: http://dx.doi.org/10.1016/j.egypro.2011.02.546. Melle, S., M. Lask, and G. G. Fuller (2005), Pickering emulsions with controllable stability, Langmuir, 21(6), 2158-2162, doi: 10.1021/la047691n. Meybodi, H. E., R. Kharrat, and M. N. Araghi (2011), Experimental studying of pore morphology and wettability effects on microscopic and macroscopic displacement efficiency of polymer flooding, J Petrol Sci Eng, 78(2), 347-363, doi: DOI 10.1016/j.petrol.2011.07.004. MIT (2007), The Future of CoalRep., Massachusetts Institute of Technology, Massachusetts Institute of Technology. 102
Mohebbifar, M., M. H. Ghazanfari, and M. Vossoughi (2015), Experimental Investigation of Nano-Biomaterial Applications for Heavy Oil Recovery in Shaly Porous Models: A Pore-Level Study, J Energ Resour-Asme, 137(1), doi: Artn 014501 Doi 10.1115/1.4028270. Moosavi, M., E. K. Goharshadi, and A. Youssefi (2010), Fabrication, characterization, and measurement of some physicochemical properties of ZnO nanofluids, Int J Heat Fluid Fl, 31(4), 599-605, doi: 10.1016/j.ijheatfluidflow.2010.01.011. Mulligan, C. N., and S. L. Wang (2006), Remediation of a heavy metal-contaminated soil by a rhamnolipid foam, Engineering Geology, 85(1-2), 75-81, doi: 10.1016/j.enggeo.2005.09.029. Munshi, A. M., V. N. Singh, M. Kumar, and J. P. Singh (2008), Effect of nanoparticle size on sessile droplet contact angle, J Appl Phys, 103(8), doi: Artn 084315 10.1063/1.2912464. Murshed, S. M. S., S. H. Tan, and N. T. Nguyen (2008), Temperature dependence of interfacial properties and viscosity of nanofluids for droplet-based microfluidics, J Phys D Appl Phys, 41(8), doi: Artn 085502 10.1088/0022-3727/41/8/085502. Nguyen, P., H. Fadaei, and D. Sinton (2014), Pore-Scale Assessment of NanoparticleStabilized CO2 Foam for Enhanced Oil Recovery, Energy Fuels, 28(10), 6221-6227, doi: 10.1021/ef5011995. Nielsen, L. C., I. C. Bourg, and G. Sposito (2012), Predicting CO2-water interfacial tension under pressure and temperature conditions of geologic CO2 storage, Geochim Cosmochim Ac, 81, 28-38, doi: 10.1016/j.gca.2011.12.018. Nonnenmacher, M., M. P. O'Boyle, and H. K. Wickramasinghe (1991), Kelvin probe force microscopy, Appl. Phys. Lett., 58(25), 2921-2923. Ogihara, H., J. Xie, and T. Saji (2015), Controlling surface energy of glass substrates to prepare superhydrophobic and transparent films from silica nanoparticle suspensions, J Colloid Interf Sci, 437, 24-27, doi: DOI 10.1016/j.jcis.2014.09.021. Ogolo, N. A., O. A. Olafuyi, and M. O. Onyekonwu (2012), Enhanced Oil Recovery Using Nanoparticles, edited, Society of Petroleum Engineers. Pal, R. (1996), Effect of droplet size on the rheology of emulsions, Aiche Journal, 42(11), 3181-3190, doi: DOI 10.1002/aic.690421119.
103
Pantzali, M. N., A. G. Kanaris, K. D. Antoniadis, A. A. Mouza, and S. V. Paras (2009), Effect of nanofluids on the performance of a miniature plate heat exchanger with modulated surface, International Journal of Heat and Fluid Flow, 30(4), 691-699, doi: 10.1016/j.ijheatfluidflow.2009.02.005. Park, H. Y., B. J. Kang, D. Lee, and J. H. Oh (2013), Control of surface wettability for inkjet printing by combining hydrophobic coating and plasma treatment, Thin Solid Films, 546, 162-166, doi: 10.1016/j.tsf.2013.03.067. Petrovicova, E., R. Kinght, L. S. Schadler, and T. E. Twardowski (2000), Nylon 11-silica nanocomposite coatings applied by the HVOF process. I. Microstructure and morphology, J Appl Polym Sci, 77, 1684-1699. Pickering, S. U. (1907), Emulsions, J. Chem. Soc. Trans., 91, 2001-2021. Plug, W. J., and J. Bruining (2007), Capillary pressure for the sand-CO2-water system under various pressure conditions. Application to CO2 sequestration, Adv Water Resour, 30(11), 2339-2353, doi: 10.1016/j.advwatres.2007.05.010. Polak, S., Y. Cinar, T. Holt, and O. Torsaeter (2015), Use of low- and high-IFT fluid systems in experimental and numerical modelling of systems that mimic CO2 storage in deep saline formations, J Petrol Sci Eng, 129, 97-109, doi: 10.1016/j.petrol.2015.02.031. Ponnapati, R., O. Karazincir, E. Dao, R. Ng, K. K. Mohanty, and R. Krishnamoorti (2011), Polymer-Functionalized Nanoparticles for Improving Waterflood Sweep Efficiency: Characterization and Transport Properties, Industrial & Engineering Chemistry Research, 50(23), 13030-13036, doi: 10.1021/ie2019257. Prodanovic, M., S. Ryoo, A. R. Rahmani, R. V. Kuranov, C. Kotsmar, T. E. Milner, K. P. Johnston, S. L. Bryant, and C. Huh Effects of Magnetic Field on the Motion of Multiphase Fluids Containing Paramagnetic Nanoparticles in Porous Media, edited, Society of Petroleum Engineers. Prodanović, M. a., S. Ryoo, A. R. Rahmani, R. Kuranov, C. Kotsmar, T. E. Milner, K. P. Johnston, S. L. Bryant, and C. Huh (2010), Effects of magnetic field on the motion of multiphase fluids containing paramagnetic particles in porous media, paper presented at SPE Improved Oil Recovery Symposium, Tulsa, Oklahoma, USA. Ramsden, W. (1903), Separation of solids in the surface-layers of solutions and 'suspensions' (Observation on surface-membraines, bubbles, emulsions, and mechanical coagulation). - Preliminary account, Proc. R. Soc. Lond., 72, 156-164. 104
Rana, S., A. Bajaj, R. Mout, and V. M. Rotello (2012), Monolayer coated gold nanoparticles for delivery applications, Adv Drug Deliver Rev, 64(2), 200-216, doi: 10.1016/j.addr.2011.08.006. Rashidi, L., and K. Khosravi-Darani (2011), The Applications of Nanotechnology in Food Industry, Crit Rev Food Sci, 51(8), 723-730, doi: 10.1080/10408391003785417. Roco, M. C., C. A. Mirkin, and M. C. Hersam (2011), Nanotechnology research directions for societal needs in 2020: summary of international study, J Nanopart Res, 13(3), 897-919, doi: 10.1007/s11051-011-0275-5. Rodriguez, E., M. R. Roberts, H. Yu, C. Huh, and S. L. Bryant (2009), Enhanced migration of surface-treated nanoparticles in sedimentary rocks, paper presented at SPE Annual Technical Conference and Exhibition, New orleans, LA. Rodriguez Pin, E., M. Roberts, H. Yu, C. Huh, and S. L. Bryant Enhanced Migration of Surface-Treated Nanoparticles in Sedimentary Rocks, edited, Society of Petroleum Engineers. Roof, J. G. (1970), Snap-Off of Oil Droplets in Water-Wet Pores, Soc Petrol Eng J, 10(1), 85-&. Rosenbrand, E., C. Kjøller, J. F. Riis, F. Kets, and I. L. Fabricius (2015), Different effects of temperature and salinity on permeability reduction by fines migration in Berea sandstone, Geothermics, 53, 225-235, doi: 10.1016/j.geothermics.2014.06.004. Rossen, W. R. (1996), Foam in enhanced oil recovery, in Foams: theory, measurements, and applications, edited by R. K. Prud'homme and S. A. Khan, pp. 413-464. Rozo, R., J. Paez, A. Mendoza, and A. Milne (2007), An alternative solution to sandstone acidizing using a nonacid-based fluid system with fines migration control, paper presented at SPE Annual Technical Conference and Exhibition, Anaheim, USA. Saiers, J. E., and J. J. Lenhart (2003), Ionic-strength effects on colloid transport and interfacial reactions in partially saturated porous media, Water Resour Res, 39(9), n/a-n/a, doi: 10.1029/2002wr001887. Santamarina, J. C., and J. Jang (2009), Gas production from hydrate bearing sediments: Geomechanical implicaitons, Fire in the ice, 9, 18-22.
105
Schadler, L. S., K. O. Laul, R. W. Smith, and E. Petrovicova (1997), Microstructure and mechanicall properties of thermally sprayed silica/nylon nanocomposites, Journal of Thermal Spry Technology, 6(4), 475-485. Schaeff, H. T., and B. P. McGrail (2004), Direct measurements of pH in H2O-CO2 brine mixtures to supercritical conditions, paper presented at 7th International Conference on Greenhouse Gas Control Technologies (GHGT-7), Vancouver, Canada. Schramm, L. L., and F. Wassmuth (1994), Foams: Basic Principles, in Foams: Fundamentals and Applications in the Petroleum Industry, edited, pp. 3-45, American Chemical Society. Sharma, B. G. (1996), Self assembled polymerizable films on solid substrate: formation, characterization, and application, Ph.D. thesis, University of Texas at Austin. Shi, J.-Q., Z. Xue, and S. Durucan (2011), Supercritical CO2 core flooding and imbibition in Tako sandstone—Influence of sub-core scale heterogeneity, International Journal of Greenhouse Gas Control, 5(1), 75-87, doi: 10.1016/j.ijggc.2010.07.003. Son, H., H. Kim, G. Lee, J. Kim, and W. Sung (2014), Enhanced oil recovery using nanoparticle-stabilized oil/water emulsions, Korean J Chem Eng, 31(2), 338-342, doi: 10.1007/s11814-013-0214-5. Spycher, N., K. Pruess, and J. Ennis-King (2003), CO2-H2O mixtures in the geological sequestration of CO2. I. Assessment and calculation of mutual solubilities from 12 to 100 degrees C and up to 600 bar, Geochim Cosmochim Ac, 67(16), 3015-3031, doi: 10.1016/S0016-7037(03)00273-4. Stanley, F. O., S. A. Ali, and J. L. Boles (1995), Laboratory and field evaluation of organosilane as a formation fines stabilizer, paper presented at Production Operations Symposium, Oklahoma city, OK., USA. Stevenson, P., and ebrary Inc. (2012), Foam engineering fundamentals and applications, edited, pp. xvi, 530 p., 534 p. of plates, Wiley,, Chichester, West Sussex. Subramaniam, A. B., C. Mejean, M. Abkarian, and H. A. Stone (2006), Microstructure, morphology, and lifetime of armored bubbles exposed to surfactants, Langmuir, 22(14), 5986-5990, doi: 10.1021/la060388x. Suleimanov, B. A., F. S. Ismailov, and E. F. Veliyev (2011), Nanofluid for enhanced oil recovery, J Petrol Sci Eng, 78(2), 431-437, doi: 10.1016/j.petrol.2011.06.014.
106
Sutjiadi-Sia, Y., P. Jaeger, and R. Eggers (2008a), Interfacial tension of solid materials against dense carbon dioxide, Journal of Colloid and Interface Science, 320(1), 268274, doi: 10.1016/j.jcis.2007.12.021. Sutjiadi-Sia, Y., P. Jaeger, and R. Eggers (2008b), Interfacial phenomena of aqueous systems in dense carbon dioxide, J Supercrit Fluid, 46(3), 272-279, doi: 10.1016/j.supflu.2008.06.001. Sutjiadi-Sia, Y., P. Jaeger, and R. Eggers (2008c), Interfacial tension of solid materials against dense carbon dioxide, Journal of colloid and interface science, 320(1), 268274, doi: 10.1016/j.jcis.2007.12.021. Takata, Y., S. Hidaka, and M. Kohno (2009), Wettability Improvement by Plasma Irradiation and Its Applications to Phase-Change Phenomena, Heat Transfer Eng, 30(7), 549-555, doi: Pii 907741033 10.1080/01457630802594820. Tang, G.-Q., and N. R. Morrow (1999), Influence of brine composition and fines migration on crudi oil/brine/rock interactions and oil recovery, J Petrol Sci Eng, 24, 99-111. Thiruverikatachari, R., S. Vigneswaran, and R. Naidu (2008), Permeable reactive barrier for groundwater remediation, J Ind Eng Chem, 14(2), 145-156, doi: 10.1016/j.jiec.2007.10.001. Tinke, A. P., A. Carnicer, R. Govoreanu, G. Scheltjens, L. Lauwerysen, N. Mertens, K. Vanhoutte, and M. E. Brewster (2008), Particle shape and orientation in laser diffraction and static image analysis size distribution analysis of micrometer sized rectangular particles, Powder Technol, 186(2), 154-167, doi: 10.1016/j.powtec.2007.11.017. Tripp, C. P., and J. R. Combes (1998), Chemical modification of metal oxide surfaces in supercritical CO2: The interaction of supercritical CO2 with the adsorbed water layer and the surface hydroxyl groups of a silica surface, Langmuir, 14(26), 7350-7352. Vafaei, S., and D. S. Wen (2010), The effect of gold nanoparticles on the spreading of triple line, Microfluid Nanofluid, 8(6), 843-848, doi: DOI 10.1007/s10404-009-0561z. Vafaei, S., and D. Wen (2011), Spreading of triple line and dynamics of bubble growth inside nanoparticle dispersions on top of a substrate plate, J Colloid Interface Sci, 362(2), 285-291, doi: 10.1016/j.jcis.2011.06.048.
107
Vafaei, S., A. Purkayastha, A. Jain, G. Ramanath, and T. Borca-Tasciuc (2009), The effect of nanoparticles on the liquid-gas surface tension of Bi2Te3 nanofluids, Nanotechnology, 20(18), 185702, doi: 10.1088/0957-4484/20/18/185702. Vafaei, S., T. Borca-Tasciuc, M. Z. Podowski, A. Purkayastha, G. Ramanath, and P. M. Ajayan (2006), Effect of nanoparticles on sessile droplet contact angle, Nanotechnology, 17(10), 2523-2527, doi: Doi 10.1088/0957-4484/17/10/014. vanderGulik, P. S. (1997), Viscosity of carbon dioxide in the liquid phase, Physica A, 238(1-4), 81-112, doi: Doi 10.1016/S0378-4371(96)00466-9. Velazquez, J. M., A. V. Gaikwad, T. K. Rout, R. E. Baier, E. S. Furlani, and S. Banerjee (2012), Nanotexturation-induced extreme wettability of an elemental tellurium coating, J Mater Chem, 22(8), 3335-3339, doi: 10.1039/c1jm14664e. Vinogradov, A. V., D. S. Kuprin, I. M. Abduragimov, G. N. Kuprin, E. Serebriyakov, and V. V. Vinogradov (2016), Silica Foams for Fire Prevention and Firefighting, Acs Appl Mater Inter, 8(1), 294-301, doi: 10.1021/acsami.5b08653. Vitoonkijvanich, S., A. M. AlSofi, and M. J. Blunt (2015), Design of foam-assisted carbon dioxide storage in a North Sea aquifer using streamline-based simulation, Int J Greenh Gas Con, 33, 113-121, doi: 10.1016/j.ijggc.2014.11.022. Wagner, W., H.-J. Kretzschmar, W. Wagner, MyiLibrary., and SpringerLink (Online service) (2008), International steam tables properties of water and steam based on the industrial formulation IAPWS-IF97 : tables, algorithms, diagrams, and CD-ROM electronic steam tables : all of the equations of IAPWS-IF97 including a complete set of supplementary backward equations for fast calculations of heat cycles, boilers, and steam turbines, edited, pp. 1 online resource (xvii, 388 p.), Springer,, Berlin. Wang, G.-S., and R. Bao (2009), Two-phase flow patterns of nitrogen and nanofluids in a vertically capillary tube, International Journal of Thermal Sciences, 48(11), 20742079, doi: 10.1016/j.ijthermalsci.2009.03.016. Wang, H., and J. J. Chen (2013), A study on the permeability and flow behavior of surfactant foam in unconsolidated media, Environ Earth Sci, 68(2), 567-576, doi: 10.1007/s12665-012-1760-6. Wang, L. Q., and J. Fan (2011), Toward nanofluids of ultra-high thermal conductivity, Nanoscale Res Lett, 6, doi: Artn 153 10.1186/1556-276x-6-153.
108
Wang, X. W., J. J. Chen, and C. Lv (2015), Evaluation of foam surfactant for foam-flushing technique in remediation of DDT-contaminated soil using data envelopment analysis method, Environ Sci Pollut R, 22(4), 2994-3003, doi: 10.1007/s11356-014-3541-0. Wang, Y., C. Zhang, N. Wei, M. Oostrom, T. W. Wietsma, X. Li, and A. Bonneville (2013), Experimental study of crossover from capillary to viscous fingering for supercritical CO2-water displacement in a homogeneous pore network, Environmental science & technology, 47(1), 212-218, doi: 10.1021/es3014503. Weng, R., H. F. Zhang, and X. W. Liu (2014), Spray-coating process in preparing PTFEPPS composite super-hydrophobic coating, Aip Adv, 4(3), doi: Artn 031327 Doi 10.1063/1.4868377. Worthen, A. J., S. L. Bryant, C. Huh, and K. P. Johnston (2013a), Carbon dioxide-in-water foams stabilized with nanoparticles and surfactant acting in synergy, Aiche J, 59(9), 3490-3501, doi: DOI 10.1002/aic.14124. Worthen, A. J., S. L. Bryant, C. Huh, and K. P. Johnston (2013b), Carbon dioxide-in-water foams stabilized with nanoparticle and surfactant acting in synergy, Aiche J, 59(9), 3490-3501. Worthen, A. J., H. G. Bagaria, Y. S. Chen, S. L. Bryant, C. Huh, and K. P. Johnston (2013c), Nanoparticle-stabilized carbon dioxide-in-water foams with fine texture, Journal of colloid and interface science, 391, 142-151, doi: 10.1016/j.jcis.2012.09.043. Xu, S., and M. F. Arnsdorf (1995), Electrostatic force microscope for probing surface charges in aqueous solutions, Proc Natl Acad Sci U S A, 92, 10384-10388. Xue, H. S., J. R. Fan, Y. C. Hu, R. H. Hong, and K. F. Cen (2006), The interface effect of carbon nanotube suspension on the thermal performance of a two-phase closed thermosyphon, J Appl Phys, 100(10), doi: Artn 104909 Doi 10.1063/1.2357705. Xue, Z., A. Worthen, A. Qajar, I. Robert, S. L. Bryant, C. Huh, M. Prodanovic, and K. P. Johnston (2016), Viscosity and stability of ultra-high internal phase CO2-in-water foams stabilized with surfactants and nanoparticles with or without polyelectrolytes, J Colloid Interf Sci, 461, 383-395, doi: 10.1016/j.jcis.2015.08.031. Yamaguchi, S., K. Ohga, M. Fujioka, M. Nako, and S. Muto (2009), Overview and Present Status of the CO2 Geosequestration in Coal Seams Project in Japan, in Carbon Dioxide Sequestration in Geological Media - State of the Science: AAPG Studies in Geology 59, edited by M. Grobe, J. C. Pashin and R. L. Dodge, pp. 405-416, AAPG. 109
Yamamoto, K., and S. Dallimore (2008), AURORA-JOGMEC-NRCAN Mallik 20062008 Gas hydrate research project progress, Fire in the ice, 8(3), 1-4. Yan, W., C. A. Miller, and G. J. Hirasaki (2006), Foam sweep in fractures for enhanced oil recovery, Colloid Surface A, 282, 348-359, doi: 10.1016/j.colsurfa.2006.02.067. Yang, D., Y. Gu, and P. Tontiwachwuthikul (2008), Wettability determination of the reservoir brine-reservoir rock system with dissolution of CO2 at high pressures and elevated temperatures, Energ Fuel, 22, 504-509. Yang, D. Y., Y. G. Gu, and P. Tontiwachwuthikul (2008), Wettability determination of the reservoir brine-reservoir rock system with dissolution of CO2 at high pressures and elevated temperatures, Energ Fuel, 22(1), 504-509, doi: 10.1021/ef700383x. Yang, J., Z. Z. Zhang, X. H. Xu, X. T. Zhu, X. H. Men, and X. Y. Zhou (2012), Superhydrophilic-superoleophobic coatings, J Mater Chem, 22(7), 2834-2837, doi: 10.1039/c2jm15987b. Yiamsawasd, T., A. S. Dalkilic, and S. Wongwises (2012), Measurement of the thermal conductivity of titania and alumina nanofluids, Thermochim Acta, 545, 48-56, doi: DOI 10.1016/j.tca.2012.06.026. You, Z., P. Bedrikovetsky, A. Badalyan, and M. Hand (2015), Particle mobilization in porous media: Temperature effects on competing electrostatic and drag forces, Geophys Res Lett, 42(8), 2852-2860, doi: 10.1002/2015gl063986. Yu, H., K. Y. Yoon, D. R. Ingram, K. P. Johnston, S. L. Bryant, and C. Huh (2010), Transport and retention of aqueous dispersions of paramagnetic nanoparticles in reservoir rocks, paper presented at SPE Improved Oil Recovery Symposium, Tulsa, OK, USA. Yu, H., C. Kotsmar, K. Y. Yoon, D. R. Ingram, K. P. Johnston, S. L. Bryant, and C. Huh Transport and Retention of Aqueous Dispersions of Paramagnetic Nanoparticles in Reservoir Rocks, edited, Society of Petroleum Engineers. Yu, J., M. Khalil, N. Liu, and R. Lee (2014), Effect of particle hydrophobicity on CO2 foam generation and foam flow behavior in porous media, Fuel, 126, 104-108. Yu, J. J., M. Khalil, N. Liu, and R. Lee (2014), Effect of particle hydrophobicity on CO2 foam generation and foam flow behavior in porous media, Fuel, 126, 104-108, doi: 10.1016/j.fuel.2014.02.053.
110
Zaltoun, A., and N. Berton (1992), Stabilization of montmorillonite clay in porous media by high-molecular-weight polymers, SPE Production Engineering, 7(2), 160-166. Zeyghami, M., R. Kharrat, and M. H. Ghazanfari (2014), Investigation of the Applicability of Nano Silica Particles as a Thickening Additive for Polymer Solutions Applied in EOR Processes, Energ Source Part A, 36(12), 1315-1324, doi: 10.1080/15567036.2010.551272. Zhang, C. Y., M. Oostrom, T. W. Wietsma, J. W. Grate, and M. G. Warner (2011), Influence of viscous and capillary forces on immiscible fluid displacement: porescale experimental study in a water-wet micromodel demonstrating viscous and capillary fingering, Energy Fuels, 25(8), 3493-3505, doi: Doi 10.1021/Ef101732k. Zhang, J. G., F. Muller-Plathe, and F. Leroy (2015), Pinning of the Contact Line during Evaporation on Heterogeneous Surfaces: Slowdown or Temporary Immobilization? Insights from a Nanoscale Study, Langmuir, 31(27), 7544-7552, doi: 10.1021/acs.langmuir.5b01097. Zhang, S. Y., D. J. Sun, X. Q. Dong, C. F. Li, and J. Xu (2008), Aqueous foams stabilized with particles and nonionic surfactants, Colloid Surface A, 324(1-3), 1-8, doi: 10.1016/j.colsurfa.2008.03.020. Zhang, T., M. Roberts, S. L. Bryant, and C. Huh (2009a), Foams and Emulsions Stabilized With Nanoparticles for Potential Conformance Control Applications, in SPE International Symposium on Oilfield Chemistry, 20-22 April, The Woodlands. Texas edited, Society of Petroleum Engineers. Zhang, T., M. R. Roberts, S. L. bryant, and C. Huh (2009), Foams and emulsions stabilized with nanoparticles for potential conformance control applications, SPE 121744. Zhang, T., M. Roberts, S. L. Bryant, and C. Huh (2009b), Foams and Emulsions Stabilized With Nanoparticles for Potential Conformance Control Applications, edited, Society of Petroleum Engineers. Zhang, W., V. L. Morales, M. E. Cakmak, A. E. Salvucci, L. D. Geohring, A. G. Hay, J.Y. Parlange, and T. S. Steenhuis (2010), Colloid transport and retention in unsaturated porous media: Effect of colloid input concentration, Environ Sci Technol, 44, 4965-4972. Zhang, Y. F., D. T. Ge, and S. Yang (2014), Spray-coating of superhydrophobic aluminum alloys with enhanced mechanical robustness, J Colloid Interf Sci, 423, 101-107, doi: 10.1016/j.jcis.2014.02.024. 111
Zhou, S., L. Wu, B. You, and G. Gu (2009), Preparation, Structure and Properties of Organic-Inorganic Nanocomposite Coatings, in Smart Coatings II, edited, pp. 193219, American Chemical Society. Zhu, Q., Q. Zhou, and X. Li (2015), Numerical simulation of displacement characteristics of CO2 injected in pore-scale porous media, Journal of Rock Mechanics and Geotechnical Engineering, doi: http://dx.doi.org/10.1016/j.jrmge.2015.08.004.
112