articles
Oncogenic NRAS signaling differentially regulates survival and proliferation in melanoma
© 2012 Nature America, Inc. All rights reserved.
Lawrence N Kwong1,2, James C Costello3, Huiyun Liu1, Shan Jiang1,2, Timothy L Helms2, Aliete E Langsdorf1, David Jakubosky1, Giannicola Genovese1,2, Florian L Muller1,2, Joseph H Jeong1, Ryan P Bender1, Gerald C Chu1,4, Keith T Flaherty5, Jennifer A Wargo6, James J Collins3,7 & Lynda Chin1,2,8 The discovery of potent inhibitors of the BRAF proto-oncogene has revolutionized therapy for melanoma harboring mutations in BRAF, yet NRAS-mutant melanoma remains without an effective therapy. Because direct pharmacological inhibition of the RAS proto-oncogene has thus far been unsuccessful, we explored systems biology approaches to identify synergistic drug combination(s) that can mimic RAS inhibition. Here, leveraging an inducible mouse model of NRAS-mutant melanoma, we show that pharmacological inhibition of mitogen-activated protein kinase kinase (MEK) activates apoptosis but not cell-cycle arrest, which is in contrast to complete genetic neuroblastoma RAS homolog (NRAS) extinction, which triggers both of these effects. Network modeling pinpointed cyclin-dependent kinase 4 (CDK4) as a key driver of this differential phenotype. Accordingly, combined pharmacological inhibition of MEK and CDK4 in vivo led to substantial synergy in therapeutic efficacy. We suggest a gradient model of oncogenic NRAS signaling in which the output is gated, resulting in the decoupling of discrete downstream biological phenotypes as a result of incomplete inhibition. Such a gated signaling model offers a new framework to identify nonobvious coextinction target(s) for combined pharmacological inhibition in NRAS-mutant melanomas. The RAS proto-oncogene is activated across a diverse range of human cancers1, including 15–20% of the melanomas that harbor activating NRAS mutations2. Agents that block canonical mitogen-activated protein kinase (MAPK) signaling components downstream of RAS, including the serine/threonine protein kinases BRAF, MEK and extracellular-signal–related kinase (ERK), have matured rapidly, with notably positive preclinical and clinical effects in several cancer types, particularly BRAF-mutant melanoma3–7. Clinically, single-agent MEK inhibition has limited efficacy against NRAS-mutant melanoma7–9, and BRAF inhibitors have not been shown to be beneficial in RASmutant cancers10–13. Efforts to target oncogenic RAS mutants directly have thus far been unsuccessful. Traditionally, RAS pathway diagrams depict a linear canonical MAPK cascade consisting of RAS, RAF, MEK and ERK, as well as other signaling branches emanating from RAS, such as the AKT protooncogene pathway. This signaling model has guided combination strategies to target RAS, such as co-inhibition of canonical MAPK (for example, MEK) and AKT signaling14 or combined MEK and BRAF inhibition, to maximize the inhibition of MAPK signaling15. Despite these conceptual advances, key issues remain, including to what extent RAS-MAPK signaling can be maximally inhibited given the redundancy of its signaling network and whether there exist noncanonical coextinction strategies to approximate RAS inhibition.
The keys to data-driven discovery of new therapeutic combinations include not only robust computational platforms but also suitable and maneuverable experimental systems. Computational modeling of signaling pathways within individual cells has included a range of logicbased16 and probabilistic models17–19. However, modeling the kinetics of such a network on an organismal level requires not only appropriate in vivo physiological systems but also the ability to easily perturb such systems for data acquisition. Inducible conditional genetically engineered mouse (GEM) models offer physiological systems that can be used to acquire global transcriptome and proteome data under various perturbation conditions (for example, genetic inactivation compared to pharmacological inhibition of an oncogene) over time. Notably, GEM models provide discrete and specific phenotypic correlates at both the organismal (for example, tumor growth and regression) and molecular (for example, apoptosis and cell-cycle arrest) levels in vivo. Integrating these input and output data would give a system-level view of a particular state after genetic or pharmacological inhibition to define nonobvious combination strategies. In this study, we used this type of systems biology approach to discover evidence-based coextinction strategies against NRAS-mutant melanoma. In an inducible GEM model of melanoma driven by NRAS harboring a Q61K mutation (NRASQ61K), we interrogated the network of oncogenic NRAS signaling using both genetic and pharmacological
1Department
of Medical Oncology, Dana-Farber Cancer Institute, Harvard Medical School, Boston, Massachusetts, USA. 2Department of Genomic Medicine, University of Texas MD Anderson Cancer Center, Houston, Texas, USA. 3Howard Hughes Medical Institute, Department of Biomedical Engineering and Center for BioDynamics, Boston University, Boston, Massachusetts, USA. 4Department of Pathology, Brigham and Women’s Hospital, Boston, Massachusetts, USA. 5Division of Medical Oncology, Massachusetts General Hospital, Boston, Massachusetts, USA. 6Division of Surgical Oncology, Massachusetts General Hospital, Boston, Massachusetts, USA. 7Wyss Institute for Biologically Inspired Engineering, Harvard University, Boston, Massachusetts, USA. 8Institute for Applied Cancer Science, University of Texas MD Anderson Cancer Center, Houston, Texas, USA. Correspondence should be addressed to L.C. (
[email protected]). Received 12 March; accepted 15 August; published online 16 September 2012; corrected online 20 November 2012; doi:10.1038/nm.2941
nature medicine VOLUME 18 | NUMBER 10 | OCTOBER 2012
1503
Articles
RESULTS NRASQ61K extinction, but not MEK inhibition, regresses tumors In the ‘iNRAS’ (inducible NRAS) GEM model of melanoma, expression of the melanoma signature mutation, NRASQ61K (or oncogenic NRAS), is controlled by a doxycycline-regulated tet promoter on the background of a Cdkn2a-null allele; CDKN2A is a key human melanoma suppressor20. Doxycycline-inducible expression of NRASQ61K is restricted to melanocytes through use of the Tyr-rtTA transgene20. Specifically, NRASQ61K expression is driven by a Tet promoter that is activated only in the presence of both doxycycline and rtTA, with rtTA expression limited to melanocytes by the Tyr (tyrosinase) promoter. Administration of doxycycline to iNRAS mice at weaning thus turns on expression of the NRASQ61K transgene in melanocytes and results in spontaneous melanoma formation with a 50% penetrance an average of 15 weeks after the start of treatment, whereas no melanomas develop in mice without doxycycline induction (Supplementary Fig. 1a). In established tumors of both primary de novo and allograft transplant models (see Online Methods for derivation of iNRAS cell lines 413 and 475), doxycycline withdrawal turns off the tetresponsive promoter that drives expression of NRASQ61K. At 4 d after doxycycline withdrawal, we found complete extinction of
b
c –NRAS 4d
Veh
pErk Erk
50
pAkt Akt
d 4
hi
R
d
iNRAS primary tumors
iNRAS allografts Vehicle Selumetinib 100 mg/kg QD
2
600
GSK1120212 3 mg/kg QD 400
200
0
1
10
20 Time (d)
30
40
–NRAS
0 –1 –2
0
Hsp70
–N
Ve
Bim
AS
cl
e
0
–NRAS 2d Tumor volume (mm3)
NRAS mRNA
100
MEKi 4d
NRAS Q61K transgene expression (Fig. 1a). Western blotting at the same time point (Fig. 1b) confirmed a loss of phosphorylated ERK (pERK). Phenotypically, loss of NRASQ61K expression in the established melanomas resulted in rapid, durable and complete tumor regression within 10 d of doxycycline withdrawal (Fig. 1c and Supplementary Fig. 1b,c), validating NRASQ61K as a tumormaintenance oncogene. Of note, doxycycline withdrawal did not affect cell growth in vitro (Supplementary Fig. 1d), which is consistent with previous findings in a similarly engineered iHRAS model of melanoma 3, suggesting microenvironmental influences on tumor maintenance in vivo. In the same in vivo allograft model system as described above, we treated mice bearing iNRAS melanomas with two different pharmacological MEK inhibitors (MEKi), specifically, the secondgeneration MEK inhibitor selumetinib (also known as AZD6244 or ARRY-142886)21 or the third-generation MEK inhibitor GSK1120212 (also known as JTP-74057 or trametinib)4. Similar to other studies with human NRAS-mutant melanomas or xenografts8,22, we found that MEKi was unable to induce tumor regression despite evidence that canonical MAPK signaling was inhibited, as determined by the amount of pERK present (Fig. 1b). Specifically, treatment with either single compound at its respective maximally tolerated dose resulted in tumor stasis but not tumor regression, in contrast to genetic extinction of NRASQ61K, which did result in tumor regression (Fig. 1d). This suggests that treatment with MEKi only partially inhibited oncogenic NRAS activity in the GEM model. Elucidation of the activity or activities unaffected by MEKi could lead to new target(s) for coextinction with MEKi.
log2 fold change
a
0
1
2
3
4
Time after treatment (d)
e 4 day timepoint log2 fold change
© 2012 Nature America, Inc. All rights reserved.
perturbations. We show evidence for a model in which the signaling output downstream of NRAS-MEK-ERK is gated, resulting in the decoupling of two major cancer biological phenotypes, proliferation and survival, which in turn provides the molecular basis for coextinction of MEK and CDK4 to approximate NRAS inhibition.
3 2 1 0 –1 –2 –3 –4
Vehicle MEKi Define RSM genes
NRAS extinction Complete regression 0
5 10 15 Time after treatment (d)
Microarray RPPA
Define RSM pathways Metacore/GSEA pathway analysis
Define key RSM regulator(s) TRAP: regulators-topathways analysis
Data analysis
Data generation
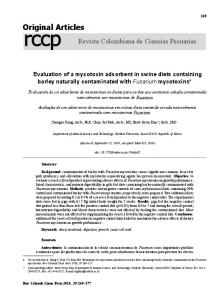
Figure 1 Characterization of the iNRAS mouse melanoma model and experimental design. (a) Transgene mRNA levels after 4 d of doxycycline withdrawal in iNRAS melanomas as determined by RT-PCR. –NRAS indicates doxycycline withdrawal for the number of days indicated. Data are means ± s.e.m. n = 5 tumors per cohort. (b) Western blot of pAkt, Akt, pErk, Erk and Bim from iNRAS cell line 413. Heat shock protein 70 (Hsp70) was used as a loading control. Veh, vehicle. (c) Tumor volumes from four independent iNRAS primary tumors (from one male and three female mice). Arrows indicate the start of doxycycline withdrawal. Different colors are shown for clarity to identify individual mice. (d) The effect of two different MEK inhibitors and doxycycline withdrawal on allograft tumor growth from iNRAS cell line 475 (n = 6 tumors per cohort). QD, daily. Data are means ± s.e.m. (e) Flow chart of the experimental design. Transcriptome data comparing genetic NRASQ61K extinction and pharmacological MEK inhibition is processed through statistical and network analyses to generate RSM genes, pathways and, ultimately, pathway regulators. The tumor growth chart is taken from Figure 5a.
1504
VOLUME 18 | NUMBER 10 | OCTOBER 2012 nature medicine
articles a
b
6
c
MEKi 4 d
0
Mitotic M/G1 phases 5
–NRAS 783
10
364
MEKi 129
Influenze life cycle DNA replication DNA repair
–2 –4
–1
Mitotic prometaphase
2
–5
–2
Cell cycle—mitotic
4
–10
Normalized enrichment score –3
Regulation of B cell development RSM genes
Viral mRNA translation Cell cycle
–6
Telomere maintenance
–NRAS 4 d
Homologous recombination
Cdkn1c Plagl1 Gas1 Psmb10 Psme2 Psmb8 Psmb9 Aif1 Ptprc Prkar2b Ahr Nup37 Pam Ran Ccne2 Aurka Ccdc99 Cenpq Clspn Kif23 Nek2 Cdc20 Plk1 Pole Kif22 Ncaph Pttg1 Nuf2 Prc1 Bub1b Cks2 Ercc6l Mad2l1 Mcm5 Rad51 Ccnb2 Sgol1 Cdk5rap2 Mcm2 Mcm8 Cenpa Cenph Gins1 Gmnn Chek1 Mcm6 Rfc4 Cenpp Cenpk Prim1 Fbxo5 Plk4 Pola1 Lig1 Spc24 Itgb3bp Kif18a Stmn1 Tube1 Cenpj Rcc2 Cit Rfc2 Brca2 Cenpm Cenpn Cks1b Kpna2 Mcm4 Espl1 Pold1 Chek2 Ddx11 Rpa1 Sass6 Prim2 Rfc5 Smc4 Cdkn2d Rpa3 Cntrob Cenpt Mcm7 Xpo1 Fen1 Nup107 Clasp1 Tubb5 Tubg1 Pcbp4 Nup160 Orc3l Rangap1 Ywhaz Ccnd1 Bub1 Anln Cdca8 Rrm2 Aurkb Kntc1 Ndc80 Kif11 Nusap1 Racgap1 Ccnb1 Cenpi Ska1 Cdca5 Ttk Birc5 Tpx2 Kif2c Ube2c Cenpe Sgol2 Ccna2 Cenpf Cdc25c Spc25 Kif20a
d
–1.5
Vehicle
MEKi 1.5
Figure 2 RAS-specific module (RSM) genes are highly enriched for cell-cycle functions. (a) Microarray data. The plot shows log2 fold change values of doxycycline withdrawal (–NRAS) and selumetinib treatment (MEKi) after 4 d compared to vehicle treatment in iNRAS cell line 475 allografts. Each point represents an average value (n = 6 tumors per cohort). RSM genes with Fisher combined P < 10−5 are plotted in red, whereas non-RSM genes (P > 10−5) are shown in blue. (b) Venn diagram showing the overlap in the number of differentially expressed genes shared by both MEKi and NRAS Q61K extinction. (c) The top ten RSM pathways defined by GSEA analysis. Results from the Metacore analyses are shown in Supplementary Table 4. (d) Microarray heatmap of RSM genes from significant GSEA cell-cycle pathways with unsupervised hierarchical clustering.
nature medicine VOLUME 18 | NUMBER 10 | OCTOBER 2012
e 100 80
40 20
P = 0.5
TUNEL+ cells per mm2 Ve hi c M l E e( –N Ki 4 n = 4 R AS d (n ) = 4 7 d (n ) = 8)
60
P = 8 × 10⁻⁴ P = 0.03
Ve h M icle EK –N i 4 (n = R AS d (n 4) = 4 7 d (n ) = 8)
pH3+ cells per mm2
pH3+ cells per mm2
Ve hi c E le –N Ki 4 (n = R 6) A d –N S (n R 4d =4 AS ( n ) 2 = d 6 (n ) = 6)
P = 3 × 10⁻⁴
P = 4 × 10⁻⁴
60 40 20
ic E le –N Ki 4 (n = R 6) A d –N S (n = R 4d AS ( 4) n = 2 6 d (n ) = 6)
0
Ve h
TUNEL+ cells per mm2
c
M
Figure 3 Cellular proliferation is inhibited by NRASQ61K extinction but not MEK inhibition. (a) Representative immunofluorescence staining of iNRAS cell line 413 melanoma allografts to measure proliferation by pH3 staining and apoptosis by TUNEL staining. Scale bars, 100 µm. See also Supplementary Figure 2a. (b,c) Quantification of pH3 (b) and TUNEL (c) positivity in iNRAS 413 allografts. (d,e) Quantification of pH3 (d) and TUNEL (e) positivity in iNRAS 475 allografts. Two-tailed Student’s t tests were used to calculate the P values shown. Data are means ± s.e.m.
–NRAS 4 d
M
MEKi 4 d
Vehicle
Molecular phenotypes of NRASQ61K extinction versus MEKi cell line, iNRAS-475, at 4 d after: doxycycline withdrawal, pharmacoUsing genetic extinction of NRASQ61K as the ‘ground truth’ repre- logical MEK inhibition (daily maximal tolerated doses of selumetinib), senting complete RAS inhibition and pharmacological perturbation or vehicle treatment (n = 6 per group) for transcriptome profiling by MEKi as the comparator, we reasoned that global transcriptomic (Fig. 2a). Using the criteria of a twofold change in expression and a profiles and network modeling could uncover, in an unbiased manner, q value 0.05).
1506
The knowledge-based pathway analysis described above suggested that a major explanation for the inability of pharmacological MEK inhibition to induce tumor regression is its inability to engage the cellcycle checkpoint in iNRAS melanomas. This finding seems counterintuitive given that RAS-MEK-ERK signaling has been intimately linked to cell proliferation25. Thus, we sought to confirm this analytical result by quantifying mitosis and apoptosis in histological sections of tumors derived from two independent iNRAS melanoma cell lines, iNRAS413 and iNRAS-475 (Fig. 3). Staining for phosphorylated histone H3 (pH3) revealed a statistically significant inhibition of mitotic activity after genetic extinction of NRASQ61K in both cohorts (Fig. 3a,b,d and Supplementary Fig. 2a). Consistent with the pathway analysis results, we found no statistically significant changes in mitotic activity, as determined by pH3 staining (Fig. 3a,b,d and Supplementary Fig. 2) or BrdU incorporation (Supplementary Fig. 2b), in tumors treated with the maximally tolerated doses of either selumetinib or GSK1120212 after 4 d of daily dosing. In contrast, TUNEL staining for apoptotic cells revealed a statistically significant induction of apoptosis by both genetic NRASQ61K extinction and pharmacological MEK inhibition (Fig. 3a,c,e and Supplementary Fig. 2a). Correspondingly, Bim and Bmf, which are central to the induction of apoptosis after MAPK pathway inhibition26, were upregulated to similar extents by NRASQ61K extinction and
VOLUME 18 | NUMBER 10 | OCTOBER 2012 nature medicine
articles
© 2012 Nature America, Inc. All rights reserved.
c
100 0
G SK SK + PD
e cl
PD
hi
G
Ve
hi
200
200 150 100 50
G SK SK + PD
0
G
–1
P = 3.2 × 10
–4
g
PD
0
P = 0.04
300
e
1
100
cl
2
d
Casp3+ cells per mm2
b
SB-2
cl e PD G G SK SK + PD
Vehicle (n = 9) PD 100 mg/kg QD (n = 5) GSK 3 mg/kg QD (n = 6) GSK QOD + PD QD (n = 6) –NRAS (n = 4)
200
0
0
20
PD G G SK S K + PD
5 10 15 Time after treatment (d)
Ve
0
2/6 CR
e
4/4 CR
–4
+
–3
10
cl
–2
hi
–1
20
300
hi
+
0
P = 0.06
Ve
pH3 2 cells per mm
1
f
SB-2
30
TUNEL 2 cells per mm
log2 fold change
2
BrdU+ cells per mm2
iNRAS 475
3
Ve
a
log2 fold change
Figure 5 The combination MEK and CDK4/6 inhibition is synergistic in vivo. (a) Mouse cell line iNRAS 475 allografts treated with PD-0332991 (PD) and GSK1120212 (GSK) singly or in combination. Doxycycline withdrawal (–NRAS) is shown for comparison. QD, daily; QOD, every other day; CR, complete response. All data in this figure are means ± s.e.m. (b) Human NRASQ61K cell line SB-2 xenografts treated with PD-0332991 and GSK1120212 singly or in combination. (c,d) Quantification of pH3 (c) and TUNEL (d) positivity in SB-2 tumors after 4 d of treatment. Two-tailed Student’s t tests were used to calculate the P values shown. (e) Representative BrdU and cleaved caspase-3 (Casp3) immunohistochemistry from treated EVOC tumor slices after 3 d of treatment. (f,g) Quantification of BrdU (f) and caspase-3 (g) positivity in EVOC tumor slices. Scale bars, 200 µm.
e DMSO PD-0332991 GSK1120212 100 nM PD selumetinib treatment at both the mRNA and –3 2/6 CR the protein level (Fig. 1b and Supplementary –4 BrdU 0 3 6 9 12 15 18 Fig. 3). Taken together, the experimental data Time after treatment (d) and computational analyses collectively show Vehicle (n = 6) that pharmacological MEK inhibition effiPD 100 mg/kg QD (n = 6) Casp3 GSK 3 mg/kg QD (n = 6) ciently induces apoptosis but not cell-cycle GSK QOD + PD QD (n = 6) arrest, which is in contrast to the dual effect of NRASQ61K genetic extinction. We further reinforced this conclusion using a targeted proteome (Fig. 4c) therefore captures the most significant regulator-pathway analysis by reverse phase protein array (RPPA) profiling of 120 signal- associations within the large compendium of expression profiles. ing proteins and phospho-specific states. Similar to the microarray Using the TRAP network, we investigated which regulators are data, the genetic and pharmacological perturbations showed a high most significantly linked to (that is, are candidate drivers of) the key degree of overlap in global protein changes (Fig. 4a). However, con- pathway differences between genetic and pharmacological perturbasistent with the gene expression analysis results, the most significantly tions in the iNRAS model. We selected the first neighbor regulators differentially modulated RAS-specific protein across the two inde- connected to each of the highest-ranking 41 pathways enriched in pendent cohorts assayed above was the phosphorylated and, thus, the RAS-specific module by GSEA (false discovery rate 0.95. The final filtered compendium consisted of 3,103 microarrays.
© 2012 Nature America, Inc. All rights reserved.
Connecting regulators to pathways through mutual information. The details of the statistical method we used to connect regulators to pathways drew heavily from the context likelihood of relatedness (CLR) method44. The simple modification we used here was to treat regulator gene expression and putative pathway expression as the input, whereas CLR takes gene expression from individual genes as the input. The TRAP algorithm is shown in Supplementary Figure 6 and proceeds in two phases. First, a mutual information matrix, M, is calculated between all pairwise regulators and pathways. Mutual information is calculated as: I ( X ; Y ) = ∑ P (xi , y j ) × log( i, j
P ( xi , y j ) P ( xi ) × P ( y j )
)
where X represents the vector of expression values for the regulator or pathway i, and Y represents the vector of expression values for the regulator or pathway j. The second phase of the TRAP algorithm is to calculate the likelihood that a regulator is connected to a pathway. As shown in Supplementary Figure 6, within M, there is a set of cells where the regulators are the rows and the pathways are the columns (red) and another group of cells where the pathways are the rows and the regulators are the columns (blue). Within these two groups, x −m column j is z-score transformed, zi , j = i , where µ is the column mean, s
σ is the column s.d., and xi is the expression value in row i. This produces two matrices, one representing the significance of the relationship between regulator i and pathway j compared to all possible pathways, and the second representing the significance between i and j compared to all possible regulators. Finally, these two z-scores are combined into a modified z score using Stouffer’s method, S( z i , j , z j , i ) =
z i , j + z j ,i 2
False discovery rates were estimated for the distribution of the modified z scores. For the TRAP network, we set a threshold of false discovery rate