Proceedings of the 2nd WSEAS International Conference on URBAN PLANNING and TRANSPORTATION
Assessing Container Terminal Safety and Security Using Data Envelopment Analysis ELISABETH GUNDERSEN, EVANGELOS I. KAISAR, PANAGIOTIS D. SCARLATOS Department of Civil Engineering Florida Atlantic University 777 Glades Road, Boca Raton, FL 33431 THE UNITED STATES
[email protected] Abstract: - In response to the devastating terrorist attack on September 11, 2001, safety and security of the transportation network have received increased attention. Improving the intermodal transportation connections have been identified as one of the main challenges for enhanced safety, security, and efficiency among the transportation modes. Traffic congestion and aging of the intermodal connections is particularly a rising problem among the nation’s seaports. Container traffic is expected to more than double the next decades which will have an important impact not only on the capacity and operations at the port, but also for the security system dealing with the cargo. It is therefore extremely important to mange the cargo with current and efficient security solutions. Inefficient solutions will increase congestion at the transportation network, especially across modes. Efforts therefore need to be taken for improved safety and security solutions at the intermodal aspects of the seaport terminals to meet the predicted growing market of container traffic and other port services. A Data Envelopment Analysis (DEA) model is developed in this study to assess the efficiency of the safety and security system of container terminals with intermodal links to highway and freight rail lines. The model will identify the best and worst performers in terms of the existing security system at the port. Several safety and security-related variables will be examined to identify potential solutions for improvement. The presented DEA methodology in conjunction with credible data will help managers in decision making for enhanced safety and security solutions for container terminals. Key-Words: - Data Envelopment Analysis, DEA, Intermodal, Security, Safety is important to address this problem because the cargo is most often moved by more than one transportation mode from origin to destination. Keeping the connections efficient and current will therefore help to ensure a smooth flow of goods and reduce errors. A mathematical tool, Data Envelopment Analysis (DEA), will be applied in study to assess and analyze the efficiency of selected container ports in the United States. Fast loading and protection of the goods is some of the key functions of a harbor. A DEA model is therefore designed with safety and security-related variables to optimize the efficiency of the security operations of the intermodal aspect of each selected container port. DEA is a well established mathematical technique that can be applied to analyze the efficiency of homogenous operating units. DEA is a nonparametric method for analyzing relative efficiency of a decision making unit (DMU) which is the entity whose efficiency is to be measured compared to other entities of its kind. Charnes, Cooper, and Rhodes first introduced DEA in 1978.
1 Introduction Container Traffic is expected to more than double the next decades. The United States Department of Transportation (U.S. DOT) has predicted the container traffic to increase from about 50 million TEUs (Twenty-Foot Equivalent Units) in 2007 to 200 million TEUs in 2037 with a five percent annual increase rate. [1] It is therefore extremely important to implement current and efficient security solutions at the intermodal connections to minimize congestion and cost expenditures when the cargo is moved from one transportation mode to another. Being able to evaluate the current safety and security systems at container port terminals is therefore essential in management decision making to identify potential solutions for improvement. Traffic congestion and aging of the intermodal transportation facilities is already a rising problem because the funding for intermodal security is distributed by mode. Port of Miami is a good example where congestion is increasing. The aging of the intermodal aspects of the port cause problems for the freight when moved from vessels to trucks. It
ISSN: 1790-2769
125
ISBN: 978-960-474-102-1
Proceedings of the 2nd WSEAS International Conference on URBAN PLANNING and TRANSPORTATION
only allow for constant return to scale to the BCC model that accommodates technologies that exhibit variable return to scale (VRS). [2] The BCC model has two main approaches; input-oriented and outputoriented. Both approaches will be applied in this study to identify and analyze the efficiency of the current security systems at container terminals. The input-oriented BCC model focuses on optimizing the efficiency by reduction of the inputs, whereas the output-oriented approach focuses on optimizing the efficiency by increasing the output variables. The primal formulations related to these BCC models are presented next.
They developed the CCR model that was an optimization method for measuring relative efficiency by multiple-output/multiple-input cases. [2] They generalized Farrell’s (1957) singleoutput/input technical-efficiency measure to a multiple-output/multiple-input case by constructing a single “virtual” output to a single “virtual” input relative-efficiency measure. According to Charnes et al. the relative efficiency of any DMU is measured by forming the ratio of a weighted sum of outputs to a weighted sum of inputs, where the weights for both outputs and inputs are to be selected in a manner that calculates the Pareto efficiency measure of each DMU subject to the constraint that no DMU can have a relative efficiency score greater than one. [3] The efficiencies captured by a DEA model are relative because they reflect scope for resource conservation or output augmentation at one unit relative to other comparable benchmark units rather than in some absolute sense. In many practical situations there is also a lack of sufficient information to derive the absolute efficiency. [4] DEA methodology can be utilized in a variety of fields. It has been applied to areas such as universities, warehouses, benchmarking, health care systems, banking, and transportation. DEA, in conjunction with other arithmetic methods, has been applied a number of times to assess the efficiency of container terminals and ports, both from technical and economical standpoints. For instance, Kaisar et al. applied DEA to analyze port productivity in the US. [5] Also, Turner et al. used DEA methodology to measure containerport productivity. [6] The methodology presented here, however, focuses on the safety and security aspect of the port operations to maximize the efficiency when cargo is moved from one mode of transportation to another.
2.2 Input-Oriented BCC Primal The BCC DEA model for assessing input efficiency of DMUj is shown in formulation (1). The InputOriented BCC Primal model shown in formulation (1) was introduced by Charnes et al. [3] →
(1)
θ ,λ ,s ,s
s.t.
Yλ − s + = Yo
θX o − Xλ − s − = 0 →
1λ ≥1 λ,s + ,s − ≥ 0 where: zo: efficiency score. θ: scalar variable by which the current input level has to be multiplied with in order to increase efficiency. s+, s-: vectors that contain the output and input slacks, respectively. ε: a non-Archimedean constant that allows the minimization over θ to preempt the optimization involving the slacks. λ: intensity vector. Y, X: Y is a non-negative output matrix and X a non-negative input matrix, with ith columns Yi and Xi, respectively.
2 Methodology 2.1 DEA Concept DEA is a method to analyze relative efficiency by optimizing on each DMU that is being assessed. The focus of DEA is to optimize on each DMU rather than forming population averages. DMUs that are considered efficient by DEA validate the following; for a given input, X, there is no other facility that gives a higher output, Y. The result from the DEA assessment also provides benchmarks that inefficient DMUs can relate to. Banker, Charnes, and Cooper developed one of the most utilized DEA models these days, i.e. the BCC model. They extended the CCR model that
ISSN: 1790-2769
→
min zo = θ − ε ⋅ 1 s + − ε ⋅ 1 s − + −
The evaluation of each DMUj, j = 1, 2, . . . , n, are characterized by different parameters. The scalar variable θj , 0 < θj ≤ 1 is the proportional reduction applied to all inputs of DMUo. The subscript (o) denotes the DMU whose efficiency is being evaluated. The parameter λj = (λj1, λj2, . . . , λjn) is a vector describing the percentages of reference to the efficient DMUs. The input-oriented model attempts via θ to minimize the input without increasing the given output level. Since ε allows the
126
ISBN: 978-960-474-102-1
Proceedings of the 2nd WSEAS International Conference on URBAN PLANNING and TRANSPORTATION
minimization over θ to preempt the optimization involving the slacks, the optimization can be computed in two stages: 1) maximal reduction of inputs being achieved first via θ; and 2) movement onto the efficient frontier via the slack variable s+ and s-. [3]
be assessed. Table 1 comprises all the chosen input and output variables together with appropriate short forms. After selecting the variables, the related data must be assembled for the given time period. Data gathering is a complex process because some of the variables consist of sensitive security information. The data for the input variables has been estimated whereas the data for the three output variables are obtained from the Bureau of Transportation Statistics and the American Association of Port Authorities.
2.3 Output-Oriented BCC Primal In the output-oriented approach, the focus shift from minimizing the input to maximizing the output. The BCC DEA model for assessing output efficiency of DMUj is shown in formulation (2). The OutputOriented BCC Primal model shown in formulation (2) was introduced by Charnes et al. [3] →
Table 1 Input and Output Variables Variable # Inputs 1i
→
max zo = Φ + ε ⋅ 1 s + + ε ⋅ 1 s − + −
(2)
φ ,λ ,s ,s
s.t.
ΦYo − Yλ + s + = 0
2i
Xλ + s − = X o
3i
→
1λ =1 λ,s + ,s − ≥ 0
4i
where: zo: efficiency score. Φ: scalar variable by which the current output level has to be multiplied with in order to increase efficiency. s+, s-: vectors that contain the output and input slacks, respectively. ε: allows the maximization over Φ to preempt the optimization involving the slacks λ: intensity vector. Y, X: Y is a non-negative output matrix and X a non-negative input matrix, with ith columns Yi and Xi, respectively.
Outputs 1o 2o 3o
Short Form
Number of security checkpoints for cargo Number of police/law enforcement officers Number of safety and security-related incidents Number of safety and security-related accidents
Sec. check. cargo Law enf. off.
Millions of short tons Total port calls Container port traffic in TEU volume
Short Tons Port Calls TEU
Incidents
Accidents
3 Case Study Application For this study, 18 containerport terminals in the United States have been chosen for the assessment of the proposed DEA model. Table 2 shows the selected containerports for this study. These ports are ideal for the study area because they present the major containerport terminals in the US in terms of TEU volume, tons of freight, and port calls. [5] The time period for the study is eight years, from 2000 to 2007. This time frame is mainly chosen because of the latest availability of data and statistics. In order to validate the developed DEA model for this study, several scenarios have been applied and investigated. A Microsoft Excel add-in developed by Zhu has been used to measure the relative efficiency of the selected containerport terminals. [7] The DEAFronter measures the following: relative efficiency, targets, slacks, and benchmarks. Both the input-oriented and the output-oriented approaches have been applied in the assessment.
The output-oriented model attempts via Φ to maximize the output without reducing the given input level. The non-Archimedean constant, ε, allows the maximization over Φ to preempt the optimization involving the slacks. Thus, the optimization can be computed in two stages: 1) maximal expansion of outputs being achieved firs via Φ; and 2) movement onto the efficient frontier via the slack variable s+ and s-. [3]
2.4 Selection of Variables When developing a DEA model, the selection of input and output variables is very important. It is critical to include all inputs that impact the outcome and capture all the considerable outcomes that are to
ISSN: 1790-2769
Definition
127
ISBN: 978-960-474-102-1
Proceedings of the 2nd WSEAS International Conference on URBAN PLANNING and TRANSPORTATION
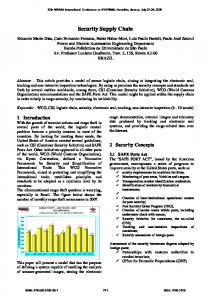
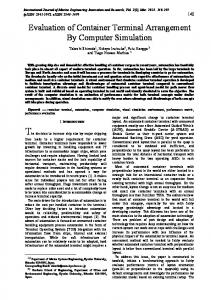
whereas Figure 2 shows the efficiency score obtained under output maximization. It is apparent from both approaches that several ports can improve the efficiency of their security system by either reducing the input or increasing the output. For example, Port Manatee that stands out as one of the worst performers could either try to enhance their efficiency by reducing their input data, increasing their operations, or a combination of the two. The DEA model also calculates targets and benchmarks that inefficient ports can relate to when trying to improve efficiency. The target will show optimal values for all the input and output variables for each containerport terminal in the assessment. The benchmarks on the other hand will indicate what port/ports an inefficient port should measure itself up to when trying to optimize efficiency.
Table 2 Sample of Containerports Port # 1 2 3 4 5 6 7 8 9 10 11 12 13 14 15 16 17 18
Port Name Los Angeles Long Beach New York Seattle Tacoma Savannah Houston Norfolk Oakland Charleston Port Everglades Miami Palm Beach Canaveral Tampa Jacsonville Port Manatee San Diego
4 Conclusion There is a need for efficient and current security systems at container terminals to meet the predicted growing market of container traffic and other port services. Improved security solutions will also facilitate economic development and help to keep the United States safe from terrorist attacks and other threats. The contribution of the study is a mathematical model that can measure the efficiency of the security systems at containerport terminals. The resulted DEA methodology can be used to assess the relative efficiency of the security operations at containerport terminals. The mathematical model is general in its framework and can therefore also be applied to other containerport terminals in the United States or globally. The success of the mathematical model, however, depends on the accurate and reliable data from several sources. Since the study involves sensitive security information of large containerport terminals, the accuracy of the estimated data is questionable, in some respects. Availability of data, complimented with the presented DEA methodology will help managers in decision making for enhanced safety and security solutions for containerport terminals. Decision makers, however, need to carefully evaluate different aspects of the terminal operations when considering improving the efficiency level of an inefficient container terminal. Lowering the number of law enforcement officers for example might make the port more efficient because one of the input variables is reduced, but it will also possibly result in more accidents and incidents and consequently lowering the efficiency again.
1 Results and Analysis To develop a DEA model to assess the efficiency of the security systems at containerport terminals, a variety of scenarios have been applied and analyzed. Both the input-oriented and output-oriented DEA approaches have been applied for the assessment. For both approaches, the DMUs receiving efficiency equal to 1 are relative efficient compared to the other DMUs in the model. For the input-oriented approach, the DMUs receiving efficiency less than 1 is inefficient, whereas for the output-oriented approach the DMUs receiving efficiency greater than 1 is inefficient. A scenario presenting the DEA model with the proposed variables and the 18 containerports are presented next. For the presented scenario in this study, an assessment of the 18 seaports together with the selected variables has been carried out for the full time period, 2000 - 2007. A sample of the data collected for 2007 is shown in Table 3. Given the 18 port terminals studied over an eight year period, the maximum sample size would be 144 observations. The availability of data, however, will affect the actual sample size. Because the DEA model requires values greater than zero for all variables, missing data within any observation will result in an exclusion of that observation from the sample. San Diego was therefore not included in the DEA model for 2000 and 2001 because the port did not have any reported TEU volume for these years. Consequently, the number of observations for this scenario was 142. Figure 1 illustrates the efficiency score obtained by the DEA model under input minimization,
ISSN: 1790-2769
128
ISBN: 978-960-474-102-1
Proceedings of the 2nd WSEAS International Conference on URBAN PLANNING and TRANSPORTATION
Table 3 Data for the Containerport Terminals for 2007 DMU No.
1 2 3 4 5 6 7 8 9 10 11 12 13 14 15 16 17 18
DMU Name
Los Angeles, 2007 Long Beach, 2007 New York, 2007 Seattle, 2007 Tacoma, 2007 Savannah, 2007 Houston, 2007 Norfolk, 2007 Oakland, 2007 Charleston, 2007 Port Everglades, 2007 Miami, 2007 Palm Beach, 2007 Canaveral, 2007 Tampa, 2007 Jacksonville, 2007 Port Manatee, 2007 San Diego, 2007
Sec. Check. Cargo (1i)
Law Enf. Off. (2i)
6 7 9 4 4 3 9 4 3 4 4 2 1 1 6 4 2 1
236 206 199 111 101 147 100 103 135 99 80 75 21 15 187 60 23 50
Accidents
Short Tons
(3i)
(4i)
(1o)
(2o)
(3o)
35 31 30 17 15 22 15 15 20 15 12 11 3 2 28 9 3 8
17 14 14 8 7 10 7 7 9 7 6 5 1 1 13 4 2 4
67.2 85.5 158.6 29.0 26.9 35.1 223.1 35.2 17.6 27.4 25.8 11.2 4.5 6.0 47.1 23.2 6.1 5.4
2747 2747 5201 1258 1347 2475 6250 802 2028 2171 1254 1378 133 120 1064 1312 169 338
8355039 7316465 5299105 1973505 1924934 2604312 1768627 1829231 2388182 1754376 948680 884945 249931 760 39653 710073 4818 93671
Incidents
Port Calls
TEU
Input-Oriented Approach Los Angeles Long Beach
1.10
New York 1.00
Seattle Tacoma
Efficiency
0.90
Savannah Houston
0.80
Norfolk 0.70
Oakland Charleston
0.60
Port Everglades Miami
0.50
Palm Beach 0.40
Canaveral Tampa
0.30 2000
2001
2002
2003
2004
2005
2006
2007
Year
Jacksonville Port Manatee San Diego
Fig. 1 Input-oriented VRS efficiency for scenario 1.
ISSN: 1790-2769
129
ISBN: 978-960-474-102-1
Proceedings of the 2nd WSEAS International Conference on URBAN PLANNING and TRANSPORTATION
Output-Oriented Approach Los Angeles Long Beach
8.00
New York Seattle
7.00
Tacoma
Efficiency
6.00
Savannah Houston
5.00
Norfolk Oakland
4.00
Charleston 3.00
Port Everglades Miami
2.00
Palm Beach Canaveral
1.00
Tampa 0.00
Jacksonville 2000
2001
2002
2003
2004
2005
2006
2007
Year
Port Manatee San Diego
Fig. 2 Output-oriented VRS efficiency for scenario 1. References: [1] U.S. DOT (2007). “The Maritime Administration and the U.S. Marine Transportation System: A Vision for the 21st Century”, Washington, DC, USA. [2] Ray, S.C. Data Envelopment Analysis: Theory and Techniques for Economics and Operations Research, Press Syndicate of the University of Cambridge, UK, 2004. [3] Charnes, A., W. W Cooper, A. Y. Lewin, and L. M. Seiford. Data Envelopment Analysis: Theory, Methodology, and Application, Kluwer Academic Publishers, USA, 1994. [4] Thanassoulis, E. Introduction to the Theory and Application of Data Envelopment Analysis: A Foundation Text with Integrated Software, Kluwer Academic Publishers, USA, 2001. [5] Kaisar, E. I., S. Pathomsiri, and A. Haghani. Efficiency Measurement of US Ports Using Data Envelopment Analysis. National Urban Freight Conference, February 1-3, 2006. [6] Turner, H., R. Windle, and M. Dresner. North American containerport productivity: 1984 – 2997. Transportation Research, Part E, 40, 2004, pp. 339-356. [7] Zhu, J. Quantitative Models for Performance Evaluation and Benchmarking; Data Envelopment Analysis with Spreadsheet and DEA Excel Solver, Kluwer Academic Publisher, Boston, USA, 2002.
ISSN: 1790-2769
130
ISBN: 978-960-474-102-1