Jul 13, 2016 - ii. DECLARATION AND APPROVAL. I, CAESAR AGULA, hereby declare that with the exception of quotations and references duly cited, this ...
www.udsspace.uds.edu.gh
UNIVERSITY FOR DEVELOPMENT STUDIES, TAMALE
ASSESSING ECOSYSTEM-BASED FARM MANAGEMENT PRACTICES IN THE KASSENA-NANKANA AREA: A STUDY OF GOVERNMENT AND COMMUNITY MANAGED IRRIGATION SCHEMES.
BY
CAESAR AGULA (UDS/MEC/0026/14)
THIS THESIS IS SUBMITTED TO THE DEPARTMENT OF AGRICULTURAL AND RESOURCE ECONOMICS, FACULTY OF AGRIBUSINESS AND COMMUNICATION SCIENCES, UNIVERSITY FOR DEVELOPMENT STUDIES, NYANKPALA CAMPUS, IN PARTIAL FULFILMENT OF THE REQUIREMENTS FOR THE AWARD OF MASTER OF PHILOSOPHY DEGREE IN AGRICULTURAL ECONOMICS
JULY, 2016 i
www.udsspace.uds.edu.gh
DECLARATION AND APPROVAL I, CAESAR AGULA, hereby declare that with the exception of quotations and references duly cited, this thesis entitled “Assessing Ecosystem-Based Farm Management Practices in the Kassena-Nankana Area: A study of Government and Community Managed Irrigation Schemes” is entirely my own original work and it has not been submitted in part or whole for any degree in the University for Development Studies or elsewhere. Candidate:
Date:
…………………………………………………………..
……………………………….
CAESAR AGULA We hereby declare that the preparation of this thesis was supervised in accordance with the guidelines on supervision of thesis laid down by the University for Development Studies, Nyankpala.
Principal Supervisor:
Date:
…………………………………………………………..
………………………………
PROF. SAA DITTOH
Co-Supervisor :
Date:
…………………………………………………………..
………………………………
MR. FRANKLIN NANTUI MABE
ii
www.udsspace.uds.edu.gh
DEDICATION This work is dedicated to my dear mother Mrs. Beatrice Nyabase.
iii
www.udsspace.uds.edu.gh
ACKNOWLEDGEMENT This study has been made possible due to many players worth mentioning and of which I am highly indebted. Unfortunately, a few can only be mentioned here. First of all, I wish to thank the almighty God for his grace, strength and wisdom given to me to come out with this study. Funding has been by a CGIAR Water, Land and Ecosystems Project titled “Giving ‘latecomers’ a head start: Reorienting irrigation investment in the White Volta basin to improve ecosystem services and livelihoods of women and youth” led by Ghana Irrigation Development Authority (GIDA) with International Water Management Institute (IWMI), University for Development Studies (UDS) and Women in Agriculture Development (WIAD) as collaborators. Many thanks also go to my principal supervisor, Prof. Saa Dittoh for his supervisory role and fatherly advice that helped me significantly during the study. I also appreciate the support, direction and patience given to me by my co-supervisors, Mr. Franklin Nantui Mabe and Dr. Mamudu Abunga Akudugu. I would also want to acknowledge the support from all the lecturers in the Department of Agricultural and Resource Economics at the University for Development Studies, Nyankpala for the great tuition and suggestions towards shaping this work. My special thanks also go to the school I teach, St. Bernadette’s Technical Institute for giving me the opportunity to further my studies. I thank my dear auntie, Judith Bawah Agula and my friend Vivian Acharitune for the moral and emotional support given to me during the study. Lastly, I wish to acknowledge the encouragement and prayer support given to me by my wonderful family. Thank you all.
iv
www.udsspace.uds.edu.gh
ABSTRACT The contribution of irrigation farming to food security, nutrition, employment and poverty alleviation cannot be overemphasized in the savannah zone of Ghana of which Kassena-Nankana area is part. The main objective of the study was to assess the use of ecosystem-based farm management practices (EBFMPs) in government and community managed irrigation schemes within the Kassena-Nankana area and how these EBFMPs affect farmers’ livelihood. The study used data collected from 300 irrigating households (150 each for governmentmanaged irrigation scheme (GIS) and community managed irrigation schemes (CIS)). Farmers’ willingness to pay for EBFMPs sustainability was elicited by the contingent valuation method (CVM). The Poisson and negative binomial models, which were employed to determine the factors that influence farmers’ intensity of using EBFMPs indicated that age, distance of irrigated farm from home, farmers’ perception of soil fertility, farmers’ knowledge of EBFMPs, number of extension visits and the type of irrigation scheme were statistically significant. The t-test (mean comparison) also concluded that farmers under CIS significantly have higher mean willingness to pay (WTP) amount than those under the GIS. It was also revealed by a treatment effect model (regression adjustment) that a decision to use high number of EBFMPs causes an improvement on farmers’ average livelihood status score (ALSS), which is significant at 1%. The study concluded that there was low adoption of EBFMPs by farmers in the study area. However, those under CIS employed more EBFMPs than those under GIS. The study therefore recommends that policy implementers and development partners should revise their “yield emphasis” and intensify their extension activities to educate farmers on the use of EBFMPs. Again, the study recommends that more programs and projects should be tailored on sustainable production systems since those have greater positive impact on farmers’ livelihoods.
v
www.udsspace.uds.edu.gh
TABLE OF CONTENTS DECLARATION AND APPROVAL
ii
DEDICATION
iii
ACKNOWLEDGEMENT
iv
ABSTRACT
v
LIST OF ABBREVIATIONS
xi
LIST OF TABLES
xiii
LIST OF FIGURES
xiv
LIST OF PICTURES
xv
CHAPTER ONE: INTRODUCTION
1
1.1 Background
1
1.2 Problem Statement
3
1.3 Research Questions
5
1.4 Research Objectives
6
1.4.1 Main objective
6
1.4.2 Specific objectives
6
1.5 J ustification for the Research
6
1.6 Organization of the Thesis
8
CHAPTER TWO: LITERATURE REVIEW
9 vi
www.udsspace.uds.edu.gh
9
2.1 The Concept of Ecosystem 2.2 Services of Ecosystems
11
2.3 Ecosystem-Based Farm Management Practices
14
2.4 Importance of EBFMPs to Agriculture
15
2.4.1 Compost/ organic manure application
15
2.4.2 Conservative tillage
16
2.4.3 Inter-cropping with legumes
17
2.4.4 Crop rotation
17
2.4.5 Mulching
18
2.4.6 Conservation of vegetation or trees
18
2.4.7 Efficient drainage system (canals)
19
2.4.8 Soil or stone bunding
19
2.5 Meaning of Adoption
20
2.6 Factors Influencing the Adoption of EBFMPs
20
2.7 Types of Irrigation Management Systems in Ghana
23
2.8 The Importance of Irrigation in Northern Ghana
26
2.9 Theory of Adoption and Empirical Review
27
2.9.1 The theoretical framework of EBFMPs adoption
27
2.9.2 The theory of Poisson and negative binomial modeling
29
vii
www.udsspace.uds.edu.gh
2.9.3 Empirical review of adoption of EBFMPs
34 35
2.10 Valuation of Ecosystem Services 2.10.1 The theoretical concept of contingent valuation method
38
2.10.2 Empirical Review of Contingent Valuation Method for EBFMPs
40 41
2.11 Livelihoods and Ecosystem Services 2.11.1 The theoretical concept of treatment effect model (Adjustment regression)
45
2.12 Summary of Key Findings of the Literature Review and Conclusion
47
CHAPTER THREE: METHODOLOGY
49
3.1 The Study Setting
49
3.2 Sampling Procedure and Sample Size
51
3.2.1 Sampling procedure
51
3.2.2. Sample size determination
52
3.3 Type of Data Collected and Instruments Used
53
3.4 Analytical Framework
53
3.4.1 Identification and description of EBFMPs used by farmers in KNA
53
3.4.2 Estimating factors influencing the adoption of EBFMPs in KNA
54
3.4.2.1 Empirical model for identifying the determinants of EBFMPs
54
3.4.3 Computing WTP value for EBFMPs sustainability and willingness to pay levels
57
3.4.4 Estimating the effects of using EBFMPs on livelihoods of farmers
58
viii
www.udsspace.uds.edu.gh
3.4.4.1 Empirical representation of treatment effects
58
3.5.3.2 Livelihood indicators and measurement of ALSS of farmers
60
3.5.3.3 Development of farmers’ Average Livelihood Status Score (ALSS)
65
CHAPTER FOUR: RESULTS AND DISCUSSION
67
4.1 Socio-Demographic Characteristics of Farmers
67
4.2 EBMFPs Adopted by Farmers under CIS and GIS
72
4.2.1 Application of compost/organic manure
72
4.2.2 Conservative tilling
74
4.2.3 Inter-cropping with legumes
76
4.2.4 Efficient drainage system
78
4.2.5 Mulching
80
4.2.6 Conservation of vegetation
82
4.2.7 Crop rotation
83
4.2.8 Soil bunding
85
4.3 Factors Influencing EBFMPs Adoption by Farmers in Irrigation
87
4.4 Valuation of Ecosystem-Based Farm Management Practices
92
4.5 Effects of EBFMPs Adoption on the Livelihoods of Farmers
94
CHAPTER FIVE: SUMMARY, CONCLUSIONS AND RECOMMENDATIONS
100
5.1 Summary
100 ix
www.udsspace.uds.edu.gh
5.2 Conclusions
101
5.3 Policy Recommendations
102
5.4 Limitations of the Study
103
5.5 Suggestions for Future Research
103
REFERENCES
104
Appendix A
112
Appendix B
122
Appendix C
126
Appendix D
127
x
www.udsspace.uds.edu.gh
LIST OF ABBREVIATIONS ALSS
Average Livelihood Status Score
ATE
Average Treatment Effect
ATET
Average Treatment Effect on the Treated
CA
Conservation Agriculture
CAADP
Comprehensive Africa Agriculture Development Programme
CIS
Community-Managed Irrigation Schemes
CV
Compensating Variation
CVM
Contingent Valuation Method
EBM
Ecosystem-Based Management
EBFMPs
Ecosystem-Based Farm Management Practices
ECOWAP
ECOWAS Agricultural Policy
EV
Equivalent Variation
FASDEP II
Food and Agricultural Sector Development Policy II
GIDA
Ghana Irrigation Development Authority
GIS
Government-Managed Irrigation Scheme
GLSS
Ghana Living Standards Survey
GSS
Ghana Statistical Service
HTS
Highest Total Score
IC
Indifference Curve
ICOUR
Irrigation Company of Upper Region
IFFS
Individual Farmer's Field Score
IFPMS
Individual Farmer's Possible Maximum Score
xi
www.udsspace.uds.edu.gh
IFIPS
Individual Farmer's Indicator Percentage Score
IPM
Integrated Pests Management
IUCN
International Union for Conservation of Nature
IWMI
International Water Management Institute
LTS
Lowest Total score
MA
Millennium Ecosystem Assessment
MoFA
Ministry of Food and Agriculture
NGO
Non-Governmental Organisation
POM
Potential Outcome Mean
UDS
University for Development Studies
UNDP
United Nation Development Programme
WTA
Willingness to Accept
WTP
Willingness to Pay
xii
www.udsspace.uds.edu.gh
LIST OF TABLES Table 3.1
Definition of variables and apriori expectations for adoption models........….....56
Table 3.2
Definition of variables and apriori expectations for treatment effect model.......60
Table 4.1
Summary statistics of categorical variables …...…………………………….….70
Table 4.2
Summary statistics of continuous variables …………………………………….71
Table 4.3
Distribution of compost/organic manure application in CIS and GIS. ....………72
Table 4.4
Distribution of farmers intercropping with legumes in CIS and GIS..………….77
Table 4.5
Distribution of vegetation conservation in CIS and GIS...................……….… .83
Table 4.6
Coefficient estimates for factors that influence EBFMPs adoption......................91
Table 4.7
T-test (mean comparison) of farmers’ WTP value for EBFMP sustainability…..93
Table 4.8
Average treatment effect (ATE) on farmers’ livelihoods ……………….…..…..96
Table 4.9
Average treatment effect on the treated (ATET)...…..………………………......97
Table 4.10 Potential outcome means (POMs) of farmers...............................……......……...99
xiii
www.udsspace.uds.edu.gh
LIST OF FIGURES Figure 2.1
Classification and relationships among ecosystem services …………….....12
Figure 2.2
Indifference curve showing WTP…………………………………………...39
Figure 2.3
Strengths and limitations of CVM…………………………………………..41
Figure 3.1
A map of Kassena-Nankana area in Upper East Region of Ghana………....40
Figure 3.2
Diagram showing the sampling procedure and sample size………………...52
Figure 4.1
Distribution of conservative tilling in CIS and GIS.....................................75
Figure 4.2
Distribution of efficient drainage systems in CIS and GIS.................... …...79
Figure 4.3
Distribution of mulching in CIS and GIS…….......................................…....81
Figure 4.4
Distribution of crop rotation in CIS and GIS.................................................85
Figure 4.5
Distribution of soil bunding in CIS and GIS...…...........................................86
Figure 4.6
Proportion of farmers willing to pay for EBFMPs sustainability...................93
Figure 4.7
Percentages of livelihood indicators...............................................................95
xiv
www.udsspace.uds.edu.gh
LIST OF PICTURES Plate 1
Organic manure application in Saboro irrigation scheme ……………………….73
Plate 2
Inter-cropping of leafy vegetables with beans in Saboro community …………...78
Plate 3
Leaking water pumps and dugouts in Biu and Saboro communities……………..79
Plate 4
Mulching of tomatoes farm in Paga-Nania ……………………………………....81
Plate 5
Nature of vegetation in Biu and Pungu-Telania ……………………………….....83
Plate 6
Soil bunding in Biu ………………………………………………………...….....87
xv
www.udsspace.uds.edu.gh
CHAPTER ONE INTRODUCTION 1.1 Background Many farmers and households particularly in Africa depend on irrigation farming to augment rain-fed agriculture for food and general sustenance of livelihoods. However, recent years have witnessed a rise of concern about the environmental risk associated with modern farming practices (Rezvanfar et al., 2009), which irrigation farming is part. One of the major constraint of crops production is balancing higher yield and maintaining the fertility of the soil (Raghu and Manaloor, 2014). According to Sterve (2011), sustaining soil fertility is gaining greater concern because of increase in population growth, which is mounting pressure on agricultural lands for more food and as a medium of achieving the UN millennium development goal of eradicating hunger. Following Sterve (2011), the demand from the current population has so far been met through intensification of agriculture by adopting new technologies which often fail to take account of the biological functioning of farmlands regaining fertility. However, Rezvanfar et al. (2009) noted that sustainable farm management practices can help maintain the fertility of agricultural lands and balance nutrients requirement of crops. Crop loss due to pests and diseases is another major constraint that farmers face in their production activities (Raghu and Manaloor, 2014). Most farmers thereby resort to the use of chemical methods to control pests and diseases (Pathak, 2002; Sharma et al., 2002) which continue to be a huge cost and a burden to most poor farmers especially those in the rural areas. Meanwhile, Pathak (2002) acknowledges the existence of indigenous farm practices that are capable of controlling pests and diseases in many rural communities. As noted by Power (2010) also, the
1
www.udsspace.uds.edu.gh
use of ecosystem-based farm management practices (EBFMPs) or sustainable farm practices generally have the potential of not only managing soil fertility but also checking the prevalence of pests and diseases on agricultural lands. The reason being that, EBFMPs such as rotating crops from different botanical families can help control chronic soil diseases and as well fix nitrogen in the soil (Rodale, 2011). Beyond improving soil fertility and curbing the prevalence of pests and diseases, application of ecosystem-based farm management practices (EBFMPs) help to maintain the health of ecosystems at farm-level. According to Thiaw et al. (2011), EBFMPs sustain the services provided by the ecosystems such as fruits, fish, fiber, fuel, fresh water and among others. The other services apart from the provisioning services noted by Thiaw et al. (2011) include supporting services (e.g nutrients cyclining, soil formation and primary production), cultural services (e.g. aesthetic and education) and regulatory services that maintain the ecological temperature and precipitaion within the geographical space of the farm land (Sandhu et al., 2010). Generally, the health of the agro-ecosystems is very important and sustains people's livelihoods particularly in Africa since most people in the continent depend on the ecosystems for the provision of water for irrigation farming and other economic engagements (Egoh et al., 2012). However, the functioning of all the services of the agro-ecosystems depend on the practices adopted in production (IUCN, 2010). As in many developing countries, the type of farm practices used by farmers in Ghana has an implication on the health of the agro-ecosystems and people’s livelihoods. Most of the challenges farmers encounter in Ghana, particularly with irrigation farming can be minimized depending on the practices used at the farm level. The reason being that, irrigation as an economic activity goes beyond the production of crops because of the direct effect of its
2
www.udsspace.uds.edu.gh
activities or practices on the ecosystems and the environment as a whole (Dale and Polasky, 2007). The resilience of the ecosystems within any irrigation scheme can boost the growth of crops and reduce the cost farmers incur on production (IUCN, 2010). It is in the light of this that a study to assess ecosystem-based farm management practices in community and government managed irrigation schemes in northern Ghana is relevant. Irrigation is important because it accounts for about 40% of the global food production and remains the corner block of agriculture in Ghana (Kyei-Baffour and Ofori, 2007). Most of the people in Kassena-Nankana area (where the study sites are located) rely very much on irrigation farming for improvements in their income levels, food security and general livelihoods (Seidu, 2011). Again, the ecological conditions in the northern savannah zone where the study sites are found do not allow for an allyear round rain-fed agriculture and as such, most people are engaged in irrigation farming (Dinye, 2013). Considering this limitation on all-year round rain-fed farming, it becomes relevant to examine farmers’ choice of farming practices in irrigation and their implication on the ecosystems.
1.2 Problem Statement The adoption of sustainable land management practices is one of the important objectives of many programmes and policies in the Sub-Sahara region of Africa and the continent as a whole. One of such programmes is the Comprehensive Africa Agriculture Development Programme (CAADP), which highlighted sustainable land management as its first pillar (Oxfam, 2012; Zimmermann et al., 2009). The other regional and national policies in the continent include ECOWAS Agricultural Policy (ECOWAP) and Food and Agricultural Sector Development Policy II (FASDEP II) respectively. All these policies and programmes are geared towards ensuring that the demand for food by an increased population growth does not compromise the 3
www.udsspace.uds.edu.gh
biological sustainability of agricultural lands (Oxfam, 2012). However, the response to these policies and programmes, especially in Sub-Saharan Africa has been low (Abdul-Hanan et al., 2014). Most farmers in that sub-region of Africa are characterised by farm-based practices that are not environmentally sustainable. In Ghana, the story remains the same since the core objective of most interventions on farming are geared towards higher yield with little recognition on sustainability. For example, the focus of Ministry of Food and Agriculture (MoFA) in Ghana has also been on improving factor productivity through dissemination of yield enhancing technologies (Abdul-Hanan et al., 2014). The main objective of most of these yield enhancing technologies is to improve food supply (Sterve, 2011), which most often has negative effect on the biological functioning of the agro-ecosystems. According to Davari et al. (2010), the effect of adopting high yield enhancing technologies on the ecosystems extend further to affect most poor people’s livelihoods that depend on the services of the ecosystems. That notwithstanding, other organisations (including the Food and Agriculture Organisation of the United Nations, 2010) have advocated for Conservation Agriculture (CA) with the aim to increase crop production and as well use more sustainable practices (Sterve, 2011) but has not yielded the expected results. Most farmers are still using farm practices that are not sustainable to the ecosystems and the environment in general. In addition, many studies (including Ngwira et al., 2014; Nkegbe and Shankar, 2014; Raghu and Manaloor, 2014) have been carried out on adoption of sustainable farm technologies and report that farmers are not fully adopting these sustainable technologies as noted earlier by Abdul-Hanan et al. (2014). This also applies to most irrigation schemes in northern Ghana of which the Kassena-Nankana area is part.
4
www.udsspace.uds.edu.gh
There has been uneven attention on community-managed and government managed irrigation schemes. According to Dittoh et al. (2013), the attention given to community-based irrigation schemes (small scale irrigation schemes) has been recent and not even the same magnitude is given to government–managed irrigation schemes such as Tono irrigation scheme. Again, a lot of the studies (e.g. Armah et al., 2013; Nkegbe and Shankar, 2014) that have been carried out on adoption of sustainable farm practices in northern Ghana have paid little attention to farmers’ value of indigenous sustainable farm practices and how it might affect the intensity of using ecosystem-based farm management practices. This study therefore contributes to filling the gap in research by determining the factors that account for farmers’ intensity of using EBFMPs in both community-managed and governmentmanaged irrigation schemes and their willingness for the sustainability of these practices. It also provided the difference in levels at which the two types of irrigation schemes are using these sustainable farm practices. Again, the study also provided an opportunity to compare how livelihoods are affected by the adoption of the EBFMPs by farmers in government-managed and community-managed irrigation schemes.
1.3 Research Questions The main research questions are as follows: 1. What farming practices exist in the government and community managed irrigation schemes? 2. What factors influence the adoption of ecosystem-based farm management practices by farmers? 3. Are farmers willing to pay for the sustainability of the ecosystem-based farm management practices and how much are they willing to pay? 5
www.udsspace.uds.edu.gh
4. What is the effect of ecosystem-based farm management practices on farmers' livelihoods?
1.4 Research Objectives 1.4.1 Main objective The main objective of the research is to assess how ecosystem-based farm management practices in government and community managed irrigation schemes in the Kassena-Nankana area affect the livelihoods of farmers. 1.4.2 Specific objectives Specifically, the study seeks to: 1. Identify and describe the ecosystem-based farm management practices in government and community managed irrigation schemes. 2. Examine the factors that influence the adoption of ecosystem-based farm management practices by farmers. 3. Compute the proportion of farmers willing to pay for the sustainability of the ecosystembased farm management practices and estimate the ‘willingness to pay’ value. 4. Analyse the effect of ecosystem-based farm management practices on the livelihood outcomes of farmers.
1.5 Justification for the Research Irrigation farming has become a major source of livelihood for most irrigators in the Kassena-Nankana District and eventually turning the district into a hub of fresh vegetables for the region and beyond. Unfortunately, the indigenous farming practices or the EBFMPs that 6
www.udsspace.uds.edu.gh
existed to maintain the resilience of agro-ecosystems are currently being traded-off solely for greater output by farmers under the umbrella of intensification of agricultural activities (Sterve, 2011). Meanwhile, this tradeoff is done without much recognition of the contributing services of the EBFMPs and the repercussions of their activities on future output (Norris, 2012). In the light of that, studies on ecosystem-based farm management practices in the district serve as guide and provide evidence to most farmers as to why they should employ ecosystem friendly farm practices for sustainable land management and the environment (METASIP objective 4). In addition, the Kassena-Nankana District being blessed with the Tono irrigation scheme and community-managed irrigation schemes serves as a platform for this study to make a comparative analysis on farm practices in the two systems. The findings of the study will also guide relevant authorities such as the Ministry of Food and Agriculture (MoFA) and Ghana Irrigation Development Authority (GIDA) in future policy formulation and investment within the agricultural sector. Again, it will go further to provide evidence to GIDA and the necessary agencies on some of the factors that make farmers to use EBFMPs. This will help inform policy, which will ensure sustainable farm practices are used to maintain the health of the ecosystems in farming communities. Furthermore, the study will provide evidence on the direct effects of EBFMPs on farmers’ livelihoods and the need for sustainability of these practices and this information will be useful to MoFA, GIDA and Non-Governmental Organisations in the design and implementation of their interventions. Lastly, the study will add to literature and serve as a future guide to academics in similar field of study.
7
www.udsspace.uds.edu.gh
1.6 Organization of the Thesis The thesis is organised into five chapters. Chapter one describes the background of the study as well as the problem statement, research questions, research objectives and justification. Chapter two consists of literature review. Chapter three describes the methodology used in collecting and analysing the data. The chapter four presents the results and discussion and chapter five summarizes the findings, draws conclusions based on the findings and makes recommendations based on the conclusions.
8
www.udsspace.uds.edu.gh
CHAPTER TWO LITERATURE REVIEW 2.1 The Concept of Ecosystem To give a clear understanding of the study, it is important to explain the term ecosystem. Even though the term "ecosystem" is currently gaining currency, its understanding is still complex as a concept considering the various layers of its meaning (Christian, 2003). The understanding of the term ecosystem and its use can be a little bit confusing and hence limiting the utility of the concept in most analysis. In that regard, it becomes imperative to delve into the meaning of the concept to map the analysis of this study. Although the word ecosystem is an earlier subject of study, it was actually refined and wellarticulated by a British ecologist, Arthur Tansley, describing the concept as a biotic community or assemblage and its associated physical environment in a specific place (Pickett and Cadenasso, 2002). Following Pickett and Cadenasso (2002), Tansley in 1935 gave clarity to the concept as a whole system composing the organism-complex and a whole complex of physical factors forming what is termed as the environment. The power of the definition articulated by Arthur Tansley is that it is applicable to any case where organisms and the physical processes interact in some spatial arena (Pickett and Cadenasso, 2002). After the clarity in meaning of the word ecosystem by Arthur Tansley, many other definitions emerged later including that of Odum (1971), and Allen and Hoekstra (1992). According to Christian (2003), Odum viewed ecosystem to be geographically identifiable and thus defined it as any unit that include all the organisms in a given area interacting with the physical environment so that a flow of energy leads to clearly defined trophic structure, biotic
9
www.udsspace.uds.edu.gh
diversity, and material cycles within a system. An alternative point of view of ecosystem was however given by Allen and Hoekstra (1992). They viewed ecosystem as a conception where biotic are explicitly linked to the abiotic world of their surroundings and size is not a critical characteristic, rather the cycles and pathways of energy and matter in aggregate form the entire ecosystem (Christian, 2003). The definition given by the Millennium Ecosystem Assessment (MA) is comprehensive in content and equally has a political consent (MA, 2007). According to the Millennium Ecosystem Assessment (2005), an ecosystem is a dynamic complex of plant, animal and micro-organism communities and their non-living environment interacting as a functional unit. This definition by the Millennium Ecosystem Assessment assumes that people are integral part of the ecosystem (Nellemann and Corcoran, 2010). The three basic properties of the definition from the Millennium Ecosystem Assessment (2005) and many other definitions of ecosystem include the presence of biotic and abiotic components and their interactions (Christian, 2003). The biotic component of the ecosystem considers or talks about communities of living organisms and the abiotic component refers to the non-living organisms' chemical and physical environments (Christian, 2003). The interactions of the components of the ecosystem might be in multiple spheres, but the most recognized are those associated with (1) food webs and trophic dynamics (transfer of energy from one part of an ecosystem to another) and (2) material cycling, particularly of nutrients (Christian, 2003). On a more general consideration, the interaction involves flow of energy, matter and information within an ecosystem. For the context of this study, an irrigated ecosystem is defined as the multi-level interaction between irrigation farmers and the physical environment of an irrigation scheme in which they engage their economic activities.
10
www.udsspace.uds.edu.gh
2.2 Services of Ecosystems The daily survival of human beings depend on the services of the ecosystems such as fruits, fuel wood and water. The services of the ecosystem go beyond providing just fruits and water to defining the economic life of most people in the world. Hancock (2010) reported that the earth's ecosystems provide the human society with a stream of services, which remain crucial to our health, economic prosperity and general security to individuals and nations in a broader scope. The dependence of humans on the environment and the services of its ecosystems cannot therefore be overemphasized. The services of ecosystems can be seen as the benefits that humans obtain from the ecosystems as a result of ensuring its recycle life. According to Boyd and Banzhaf (2007), the ecosystem services can be referred to as the benefits of nature to households, communities and economies. On a different lens, it can be seen as the process by which the environment produces resources normally taken for granted and these include fresh food, clean water, timber for fuel, habitat for fisheries and pollination of agricultural plants (Davari et al., 2010). All these services provided are very useful to society in many ways and to a large extent some of the importance of the services provided are yet to be explored by man (Boyd and Banzhaf, 2007). However, the services provided by the ecosystems are of notable benefits across a range of geographical scales (local, regional and global) and to many different groups- individuals, businesses and governments (Hancock, 2010). The sustainable development of a nation largely ties to the nature of the ecosystems and the services provided within, since a compromise of these services poses an increased risk to public health, economic stability, security and the overall ability to sustainably support human society and future development goals (ibid).
11
www.udsspace.uds.edu.gh
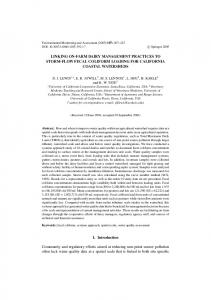
Generally, the existence of humans and all living organisms have a direct correlation with the health of the ecosystems services. Thus, the importance of the ecosystems services cannot be overestimated. Meanwhile a comprehensive classification of the ecosystem services has been developed by the Millennium Ecosystem Assessment (MA) to include provisioning services, regulating services, cultural services and supporting services (Munang et al., 2011) as illustrated in Figure 2.1. From Figure 2.1, the well-being of human depends on the provisioning services, regulatory services, cultural services and supporting services of the ecosystems for food, nutrients cycling of agricultural lands, climate regulation, aesthetic purposes and among others. It is important to note that the services provided by the ecosystems are not primarily for the consumption of humans but a self-sustaining mechanism of the ecosystems in maintaining their cycle (MA, 2007).
SUPPORTING SERVICES Nutrients cycling Soil formation (structure and fertility) Primary production
PROVISIONING SERVICES Food Fiber Fuel Water provision Genetic biodiversity
REGULATING SERVICES Pollination Climate regulation Erosion regulation Water purification Atmospheric regulation Control of pest
CULTURAL SERVICES Aesthetic Recreation and education
HUMAN WELL-BEING Figure 2.1: Classifications and relationships among ecosystem services Source :Zhang et al. (2007). 12
www.udsspace.uds.edu.gh
From Figure 2.1, the provisioning services include food, fiber, fresh water, fuel wood and genetic biodiversity. The figure indicates that societies maintain their well-being by utilizing the provisioning services of the ecosystems as their source of food, water, fiber, fuel and biodiversity. These services most often are provided by agricultural ecosystems (Thiaw et al., 2011). The provisioning services can also perhaps be considered as the most recognisable valuable services in terms of human use (Boelee et al., 2011). Another form of services provided by the ecosystems is the supporting services. However, these services are less recognised in the sense that they do not provide direct benefits to humans but indirectly help in the production of other goods and services (Figure 2.1). According to Sandhu et al (2010), these services include nutrients cycling of soil fertility through microbial activities, formation of soil ( e.g. soil turnover by earth worms) and primary production. The cultural services are most often beneficial to humans in cultural activities and social life. According to Munang et al. (2011), the cultural services basically contribute to the well-being of humans through the provision of aesthetic services, spiritual services , recreational services and education opportunities as indicated in Figure 2.1. The regulating services are another type of service provided by the ecosystems. The regulating service tries to ensure ecological balance in the system. The regulating services include the ecological processes that maintain temperature and precipitation (Sandhu et al., 2010). From the figure, it also includes pollination, natural erosion control, natural pests and weeds control, water purification, climate control and atmospheric regulation. These regulatory services are less tangible and therefore can be more difficult to assess economically (Boelee et al., 2011).
13
www.udsspace.uds.edu.gh
2.3 Ecosystem-Based Farm Management Practices The current hike in world's population comes with an equal increased in food demand. However, the path to increase agricultural food output may include intensification and expansion of agriculture through greater mono-cropping, intensive irrigation and use of transgenic crops, chemical fertilizers and pesticides (Thiaw et al., 2011) which is gaining momentum in Ghana. Meanwhile, these practices put pressure on the ecosystems and will worsen the ability of the ecosystems to provide essential services to humanity in the long term (Ibid). Beyond this, it also creates a condition that traps future generations into high cost of agricultural production and eventually making it difficult for communities to break free from poverty (MA, 2007). This therefore calls for farm practices that are ecosystem-based for the management of the resilience of the ecosystems. Ecosystem-based management (EBM) can be defined as an integrated process which aims to conserve and improve the health of ecosystems that sustains ecosystem services for human wellbeing (Munang et al., 2011). An expanded definition was also given by International Union for Conservation of Nature (IUCN) as the process that integrates ecological, socioeconomic and institutional factors into comprehensive analysis and actions in order to sustain and enhance the quality of the ecosystems to meet current and future needs (Munang et al., 2011). Basically, this means that ecosystem-based management deals with a multi-faceted approach in management for the sustainability of the ecosystems. In the light of this, ecosystem-based farm management practices can also be seen as the farmbased practice that aims at balancing agricultural output and the functional capacity of the agroecosystems in providing continuous services for present and future generations. These practices include sustainable soil management practices (manure/compost application, inter-cropping with
14
www.udsspace.uds.edu.gh
legumes, mulching, crop rotation, row planting, composting and others). It also includes sustainable water management practices (efficient drainage systems-canals, soil/stone bunding among others) and agro-foresting (sustenance of existing trees, tree planting and more). On average, these ecosystem-based farm management practices conserve and boost the functional capacity of the ecosystems services through natural and biological means as well as intensive, high inputs systems (Thiaw et al., 2011).
2.4 Importance of EBFMPs to Agriculture The practices that exist in a particular farmland have major consequences on the primary role of that same land in maintaining its resilience. These farming practices also affects a wide range of ecosystem services including water quality, pollination, nutrients cycling, soil water retention, carbon sequestration, and the general health of the ecosystems (IUCN, 2010). However, ecosystem-based farm management practices contribute to the quality of ecosystem services (Swinton et al, 2007). As such, understanding how these farming practices (ecosystem-based farm management practices) contribute to the health of the agro-ecosystems will inform choices about the most beneficial agricultural practices. The proceeding subsections describe how some of the ecosystem-based farm management practices contribute to the resilience of agroecosystems. 2.4.1 Compost/ organic manure application The use of organic matter or manure on farmlands plays an important role in enhancing the nutrients quality of the land via the introduction of nitrogen. It is important to note that even in intensive fertilized grain crops, soil organic matter still provides about 50% of the crop's nitrogen needs (Swinton et al., 2007). This shows how important soil organic matter is to providing
15
www.udsspace.uds.edu.gh
minerals for the growth of crops even with the use of inorganic fertilizer. Also, about 50% of the soil organic matter is carbon, which provides energy for microbes, invertebrates and other heterotrophic organisms that form the complex soil food web (Swinton et al., 2007). Beyond this, replacing synthetic nitrogen fertilizers with biological nitrogen fixation by legumes can reduce CO2 emissions from agricultural production by half (Power, 2010). According to IUCN (2010), agriculture alone was responsible for 14% of global greenhouse gas (GHS) emissions in 2000 from several sources which include fertilizers through volatilization of gasses from fields and burning of savannah and agricultural residues. 2.4.2 Conservative tillage Tillage can be seen as the activity of loosening the compactness of soil particles for agricultural production. Tillage as defined by IUCN (2010), is the practice of ploughing or loosening the soil to create arable land. Conservation tillage cultivation has the capacity to conserve soil carbon (Power, 2010). Studies have revealed that the practice of conservation tillage cultivation enables soil carbon sequestration that would otherwise be emitted into the atmosphere with tillage cultivation (Power, 2010). The soil carbon sequestration is essential to agriculture because it helps conserve the soil structure and fertility. Even beyond the maintenance of soil structure and fertility, conservative tillage farming helps reduce cost of production and fossil fuel use through the avoidance of ploughing (IUCN, 2010). Also, conservative tillage demonstrate effectiveness in controlling soil erosion and siltation (IUCN, 2010). Tillage generally buries residues, leaving the soil bare and more susceptible to the erosive effects of rainfall, and at the same time breaks up natural soil aggregates that help infiltration, storage and drainage of precipitation (Magdoff, 2007). As a result, reducing tillage is a core component of ecosystem-based farm management approach to agriculture. 16
www.udsspace.uds.edu.gh
2.4.3 Inter-cropping with legumes Another ecosystem-based farm management practice that can enhance soil fertility is intercropping with legumes. The cultivation of legumes with other crops plays an important role in enhancing soil fertility, forage and mulching quality within the agro-ecosystem (Mooleki and Recksiedler, 2009). The primary role legumes play is fixing atmospheric nitrogen (N2) through their symbiotic relationship with Rhizobium spp (soil bacteria that fix nitrogen), usually with the host root system. Here, the bacteria usually convert atmospheric nitrogen to ammonia, and then provides
organic
nitrogenous
compounds
to
the
plants
(https://en.wikipedia.org/wiki/Rhizobium). It is important to note that legumes derives about 70 to 80 percent of their nitrogen requirement from the atmosphere through their symbiotic nitrogen fixation (Mooleki and Recksiedler, 2009). The amount of nitrogen fixed will vary from place to place depending on the nodulation, soil moisture and temperature and the available soil nutrients such as nitrogen and phosphorus (Ibid). Therefore, the traditional practice of mixed cropping with legumes should not be discarded to help boost the soil fertility in agro-ecosystems. 2.4.4 Crop rotation Crop rotation is a system of farming that allows the variation in choice of crops to cultivate every year. As defined by Rodale (2011), crop rotation is a systematic approach of deciding which crop to cultivate in an arable land from a year to the next. Crop rotation as an ecosystembased farm management practice is of high benefit to Agricultural lands by balancing soil fertility and preventing pests and diseases built-up (Rodale, 2011). The various crops have different nutrients requirement and hence affect soil nutrients balance differently. Some crops like tomatoes deplete soil nitrogen and phosphorus heavily within a particular field in a year. It is therefore prudent to vary the crops after some time to allow biological balancing of soil nutrients. 17
www.udsspace.uds.edu.gh
This usually can be aided by planting leguminous crops such as peas or beans to replenish the lost nitrogen. In addition to the soil fertility balancing, crop rotation is a natural medium of controlling pests and diseases since rotating crops from different botanical families aids in curbing diseases and pests. Sometimes, lengthy rotations are required to control chronic soil borne diseases. 2.4.5 Mulching The primary essence of mulching is to create a balance temperature that allows plants to grow fast and to enrich the soil fertility. A mulch can be considered as a layer of materials ( most often leafs) applied to the surface of an area of soil to conserve moisture, reduce weeds growth, enhance visual appearance of the area, improve fertility and health of the soil (https://en.wikipedia.org/wiki/Mulch). According to Singh et al. (2014), traditional knowledgeled practices such as bio-mulching is a better and effective way of controlling moisture loss and weeds, reduce disease incidence, regulate temperature, and generally maintains the functioning of the agro-ecosystems. In most cases, especially irrigated areas in Ghana, the conventional way of controlling weeds is through herbicides application which pollutes and reduces water quality. Again, excessive tilling is another medium of controlling weeds, which also looses the soil thereby making it more susceptible to erosion. As a result, bio-mulching is seen to be the best mechanism of balancing weeds control and enhancing agro-ecosystems (Mohammadi, 2012). 2.4.6 Conservation of vegetation or trees Conserving trees play a major role in maintaining the functioning of agro-ecosystems. Trees in general help to maintain temperature levels in arable lands. Fell leaves of trees serve as a cover that maintains soil moisture, prevents erosion and equally decompose to fertilize the soil. Less known about clearing of woody vegetation is that it can lead to salination, which affects 18
www.udsspace.uds.edu.gh
plants growth. Trees cover absorbs rain water, hence limiting ground water recharge, and keeping the ground water table low enough to prevent salt from being carried upward through the soil (Gordon et al, 2010). Australia is a classic example of this problem after clearing their native woody vegetation in the 1930s for agricultural expansion (Gordon et al., 2010). The conservation of the vegetation or trees also helps in pollination of crops in arable lands. In the light of this, conservation of vegetation/trees can be considered as one of the core ecosystembased farm management practice since it goes beyond that arena to influencing the climate. 2.4.7 Efficient drainage system (canals) In stating ecosystem-based farm management practices, efficient drainage systems cannot be exempted. An efficient system of water drainage in an irrigation scheme ensures continuous supply of water, prevents siltation, promotes healthy aquatic life and the agro-ecosystem as a whole (Gordon et al., 2010). Well-maintained canals prevent water wastage and siltation. Leaked canals allow soil nutrients to be carried away easily causing siltation. Unmaintained and leaky canals can also transport chemicals applied on fields to water source harming the health of aquatic life. Poor distribution of water can also cause down-stream fields to face water supply challenges. 2.4.8 Soil or stone bunding Just like the canals, soil or stone bunding is another indigenous farming practice that is ecosystem friendly. Soil or stone bunding helps prevent wastage of water and loss of soil fertility. The bunds help to retain soil nutrients within the site to meet plants’ needs. The bunds can also be seen as an effective mechanism of controlling erosion.
19
www.udsspace.uds.edu.gh
2.5 Meaning of Adoption It is important to understand the meaning of adoption to map its use in this study. According to Sahin (2006), the decision to fully use or employ an innovation as the best course of action available can be termed as adoption. However, the concept of adoption is closely tied with diffusion of innovation which is also defined by Sahin (2006) as the process in which innovation is communicated among members of a social system through certain channels over time. Adoption is also referred to as the extent of use of a new technology or practice while diffusion is the dispersal of technology in a community (Abdul-Hanan et al., 2014). There is a progressive recognition from literature that the two terms (adoption and diffusion) are often used together because a social system interacts and functions as a unit. In that perspective, the adoption of a new technology will definitely be diffused among members of the social system overtime. Most ecosystem-based farm management practices (EBMFPs) are considered as traditional practices which were used most often by our forefathers. However, the use of these practices in recent times have reduced and the knowledge of the practices in maintaining ecosystems resilience by most farmers is also limited. Adoption of EBFMP can be defined in this study's context as the use of an ecosystem-based farm management practice by an irrigation farmer during the time of interview. Here, adoption does not include the practices (EBFMPs) being used by an irrigator in previous years before the year under consideration in the study.
2.6 Factors Influencing the Adoption of EBFMPs The adoption of ecosystem-based farm management practices is determined by several factors. According to Rezvanfar et al. (2009), diversity of factors combined with the potential interactions between them contribute to the complication in identifying the factors that contribute
20
www.udsspace.uds.edu.gh
to ecosystem-based farm management practices adoption. There are a lot of studies (e.g. AbdulHanan et al., 2014; Nkegbe et al., 2012; Nkegbe et al., 2014; Armah et al., 2013; Ngwira et al, 2014; Rezvanfar et al., 2009) on the adoption of sustainable farm conservation practices that have a direct connection with this study. According to Ngwira et al. (2014), the factors affecting the adoption of sustainable indigenous farming practices in Malawi include gender, age, education, family size, dependency ratio, hired labour, community labour, total cultivated land, membership of farmer group, subsidized fertilizer and tropical livestock unit index. The study also employed the Heckman two stage models to correct the sample bias by considering separately the factors that determines conservation agriculture adoption and the extent of conservation agriculture adoption. The limitation of Ngwira et al. (2014) is that, its analysis is based on only three principles- minimum soil disturbance, permanent soil cover with crop residues and crop rotation which gives a smaller picture with respect to the number of ecosystem-based farm management practices adopted by farmers. At the national level, Armah et al.( 2013) looked at the factors influencing farmers' choice of indigenous adaptation strategies in response to agro-biodiversity loss in northern Ghana. In that study, the multinomial logit model was used to determine the factors that influence farmers' choice. The factors identified to be positively influencing farmers' choice include household head's sex, farming experience, radio ownership, household size, credit access and awareness of reduction in crop diversity. On the flip side, age, education, farm size, awareness of climate change, farm cash income and existence of market in the community were found to negatively influence choice of practices. The challenge in this study rests much on its methodology,
21
www.udsspace.uds.edu.gh
specifically the use of multinomial logit model, which is unable to foretell the intensity of adoption of indigenous adaptation strategies as compared to the Poisson model. Another study within the domain of northern Ghana similar to this study is that of Nkegbe and Shankar (2014) and Nkegbe et al., ( 2012). Nkegbe et al. (2012) employed the Probit model in its analysis that provided the room for correction of subjectivity bias but Nkegbe and Shankar (2014) employed the Poisson model in the study to further analyse the intensity of used of the sustainable soil and water conservation practices-composting, cover crops, agro-forestry, grass strip, soil bund and stone bund. The Gamma count was equally used to further correct for overdispersion in the data. In the past, most studies on adoption were usually binary (that is, adopt or not adopted), but the strength in Nkegbe and Shankar (2014) lies in the further analysis of the intensity to which the various techniques or practices are used. From the empirical results of that study, access to information, social capital, per capita landholding and wealth play a crucial role in determining farmers' decision to intensively adopt sustainable soil and water conservation practices. Again, Abdul-Hanan et al. (2014) also closely tied with that of Nkegbe and Shankar (2014) except that the former had a broader scope, as it went beyond the factors that determine the adoption of the sustainable farming practices or the ecosystem friendly practices to consider the factor productivity. The study equally employed the Poisson model couple with the stochastic frontier. The covariates in the study included gender, age, age square, education, farm size, household size, group membership, number of extension visits, credit obtained by the farmer and distance to input stores. The limitation of this study is on its inability to test for over-dispersion for the necessary corrections.
22
www.udsspace.uds.edu.gh
It can be deduced that all the above mentioned studies have failed to consider farmers' knowledge of the ecosystem services as one of the factors that can influence their adoption of ecosystem friendly practices or indigenous farming practices in Ghana on a broader scope. This current study therefore contributes to adoption studies literature on agro-ecosystems with a blend of indigenous farming practices (ecosystem-based farm management practices) knowledge and how it affects farmers' intensity of using the practices and livelihoods.
2.7 Types of Irrigation Management Systems in Ghana A clear-cut classification of the types of irrigation management systems in Ghana has been a subject of contention considering the ad-hoc management systems of irrigation facilities across the country. That notwithstanding, prominent classifications are given by Ghana Irrigation Development Authority (GIDA) and International Water Management Institute (IWMI). GIDA (2011) in its national irrigation policy classified the irrigation systems in Ghana into three broad categories: (1) informal (smallholder) irrigation, (2) formal irrigation and (3) large scale commercial irrigation. In the policy document, the informal irrigation is practiced by an individual who cultivates an area of about 0.5ha or more by using simple structures and equipment for water storage, conveyance and distribution. In most instances, the informal irrigators do not depend on public infrastructure. The formal irrigation on the other hand depends on permanent infrastructure, which is funded by the public sector. The large-scale commercial irrigation can either be formal or informal depending on whether the headwork and primary infrastructure machinery is provided by the government or private investor. The large-scale commercial irrigation is usually exports oriented and comprise farm sizes of between 25ha and 1000ha or more. In summary, the baseline of classification by GIDA is the source of infrastructure provision and the scale of operation. However, the weakness with this system of 23
www.udsspace.uds.edu.gh
classification is that there are so many irrigation schemes across the country classified as informal which have their primary infrastructure provided by government or NGOs but managed by communities or private individuals. Another prominent classification is the one by Namara et al. (2011) for IWMI and the authors broadly classified the irrigation systems in Ghana into two. These are the conventional irrigation systems, which are mainly initiated and developed by the government of Ghana or various NGOs and the emerging irrigation systems, which are initiated and developed by private entrepreneurs and farmers, either independently or with little support from the government and/or NGOs. The conventional irrigation schemes are sub-divided into five: (1) The public surface irrigation system which are operated and maintained by GIDA or ICOUR where beneficiaries are charged for services rendered, (2) The small reservoir-based communal irrigation systems which are also most often designed or constructed by GIDA or private contractors but significantly managed and maintained by community associations, (3) Domestic wastewater and storm water irrigation of which farmers depend on drains or streams to irrigate, (4) Recession agriculture or residual moisture irrigation which is also predominantly practiced by fishermen along the Volta lake, Afram plains and Tordize river in the Volta region as a complementary job and finally, (5) The traditional shallow groundwater irrigation in the Keta strip of the Volta region and other parts of the country. The emerging irrigation systems also include: (1) The groundwater irrigation systems
24
www.udsspace.uds.edu.gh
(2) Seasonal shallow groundwater irrigation systems (3) Permanent well irrigation systems (4) Shallow-tube well irrigation systems (5) Borehole irrigation systems (6) River lift irrigation systems (7) Public-private partnership-based commercial irrigation systems (8) Lowland valley rise water capture systems and (9) Small dugouts-based private irrigation systems. Apart from these two classifications discussed above, the classification based on size is also very commonly used. With this classification, irrigation schemes are divided into small, medium and large scale (Namara et al., 2011). A small-scale irrigation scheme is one with a maximum size of 200ha. The medium scale ranges from 200ha to 1000ha in size and above 1000ha is classified as large-scale. Considering these varied classifications made, this study will narrow its categorisation on only two systems for simplicity. Broadly the irrigation systems in the study area will be categorised based on management into: (1) The government-managed irrigation schemes and (2) Community-managed irrigation schemes. The government-managed irrigation schemes will comprise of all communities who access their water from the Tono irrigation dam (which is managed by GIDA/ICOUR). For the purpose of this study, these communities will include Bonia, Korania and Biu. The community-managed irrigation schemes are also those irrigation schemes where the irrigators access their water from a common community dam irrespective of the source of infrastructure provision (government or a
25
www.udsspace.uds.edu.gh
private investor). These types of irrigation schemes will include the Paga-Nania, Saboro and Pungu-Telania irrigation schemes.
2.8 The Importance of Irrigation in Northern Ghana The weather condition in the north-most part of Ghana is erratic. The northern part of Ghana is generally classified as the savannah ecological zone where the climatic conditions do not allow for an all-year round rain-fed agriculture (Dinye, 2013). Beyond this unfavourable climatic condition, the northern ecological zone is also classified as the poorest in Ghana with a contribution of about 36% to total national poverty (GSS, 2014). Irrigation farming is therefore a necessary activity to complement the short wet season farming and to serve as a medium of enhancing the livelihoods of the people and to reduce poverty in the northern regions. The importance of irrigation in northern Ghana can therefore not be overemphasized since it serves not only as a source of income, employment, and food security but generally as a medium of boosting the living conditions of the people. According to Bagson and Kuuder (2013), the introduction of the Kokoligu irrigation scheme in the Nandom District is not only creating a fairly stable food security situation in the district but also curbing a societal problem of seasonal migration. In that study, it was revealed that the establishment of the irrigation in the area led to reduction in seasonal migration to southern Ghana for menial jobs from about 34% to only 8%. Besides, about 26% of households in the area are now deriving their livelihoods from the irrigation scheme, which is impacting positively on household food requirements. Similarly, Kpieta et al. (2013) reported that the construction of irrigation dams and dugouts in the Wa Municipality, Wa West and the Nadowli districts of the Upper West Region have positively ensured a steady increase in household food production, household income and a reduction in youth out-migration in dams communities. 26
www.udsspace.uds.edu.gh
A study conducted by Dinye (2013) in the Tono irrigation Scheme revealed that irrespective of the series of challenges such as limited market access and fierce competition from Burkinabe irrigation farmers, the irrigation scheme has created a platform for employment for the people of Kassena-Nankana area and beyond leading to high agricultural production. The Tono irrigation scheme has also been reported to have positively affected the socio economic conditions of beneficiaries in the Kassena-Nankana District by way of improvement in their income levels, food security, education of their children and a reduction of out-migration of household members to Southern part of Ghana (Seidu, 2011). Irrigation therefore plays critical roles in farmers’ livelihood development particularly in northern Ghana and Ghana as a whole.
2.9 Theory of Adoption and Empirical Review The theory underlining adoption and diffusion plays key role in determining the factors that influence the intensity of used of ecosystem-based farm management practices. However, to measure the intensity of adoption of EBFMPs, one needs to understand the theory underpinning the Poisson and negative binomial models, which are used in estimating the intensity of EBFMPs employed in the study. As such, the proceeding subsections give a theoretical framework of adoption of EBFMPs, the theory of Poisson and negative binomial modeling, and an empirical review of EBFMPs adoption. 2.9.1 The theoretical framework of EBFMPs adoption The theoretical background for explaining the factors that might influence a farmer's decision to employ a number of ecosystem-based farm management practices in an irrigation scheme can be traced to the adoption theory. There are two main schools of thought associated with the adoption theory of ecosystem-based farm management practices.
27
www.udsspace.uds.edu.gh
First, the individual characteristics of the farmer can influence his/her decision to employ a number of EBFMPs and secondly, the social environment he/she lives in can also influence the number of EBFMPs employed. In a broad classification, Leeuwis and Ban (2004) categorised these two adoption concepts into individualistic and constructivist perspectives. According to Ngwira et al. (2014), the individualistic perspective assumes that a farmer is an individual and makes rational choices in using new technologies given that
he/she has full access to
information and a set of ranked preferences. Ngwira et al. (2014) went further to add that, based on the individualistic perspective the neoclassical economic theory can be classified into: the economic constraints model, the diffusion of innovation model and the adopter perception model. The economic constraints model based much of its argument that, access to resources or capital greatly determines a person's ability to readily choose or employ a particular innovation. According to Ngwira et al. (2014), the economic constraints model rest on the assumption that, the sole objective of an individual is to maximise profit or utility but the observed patterns of adoption are determined by the varied allocation of resources among people. The economic constraints model basically recognises the relevance of profitability and constraints such as access to capital and risk, but actually fails to conceptualise the social dimension of knowledge, communication, information and rationality (Leeuwis and Ban, 2004). The diffusion of innovation model relies deeply on the importance of information. It is also of the view that access to information is the critical factor that determines adoption decisions (Rogers, 2003). In the developed world, the diffusion of innovation model has gained prominence with regards to the adoption of agricultural innovations since agricultural research and extension agents are very effective and active in those countries (Ngwira et al., 2014). This
28
www.udsspace.uds.edu.gh
means that, its suitability for an African setting is questioned. The reason is that, farmers in most countries of Africa do not get regular extension services. Another lapse of this model is that, it fails to acknowledge the individual characteristics of the adopter (Ngwira et al., 2014). Considering the lapse in the diffusion of innovation model, the adopter perception model believes that personal characteristics of a person or farmer better inform his/her choice of adoption. The adopter perception model provides explanation to adoption with perceptions of individuals and of which perceptions is determined by personal characteristics such as human values, education, experience, physical characteristics of land and so on (Ngwira et al., 2014). These three individualistic perspectives categorically narrow adoption of innovation to relate solely to individuals without recognising the interdependence of individuals in a society. The constructivist perspective thereby provides a realistic mechanism of analysing adoption of an innovation by acknowledging social learning as another strong factor influencing adoption (Ngwira et al., 2014). Like in Africa, most farmers in Ghana do share their experiences and farm problems among each other for possible solutions. As a result, determining the factors that influence the adoption of an innovation such as ecosystem-based farm management practices do not depend on only individual characteristics but also the formal and informal settings in which farmers interact. 2.9.2 The theory of Poisson and negative binomial modeling In social sciences, most studies usually deal with outcomes that are measured in counts such as number of soil conservative management practices, number of Integrated Pest Management (IPM) practices adopted, number of children as an indicator of fertility, and number of doctor visits as an indicator of health care demand among others (Winkelmann, 2015). Such studies are traditionally analysed with econometric models such as the binomial Probit or Logit models, 29
www.udsspace.uds.edu.gh
which usually lumped sum the dependent variable into two categories (1=full adoption , 0= no adoption at all) (Ramirez and Shultz, 2000). However, this might not be the true picture in most cases since technologies have different components, which could either be fully or partially adopted and binary choice models (e.g. Probit or Logit) cannot properly capture such situations. Thus, the Poisson regression or negative binomial regression models have been developed to handle such situations (Ramirez and Shultz, 2000). These two models have the capacity to estimate the effect of a policy intervention either on the average rate or the probability of no event, a single event, or multiple events (Winkelmann, 2015). The Poisson model has its theoretical backing from the Poisson distribution (Winkelmann, 2015), that expresses the probability of a given number of events occurring in a fixed interval of time and/or space with a known average rate, under the assumption that the occurrences are independent of one another (https://en.wikipedia.org/wiki/Poisson_distribution). For instance, the number of calls received by a person per hour comes from an independent wide range of sources and this simply obeys the Poisson distribution. Likewise, a farmer can also use a wide range of ecosystem-based farm management practices independently within a particular period of time and as such also obeys the Poisson distribution. Basically, the Poisson regression is a type of regression analysis that is used to model count data and contingency tables (https://en.wikipedia.org/wiki/Poisson_regression). It assumes that the response variable Y has a Poisson distribution and the logarithm of its expected value can be modeled by a linear combination of unknown parameters (Greene, 2003). The model looks at the probability that the dependent variable 𝑌 (in this case the number of EBFMPs used) will be equal to a certain number 𝑦, and is represented mathematically as follows (Abdul-Hanan et al, 2014): 𝑃𝑟𝑜𝑏(𝑌 = 𝑦) =
𝑒 𝜆 𝜆𝑦 , 𝑦!
𝑦 = 0, 1, 2, 3 … 𝑛
(1) 30
www.udsspace.uds.edu.gh
𝑤ℎ𝑒𝑟𝑒: 𝜆 = 𝑖𝑠 𝑡ℎ𝑒 𝑖𝑛𝑡𝑒𝑛𝑠𝑖𝑡𝑦 𝑜𝑟 𝑟𝑎𝑡𝑒 𝑝𝑎𝑟𝑎𝑚𝑒𝑡𝑒𝑟 𝜆 = exp(𝑋𝑖′ 𝛽) 𝛽 = 𝑎 𝑣𝑒𝑐𝑡𝑜𝑟 𝑜𝑓 𝑢𝑛𝑘𝑛𝑜𝑤𝑛 𝑝𝑎𝑟𝑎𝑚𝑒𝑡𝑒𝑟𝑠 𝑡𝑜 𝑏𝑒 𝑒𝑠𝑡𝑖𝑚𝑎𝑡𝑒𝑑 The log-likelihood function is given by the equation: 𝑙𝑛𝐿 = ∑𝑖=1,2,…𝑛 [−𝜆 + 𝑦𝑖 𝛽 ′ − 𝑙𝑛𝑦𝑖 !]
(2)
Interpretation of the coefficient: one unit increase in 𝑋𝑖 will increase or decrease the average number of 𝑌𝑖 by the coefficient expressed as a percentage. The marginal effect of a variable on the average number of events is: 𝜕𝐸(𝑦𝑖 ⁄𝑥𝑖 )⁄𝜕𝑥𝑗 = 𝛽𝑗 exp(𝑋𝑖′ 𝛽)
(3)
Interpretation of marginal effect: One unit increase in 𝑋𝑖 will increase/decrease the average number of the dependent variable by the marginal effect. Key assumption of the Poisson model Equi-dispersion property of the Poisson distribution. That is the equality of the mean and the variance. 𝐸(𝑦⁄𝑥) = 𝑉𝑎𝑟(𝑦⁄𝑥) = 𝜆
(4)
This property is much restrictive and often fails to hold in practice if there is ‘over dispersion’ in the data. Over dispersion in statistics is the presence of greater variability in a data set than would be expected based on a given statistical model (https://en.wikipedia.org/wiki/Overdispersion). This is common in developing countries
31
www.udsspace.uds.edu.gh
like Ghana where farmers tend to recall agricultural information with a lot of discrepancies. These Poisson regression models are part of generalized linear models with the logarithm as the link function. According to Williams (2015), the Poisson model relies heavily on an assumption that the conditional mean of outcome is equal to the conditional variance. But in practice, the conditional variance often exceeds the conditional mean. The Negative binomial regression model however, deals with this problem by allowing the variance to exceed the mean (Williams, 2015). Unlike the Poisson model, the negative binomial model has a less restrictive property that the variance is not equal to the mean (𝜇) (Greene, 2008). This is represented mathematically as follows: 𝑉𝑎𝑟(𝑦⁄𝑥) = 𝜆 + 𝛼𝜆2
(5)
The negative binomial model also estimates the over-dispersion parameter 𝛼. Therefore, there is the need to test for over-dispersion. To test for the over-dispersion, the following steps are observed: You estimate the negative binomial model which includes the over-dispersion parameter 𝛼 and test if 𝛼 is significantly different from zero. 𝐻0 ∶ 𝛼 = 0 𝐻𝐴 ∶ 𝛼 ≠ 0 o When 𝛼 = 0; It comes back to the Poisson model estimates o When 𝛼 > 0; there is over-dispersion (which frequently holds with real data (Williams, 2015)) o When 𝛼 < 0; there is under-dispersion (which is not very common).
32
www.udsspace.uds.edu.gh
These two models (Poisson and negative binomial regression models) have shown to be very simple for analysing count data and straightforward in interpretation. As a result, they are gaining
greater usage by many researchers on
current studies involving count data
(Winkelmann, 2015). Thus, there are a number of current studies that used Poisson and negative binomial models (e.g. Bashiru et al., 2014; Garming and Waibel, 2007; Kim et al., 2005; Nkegbe and Shankar, 2014; Raghu and Manaloor, 2014; Ramirez and Shultz, 2000). The study by Ramirez and Shultz (2000) was one of the first to explore the use of Poisson count regression models to analyse technology adoption. It was used to evaluate three technology transfer projects in Central America: Integrated Pest Management in Costa Rica, Agro-forestry systems in Panama, and Soil Conservation in El Salvador. However, the study by Ramirez and Shultz (2000) has similar objectives with this current study. Another similar study with count data that employed one of the count regression models (negative binomial regression model) is Raghu and Manaloor (2014). Their study investigated the adoption behaviour of farm households in three agro-biodiversity hotspots in India using the negative binomial count data regression model to estimate the factors influencing decision-making by farmers on farm management practices. The results of the regression revealed that farmers who received agricultural extension are more likely to use improved farm management practices. The regression also showed a negative relationship between cultivation of local varieties and adoption of farm management practices. Again, in the work of Garming and Waibel (2007), the Poison regression model was used to analyse the impact of farmers' experiences and perceptions of health risks of pesticides on the adoption of Integrated Pest Management (IPM) and pesticide use among small scale vegetable farmers in Nicaragua. Using the Poisson model, the authors were able to consider two levels of
33
www.udsspace.uds.edu.gh
adoption process in that study (1) the count of IPM practices tested and (2) the count of practices actually used. The results revealed that previous experience with pesticide poisoning incidents has significant positive effect on the number of IPM practices tested by a farmer, but not on the adoption. Other factors, which showed significance, include school education, characteristics of cropping system, whether or not farmers had attended training in IPM and farmers who pay wage premiums to workers for application of pesticides. In Ghana, the use of the Poisson and negative binomial regression models is equally gaining prominence. Classical examples include that of Nkegbe and Shankar (2014) and Bashiru et al. (2014). In Bashiru et al. (2014), both the Poisson and negative binomial regression models were used in identifying the determinants of adoption of risk management practices among farmers in the Wa East District. However, the Poisson regression model was shown to better suit the data since the test for over dispersion accepted the null hypothesis that there is no over dispersion. In that study too, it was observed that level of education, number of enterprises kept, farm size, access to credit and access to extension services significantly influenced adoption of risk management practices. Nkegbe and Shankar (2014) also used the Poisson regression model to determine the intensity of used of soil and water conservation practices among small holders in northern Ghana which yielded a lot of significant outcomes. From the foregoing, the Poisson and the negative binomial regressions models are considered appropriate for this study. 2.9.3 Empirical review of adoption of EBFMPs A lot of studies on adoption of EBFMPs have being done across the borders of Ghana (e.g. Rasul, 2009; Rezvanfar et al, 2011; Sterve, 2011). From the study of Sterve (2011), it was revealed that sustainable farm practices have the potential of increasing crop yield of the people of Potshini community and upper Thukela region of South Africa but are used to a very low 34
www.udsspace.uds.edu.gh
level. Three main reasons were stated to be accounting for the low adoption and these were physical constraints (lack of resources), behavioural resistence to change and lack of knowledge. Rezvanfar et al. (2011) also conducted a study on the adoption of organic agriculture among small farmers in Ravansar, Iran. Major findings from the study revealed that ecological attitude, social attitude, perceptions about organic farming and participation in extension activities are critical in adoption of sustainable agricultural practices or ecosystem-based farm management practices. In addition, Rasul (2009) also revealed that there are tradeoffs and synergies between relatively more environmental sustainable and harmful land-use practices. As a result, incentives to promote more prudent agricultural activities are needed to transform tradeoffs into synergies. Narrowing to the borders of Ghana, studies on adoption of EBMFP have also been carried out (e.g. Armah et al., 2013; Nata et al, 2014; Nkegbe and Shankar, 2014). Nata et al (2014) looked at how households adoption of soil-improving practices can affect the probability of increasing food security. The more critical thing about their findings is that, income as a variable does not signifantly improve household food security. From the study, there might be other factors such as weather and crop prices beyond the control of the farmer but determine food security better than the influence of household characteristics.
2.10 Valuation of Ecosystem Services In order to maintain the resilience of the ecosystem services and to provide solid arguments that can inform policy, then valuation stands crucial as it serves as a reflection of what society is willing to trade-off to sustain the natural resources (Pascual et al., 2010). According to Costanza et al. (2014), valuation is about assessing trade-offs towards achieving human goals. And these human goals can be in the form of spiritual enlightenment, aesthetic pleasure or the production of some marketed commodity (Barbier et al., 2009). The value of ecosystems are most often 35
www.udsspace.uds.edu.gh
attributed by economic agents through their 'willingness to pay' (WTP) for the services that flow from the ecosystems (Pascual et al., 2010). It is important to note that if these services of the ecosystems are not calculated, then policy would be misleading and society in general would be worse-off due to misallocation of the resources (Pascual et al., 2010). Inasmuch as this economic valuation is important, understanding the procedural elements and components involved is of higher interest for realistic and a general appreciation of outcome values. This means that for ecosystem services valuation to become a strong consideration for policy formulation, then it is prudent in getting the true value of them (Simpson, 2011). There are several studies on economic valuation (e.g. Barbier et al., 2009; Costanza et al., 2014; Fisher et al., 2011; Gómez-Baggethun and Ruiz-Pérez, 2011; Pascual et al., 2010; Rasul et al., 2011; Simpson, 2011) which all appreciate the existence of controversies in determining the true value of most ecosystem services, especially the non-marketed services (e.g. regulatory, cultural and supporting services). According to Gómez-Baggethun and Ruiz-Pérez (2011), the general critique of ecosystem services valuation by most studies is that, attempting to give value to ecosystem services means commodification and commercialization of the ecosystem services. Commodification in the study was defined as the conceptual and operational treatment of ecosystem goods and services as objects meant for trading. The basis of the critique is that, for ethical reasons, some things ought not to be for sale or monetized since this will grossly undervalue them. A similar argument was raised by Simpson (2011), who highlighted much on the 'paradox of valuation' and generally classify valuation as problematic studies. That is, ecosystem services valuation remains a flawed exercise because scarcity or availability of the resource always have a role in determining the monetary value of the resource irrespective of the necessity or utility of the resource. For
36
www.udsspace.uds.edu.gh
example, water is a fundamental necessity of human survival yet it is always undervalued as compared to diamond which is highly valued just because it is a scarce commodity. There is however, a strong counter argument that valuation of ecosystem services (in whatever units) is not the same as commodification of ecosystems (Costanza et al., 2014; De Groot et al., 2012). It is a misconception to assume that valuing ecosystem services in monetary units is the same as privatizing them or commodifying them (Costanza et al., 2014). This is because the main objective of the valuation exercise is to determine the extent to which an individual or group of people appreciate the free resources or services provided by nature. This can realistically be achieved through the allocation of monetary units since money has a global recognition. Also, according to De Groot et al. (2012), the measure of the ecosystem services flows and their values in monetary units is just a fundamental step to provide guidance in understanding user preferences and the relative value current generations place on ecosystem services. Again, it serves as a platform in raising awareness, improving management mechanisms and providing a framework for decision making (Rasul et al., 2011). Other issues that are worth understanding when determining the value of ecosystem services are "services verses benefits", "price verses value" and "here and now" verses "there and then" (Fisher et al., 2011). According to Fisher et al. (2011), it is important getting a clear distinction between services and benefits to avoid double counting or valuation. It is therefore necessary in valuation exercise to value endpoints that have a direct effect on human welfare. Fisher et al. (2011) added that price is simply a portion of an underlying value hence decision makers should be interested in value rather than price. As a result, in measuring value, one needs to employ willingness to pay (WTP) rather than what actually has to be paid. They however, added that, the value of an ecosystem service is dependent on where the service is delivered and the time at
37
www.udsspace.uds.edu.gh
which the value is being assessed. The fact that valuation is temporally and spatially contextual is what is meant by "here and now" verses "there and then". Inculcating all these issues in the valuation and analysis will better give a wider appreciation of the values by readers. 2.10.1 The theoretical concept of contingent valuation method Another issue with regards to economic valuation is the choice of the most appropriate valuation method for a given service. According to De Groot et al. (2012), the choice of the valuation method depends on the purpose of the valuation and the socio-economic and environmental context. However, most studies (e.g. Costanza et al., 2014; Fisher et al., 2011; Pascual et al., 2010; Rasul et al., 2011) acknowledge the use of contingent valuation method (CVM) in determining the value of most regulatory, cultural and supporting services of the ecosystems. The contingent valuation method is a survey based technique mostly used for measuring values of most environmental goods and services which are non-market resources. The survey creates a hypothetical market for the amenity such that responses can be evaluated in a manner equivalent to a behavior observed in the markets (Mendelsohn and Olmstead, 2009). This method measures non-market goods by eliciting the amount people are willing to pay (WTP) for such a good. According to Ehiakpor el al. (2015), the theoretical concept of WTP can be traced to the Hicksian measurement of Compensating Variation (CV) and Equivalent Variation (EV). From the theoretical concept, a farmer who appreciates or gets the benefits of using EBFMPs obtains a higher satisfaction level or utility hence attached with a higher indifference curve. On the other hand, a farmer who less appreciates the benefits of employing EBFMPs is associated with a less utility and as a result placed at a lower indifference curve. The primary logic behind the use of this valuation method is to assess how farmers cherish the functions performed by the 38
www.udsspace.uds.edu.gh
ecosystem-based farm management practices and to determine the value being placed by farmers on the ecosystem-based farm management practices. From Figure 2.2, IC2 has a higher utility than IC1 and shows an improvement in satisfaction of the services of the EBFMPs and vice versa. In reality, farmers employ EBFMPs and inorganic farm practices together deriving a certain level of satisfaction (IC1) at equilibrium (E1) given a constraint budget line (BL1). An increase in the utility derived from using EBFMPs overtime will place farmers' indifference curve at a higher level (IC2), implying they are willing to adopt more EBFMPs or willing to pay for more services from EBFMPs. The high adoption of EBFMPs will reduce cost on production (less inorganic fertilizer and chemicals will be used), making farmers' real income to increase on the assumption that output levels, prices and other factors are held constant. This will intend cause the budget line to rotate out, setting a new budget line (BL2) and
"Y" Practices (inorganic practices)
equilibrium point (E2) with a higher indifference curve (IC2).
B
Y1
E1 IC1
Y2
E2 IC2
0
X2
L1
X1
"X" practices (EBMFPs)
Figure 2.2: Indifference curve showing farmers WTP Source: Author' construction (2016). 39
L2
www.udsspace.uds.edu.gh
2.10.2 Empirical Review of Contingent Valuation Method for EBFMPs There are many similar studies under ecosystem services that employed the CVM to estimate people's WTP for the sustainability of those services. Among these studies include Alemayehu (2014) that used the CVM to estimate smallholder farmers mean WTP for improved irrigation water in Koga irrigation project, Ethopia. The findings revealed that majority of the households show positive commitment in paying for improved irrigation water facilities. The responses from the hypothetical market scenario also indicates a mean WTP value of 6.78 US dollars and a total WTP value of 92,951.34 US dollars by households for improved irrigation water facilities. Factors that significantly affected households' WTP for improved irrigation water facilities are educational level, household size, gender, first bid, total family income and cultivated landsize. Another study that employed the CVM for analysing sustainable farm practices is Danso et al. (2006). The study used the CVM to estimate farmers WTP for compost from municipal waste among urban and peri-urban farmers. It was revealed from the study that effective demand for compost for agricultural purposes is low and limited by farmers' transport cost. In addition, Ansong and Røskaft (2014) also estimated the WTP value for sustaining the forest reserve in Western Region of Ghana using the CVM. The monthly mean WTP per respondent estimated was between GH₵2.22 and GH₵2.26 (1.59 to 1.61 US dollar for 2009 rate). It was also revealed that high income earners and older people were much willing to pay for higer amount than low income earners and younger people. In summary, the contingent valuation method proves to be more appropriate valuing regulatory, cultural and supporting ecosystem services. The contingent valuation method however, has certain limitations and advantages that need to be acknowledged (Figure 2.3).
40
www.udsspace.uds.edu.gh
CONTINGENT VALUATION METHOD
LIMITATIONS
STRENGTHS
The values are subjective and depend much on utility. Respondents' lack of knowledge can underestimate or overestimate values. People’s purchasing market decision is always likely to influence their willingness to pay for a non-commodity good. There might also be a strategic bias when respondents do things to influence a particular outcome. The environments of the respondents also largely influence their willingness to pay value. The estimate requires competent survey analyst to defend estimates.
It is very flexible in measuring or estimating any economic value. It is widely acknowledged for measuring non-use values, passive use values and all types of values including use-values. Even though competent survey analyst is required to defend estimates, it is very easy to interpret since the monetary units can be used to measure willingness to pay. Since results rest on willingness to pay or willingness to accept, estimates are logically valid and reliable.
Figure 2.3: Strengths and Limitations of CVM Source: King and Mazzotta (2000).
2.11 Livelihoods and Ecosystem Services The management and conservation of ecological resources has been identified as one of the key approaches that has the potential of enhancing and sustaining the livelihood conditions of most people, especially those with a direct contact with nature (Nzama, 2009). In the same vein, the use of ecosystem-based farm management practices will have a direct effect in sustaining the livelihoods of irrigation farmers since largely their livelihoods revolve around farming. It is therefore important for this study to consider how farmers' value and their willingness to
41
www.udsspace.uds.edu.gh
conserve the ecosystem services in arable lands could help enhance their livelihoods and general wellbeing. Livelihood is a social concept and currently has greater currency and a wider appreciation than poverty as it comprises people, their capabilities, assets (including both material and social resources) and activities required for a means of living (Meikle et al., 2001; Sheheli, 2012). Simply, livelihood can be defined as " a means of gaining living", which refers to the way of living rather than income and consumption alone (Sheheli, 2012). Livelihood is sustainable when it is resilient to shocks and stresses, and does not adversely affect the environment (Meikle et al., 2001). This means that the health of the environment constitutes a major determinant in dictating how sustainable a group of people’s livelihood will be. Generally, the concept of livelihood has a broader scope to include not only income generating activities pursued by a household or an individual, but includes the social institutions, intra-household relations and mechanisms of access to resources through the life cycle (Sheheli, 2012). To have a clear picture of the concept of livelihood, one needs to identify the building blocks it rests on. According to the UNDP (2013), the building blocks of livelihoods are referred to as capital assets. These capital assets include human capital ( skills, knowledge, experience and capacities), natural capital (natural resources such as water, land , forests, and minerals), physical capital (infrastructure, water and sanitation facilities, information and communication technology, housing, schools, health facilities and other community and government structures), financial capital (such as savings, credit, remittances, enterprise holdings, insurance, pensions and livestock), political capital (access to and participation in decision making processes) and social capital (networks, group memberships, and social relationships). This broad variables of livelihood makes it a better option for analysis than poverty. According to Sheheli (2012),
42
www.udsspace.uds.edu.gh
emphasis on the study of livelihood is because it actually provides a holistic information that can reveal how and why people survive (or fail to survive) difficult times so as to reduce vulnerability. In the same vein, this study seeks to determine how farmers survive and how their willingness to conserve the ecosystem services on their farms can have an effect on their livelihood. Various studies (e.g. MA, 2005; MA, 2007; IUCN, 2004) have been carried out which ties ecosystems conservation practices with that of livelihoods. According to the MA (2007), ecosystem conservation practice is a principal driver of poverty alleviation and enhances general socio-economic conditions of people. The report asserts that, majority of the world's population have their livelihood engagements that depends strongly on the ecosystems hence the conservation of the ecosystems will affect positively the livelihoods of the people, especially the poor and vulnerable. Similarly, IUCN (2004) suggested that what makes ecosystem restoration practices (including the use of EBFMPs) uniquely valuable are their inherent capacity to provide people with the opportunity not only to improve their livelihood conditions but also to repair ecological damage. The benefits of ecosystem restoration are quite obvious since it can improve biodiversity conservation and ecosystem productivity, empower local people and aggregately improve livelihoods (Ibid). What is also very important is the ability of those conservative ecosystem practices to renew economic opportunities
and subsequently contribute to the
improvement of human well-being or livelihood (IUCN, 2004). According to
Gross et al. (2014), a study in the Dominican Republic revealed that a
coordinated effort to support smallholder shade coffee farmers offer a better potential to improve rural livelihoods and the resilience of the ecosystem services than the practice of cutting down trees. The reason is that, unsustainable tree-cutting practices for high-input
43
www.udsspace.uds.edu.gh
monoculture cropping to meet the household economic pressures rather threatens natives' trees biodiversity and the provision of ecosystem services (e.g. delivery of clean water and carbon sequestration) to local beneficiaries. Findings from Sudmeier-Rieux et al. (2006) also suggest that a well-managed productive ecosystems can support sustainable income generating activities and are equally important assets for people and communities even in the aftermath of a disaster (such as drought and floods). This is because, a healthy ecosystem has the capacity to mitigate quickly the impact of most natural hazards and also provide a lot of livelihood alternatives that people can depend on (e.g. the provision of fruits). Again, Assan and Beyene (2013) in a study conducted in selected rural communities of Ethiopia found that even in the era where climate change and environmental variability is having an overwhelming impact on the economic conditions of rural households, ecosystems conservation and sustainable development interventions have been posited as the most effective approach in addressing both environmental degradations and households livelihood conditions. In Ghana, similar studies (e.g. Boafo et al., 2014; Hapsari, 2010; Mwingyine, 2008) have been carried out which link people's livelihoods to the resilience of the ecosystems. According to Mwingyine (2008), about 93% of the people of Sissala West District of Ghana depend on the health of the ecosystems as they engage in farming as their major source of livelihood. In the study, non-sustainable land use practices pose a serious threat to livelihoods as the land is fast degrading and people are sinking gradually into poverty. The study revealed that agricultural activities such as land preparation, continuous cropping, farming near water courses, grazing activities and wood harvesting for various purposes are major contributory factors to loss of soil fertility, drying up of water bodies and worsening rainfall patterns in the area. These
44
www.udsspace.uds.edu.gh
environmental problems impact negatively on livelihoods sources such as poor crop production, low animal production and reduced dry season economic activities. Boafo et al. (2014) looked at how the provisioning services affect rural households' livelihood in the Tolon and Wa-West districts. The study examined the key dynamics of the provisioning services and discussed the major factors influencing their supply and utilization. The finding of the study was that, approximately 80% of the households in all study sites depend primarily on the provisioning services of the ecosystems for livelihood sustenance. It is therefore quite clear that livelihood of most households especially those in the Savannah area of Ghana depend much on the health of the ecosystems, hence the need for ecosystem studies cannot be overstated. 2.11.1 The theoretical concept of treatment effect model (Adjustment regression) A farmer uses EBFMPs in anticipation for improvement in his/her livelihood. Meanwhile, farmers who have improved livelihood may already have inherent characters that make them to have higher livelihood outcomes. These inherent characteristics might not be observable to researchers but could be contributing to the observed improved livelihoods of farmers. Thus, the unobservable factors together with the adoption of EBFMPs might be influencing livelihoods of farmers and this may bias the estimates if not dealt with. In order to deal with this therefore, the study employed a treatment effect model (regression adjustment) that allows for the true effect of the treatment (i.e. adoption of EBFMPs) on livelihoods of farmers to be determined. According to Verbeek (2008), a treatment effect refers to the impact of receiving a certain treatment (such as adoption of EBFMPs) upon a particular outcome variable (in this case, average livelihood status score (ALSS) of farmers). The treatment effect ensures that the effect on the outcome variable (livelihood) is solely attributed to the selection variable (adoption 45
www.udsspace.uds.edu.gh
category) and not any other factors (Verbeek, 2008). The key problem treatment effect solves is selection bias, which arises from the fact that high adopters of EBFMPs differ from low adopters of EBFMPs other than the adoption status as a sole reason. In reality, making a simple regression (ordinary least squares) comparison might yield misleading estimates of causal effects. As such, a treatment effect method (regression adjustment) would be more appropriate. The treatment effect method (regression adjustment) goes beyond the idea of using sample means to estimate treatment effects but rather, it uses a regression model to predict potential outcomes adjusted for the covariates (Stata, 2013). The advantage of the treatment effect model is that, it enables the researcher to determine the potential outcome means (POMs) of farmers’ livelihood, the average treatment effect (ATE) of adoption on farmers’ livelihood and the average treatment effect on the treated (ATET). According to Verbeek (2008), the treatment effects are computed mathematically as follows: 𝐺𝑖𝑣𝑒𝑛: 𝑡𝑖 = 𝑡𝑟𝑒𝑎𝑡𝑚𝑒𝑛𝑡 𝑐𝑎𝑡𝑒𝑔𝑜𝑟𝑦 (
𝑡𝑖 = 1 𝑓𝑜𝑟 𝑡𝑟𝑒𝑎𝑡𝑚𝑒𝑛𝑡 ) 𝑡𝑖 = 0 𝑓𝑜𝑟 𝑜𝑡ℎ𝑒𝑟𝑤𝑖𝑠𝑒
(6)
The treatment category can be likened to adoption category of this study, where 𝑡𝑖 = 1 represents high adopters of EBFMPs and 𝑡𝑖 = 0 represents low adopters of EBFMPs. In the study, a farmer is classified as a high adopter of EBFMPs if he/she uses four (4) or more EBFMPs. A farmer who uses less than four (4) is classified as a low adopter. 𝑦0 𝑖 = 𝑝𝑜𝑡𝑒𝑛𝑡𝑖𝑎𝑙 𝑜𝑢𝑡𝑐𝑜𝑚𝑒 𝑜𝑓 𝑙𝑖𝑣𝑒𝑙𝑖ℎ𝑜𝑜𝑑 𝑠𝑐𝑜𝑟𝑒 𝑓𝑜𝑟 𝑖𝑡ℎ 𝑓𝑎𝑟𝑚𝑒𝑟 𝑖𝑓 ℎ𝑒⁄𝑠ℎ𝑒 𝑖𝑠 𝑎 𝑙𝑜𝑤𝑒𝑟 𝑎𝑑𝑜𝑝𝑡𝑒𝑟 𝑦1 𝑖 = 𝑝𝑜𝑡𝑒𝑛𝑡𝑖𝑎𝑙 𝑜𝑢𝑡𝑐𝑜𝑚𝑒 𝑜𝑓 𝑙𝑖𝑣𝑒𝑙𝑖ℎ𝑜𝑜𝑑 𝑠𝑐𝑜𝑟𝑒 𝑓𝑜𝑟 𝑖𝑡ℎ 𝑓𝑎𝑟𝑚𝑒𝑟 𝑖𝑓 ℎ𝑒⁄𝑠ℎ𝑒 𝑖𝑠 𝑎 ℎ𝑖𝑔ℎ𝑒𝑟 𝑎𝑑𝑜𝑝𝑡𝑒𝑟 46
www.udsspace.uds.edu.gh
𝑡ℎ𝑒𝑛, 𝐴𝑇𝐸 ≡ 𝐸{𝑦1𝑖 − 𝑦0𝑖 |𝑥𝑖 }
(7)
𝑤ℎ𝑒𝑟𝑒: 𝐴𝑇𝐸 = 𝐴𝑣𝑒𝑟𝑎𝑔𝑒 𝑡𝑟𝑒𝑎𝑡𝑚𝑒𝑛𝑡 𝑒𝑓𝑓𝑒𝑐𝑡 𝑥𝑖 = 𝑐ℎ𝑎𝑟𝑎𝑐𝑡𝑒𝑟𝑖𝑠𝑡𝑖𝑐𝑠 𝑜𝑓 𝑖𝑡ℎ 𝑓𝑎𝑟𝑚𝑒𝑟 This estimation is however still criticized in the sense that, it does not give the effect on only those who have received treatment (Stata, 2013), which in this case is high users. In that regard, it will be prudent if the population of interest is properly specified by employing the average treatment effect on the treated (ATET). 𝐴𝑇𝐸𝑇 = 𝐸{𝑦1𝑖 − 𝑦0𝑖 |𝑥𝑖 , 𝑡𝑖 = 1}
(8)
According to Stata (2013), the potential outcome model specifies that the observed livelihood score (𝑦) is 𝑦0 when the adoption category (𝑡) = 0 and that 𝑦 is 𝑦1 when 𝑡 = 1. This is expressed mathematically as 𝑦 = (1 − 𝑡)𝑦0 + 𝑡𝑦1
(9)
The functional forms for 𝑦1 and 𝑦0 are: 𝑦0 = 𝑥 ′ 𝛽0 + 𝜀0
(10)
𝑦1 = 𝑥 ′ 𝛽1 + 𝜀1
(11)
2.12 Summary of Key Findings of the Literature Review and Conclusion Findings from the literature review suggest that the adoption level of ecosystem-based farm management practices (EBFMPs) in Ghana is low even though many programmes and policies have been carried out on sustainable land management. There is no much attention given to 47
www.udsspace.uds.edu.gh
farmers’ perceived knowledge of EBMFPs when considering the factors that determine the intensity of adoption of sustainable farm practices. The Poisson and Negative binomial models are considered efficient when analysing factors that determine the intensity of adoption (e.g. Bashiru et al., 2014; Garming and Waibel, 2007; Kim et al., 2005; Nkegbe and Shankar, 2014; Raghu and Manaloor, 2014; Ramirez and Shultz, 2000). The critical issue on the literature review was the controversy about how realistic it is to place value on ecosystem services and thus determining their true value (e.g Barbier et al., 2009; Fisher et al., 2011; Gómez-Baggethun and Ruiz-Pérez, 2011; Pascual et al., 2010; Rasul et al., 2011; Simpson, 2011). However, counter findings suggest that valuation of ecosystem services in any unit is just a mechanism of determining how people appreciate free resources provided by nature and not as perceived to be commodification of ecosystems (Costanza et al., 2014; De Groot et al., 2012). The contingency valuation method has also been acknowledged as one of the effective tools in eliciting people’s WTP value even though the tool has its own flaws (e.g. Costanza et al., 2014; Fisher et al., 2011; Pascual et al., 2010; Rasul et al., 2011). Another key issue on the literature review was about how people’s livelihoods are closely tied with nature or the ecosystems. The findings suggested that livelihoods of most people in the Africa continent depend on the health of the ecosystems and the services provided (e.g. Boafo et al., 2014; Hapsari, 2010; MA, 2007, MA, 2005; Mwingyine, 2008). These findings from the literature review show that a study to consider the ecosystem-based farm management practices (EBFMPs) that exist in a particular agro-ecosystem, determine the factors that significantly influence farmers’ adoption, determine farmer’s WTP value for the sustainability of the EBMFPs and how this generally affect their livelihood is relevant.
48
www.udsspace.uds.edu.gh
CHAPTER THREE METHODOLOGY 3.1 The Study Setting The study was conducted in the Kassena-Nankana area (KNA) of Upper East Region, Ghana. The Kassena-Nankana area is made up of the Kassena-Nankana West and the Kassena-Nankana East Districts. The Upper East Region in which the study districts are located falls within the Sudan-Savannah Vegetation Zone with only one raining season in a year (May-September). The Upper East Region, with Bolgatanga as the capital has a total population of 1,046,545 with 506,405 (48.39%) males and 540,140 (51.61%) females (GSS, 2012). The region can boast of prominent irrigation schemes such as the Tono and Vea irrigation schemes, which are largely used for dry-season agricultural activities. The region is located at the north eastern-most part of Ghana. It shares borders with Burkina Faso to the north, Togo to the east, Upper West Region to the west and Northern Region to the south. The Kassena-Nankana area also has a total population of 180,611 with about 61% from the Kassena-Nankana East and 39% from the Kassena-Nankana West (GSS, 2012). From Figure 3.1, the Kassena-Nankana area shares boundaries with Burkina Faso to the north, Bolgatanga Municipal to the east and Builsa District to the south-west. About 69% of the total population in the area are into agriculture (http://kassenanankana.ghanadistricts.gov.gh/?arrow=atd&_=105&s a=1271). The Tono irrigation scheme (Government managed) is located in the Kassena-Nankana East District specifically Navrongo. Also, a lot of community-managed irrigation schemes are located in the same area.
49
www.udsspace.uds.edu.gh
The Tono irrigation Project is one of the two irrigation projects under the management of Irrigation Company of the Upper Region (ICOUR). The scheme lies between latitude 10o451N and longitude 1oW. It has a potential area of about 3,840ha with an irrigable or developed area of 2,490ha (http://mofa.gov.gh/site/?page_id=3032). The main source of water for irrigation is from the Tono dam. The community-managed irrigation schemes in the Kassena-Nankana area are numerous but a few include the Saboro irrigation scheme, Doba irrigation scheme, Goo irrigation scheme, Nembasinia irrigation scheme, and Pungu-Talenia irrigation scheme.
Study area
Figure 3.1: A map of Kassena-Nankana Area (KNA) in Upper East Region of Ghana Source: https://www.researchgate.net/figure/281340874_fig2
50
www.udsspace.uds.edu.gh
3.2 Sampling Procedure and Sample Size 3.2.1 Sampling procedure The multistage sampling technique was employed for the study. In the first stage of the sampling, the schemes were divided into community-managed and government-managed irrigation schemes of which three (3) communities each were randomly selected from the community-managed and government-managed irrigation schemes. The three (3) randomly selected for the community-managed irrigation schemes are Paga-Nania, Saboro and PunguTelania communities and that of the government-managed irrigation scheme are Bonia, Korania and Biu communities (Figure 3.2). In the second stage, a non-proportionate simple random sampling technique (Agyedu et al., 2013) was used to select the required number of irrigated households from each community. Fifty (50) irrigated households were sampled for each community as shown in Figure 3.2. According to Agyedu et al. (2013), for any meaningful and more precise comparisons to be made, then a constant sample from each group, in this case community is critical. In the last stage, one irrigator was randomly selected from each irrigated household for the questionnaire administration.
51
www.udsspace.uds.edu.gh
50 Irrigated households
irrigation scheme Government Managed Korania irrigation scheme
50 Irrigated households
Biu irrigation scheme
50 Irrigated households
Paga irrigation scheme
50 Irrigated households
Saboro irrigation scheme
50 Irrigated households
Pungu-Telania Irrigation Scheme
50 Irrigated households
Irrigation Schemes
Community Managed Irrigation Schemes
First Stage: Simple random technique
Second Stage: Simple random technique
A Total Sample of 300 Farmers selected from each household
Bonia
Last Stage
Figure 3.2: Diagram showing the sampling procedure and sample size Source: Author’s construction (2016). 3.2.2. Sample size determination From the Navrongo Health Research Centre (Unpublished), a total of 2,590 households can be identified from the six selected communities with Saboro having 471 (18%) households, Pungu-Talenia with 447 (17%) households, Korania with 361 (14%), Bonia with 311(12%), Biu with 608 (24%) and Paga-Nania with 392 (15%). Again, from personal extrapolation, about 70% (1813) of the households in the selected communities are irrigated households which falls in line
52
www.udsspace.uds.edu.gh
with the estimated figure of 68.6% of Kassena-Nankana population engaged in agriculture (http://kassenanankana.ghanadistricts.gov.gh/?arrow=atd&_=105&sa=1271). From the sample frame of 1813 irrigated households, 300 households (about 17% of the sample frame) were selected randomly for the study with each community being allocated fifty households each. The selection of 17% is consistent with the view of Agyedu et al. (2013) that a sample of 10 percent to 20 percent of any population is always enough to generate confidence in the data collected and for subsequent generalisations.
3.3 Type of Data Collected and Instruments Used Primary data in the form of quantitative and qualitative data were collected for the analysis. Semi-structured (open and closed ended) questionnaires were used for data collection. The questionnaire administration was done through face-to-face interactions with farmers in the six selected communities. The data collection was done from January to February, 2016.
3.4 Analytical Framework The data were entered in Excel 2013 and exported to Stata13 for analysis. The study employed descriptive statistics, inferential statistics and econometric models to analyse the data and the results presented in the form of tables, charts, and diagrams. The proceeding subsections describe in detail how the objectives were achieved. 3.4.1 Identification and description of EBFMPs used by farmers in KNA Since the first objective is more qualitative in nature, descriptive statistics was used to analyse it. To identify the number of EBFMPs used, data were collected on the farm practices employed by each farmer in irrigation and rain-fed farming. These practices were then grouped
53
www.udsspace.uds.edu.gh
into EBFMPs and non-EBFMPs. The mean percentages of each EBFMP used by farmers under community and government managed irrigation schemes were then computed to describe the percentage at which each EBFMP was used by farmers under the two types of irrigation schemes. The results were presented in tables and charts followed by narrative descriptions of each EBFMP and the role played in maintaining the health of the agro-ecosystems. Pictures were used to give a picturesque understanding of the EBFMPs employed by farmers. 3.4.2 Estimating factors influencing the adoption of EBFMPs in KNA The second objective seeks to examine the factors that influence the adoption of EBFMPs. As such, the Poisson and negative binomial models were employed to achieve that objective. These count models (Poisson and negative binomial models) were used because the farm practices are discrete and a farmer can practice two or more ecosystem-based farm management practices within a season. 3.4.2.1 Empirical model for identifying the determinants of EBFMPs In order to identify the determinants of adoption of the ecosystem-based farm management practices (EBFMPs) by the farmers, the study regressed the log of the number of EBFMPs used by farmers on the socio-economic factors. First of all, the data were divided into two and regressed differently for the community managed and government managed irrigation schemes. Secondly, the composite data were used to regress the log number of EBFMPs used by farmers on the socio-economic factors. Community managed irrigation scheme (CIS) 𝐿𝑜𝑔𝑦𝑖 = 𝛽0 + 𝛽1 𝐴𝑔𝑒𝑖 + 𝛽2 𝑠𝑒𝑥𝑖 + 𝛽3 𝐸𝑑𝑢𝑐_𝑑.𝑖 + 𝛽4 𝐸𝑥𝑡. 𝑠𝑒𝑟𝑣.𝑖 + 𝛽5 𝐹𝑚. 𝑑𝑖𝑠𝑡𝑎𝑛𝑐𝑒𝑖 + 𝛽6 𝑆𝑜𝑖𝑙. 𝑝𝑒𝑟𝑐𝑒𝑝𝑡𝑛𝑖 + 𝛽7 𝐹𝑠𝑖𝑧𝑒𝑖 + 𝛽8 𝐾𝑛𝑤. 𝐸𝐵𝑀𝐹𝑃𝑖 + 𝜀𝑖
54
(12)
www.udsspace.uds.edu.gh
Government managed irrigation scheme (GIS) 𝐿𝑜𝑔𝑦𝑖 = 𝛽0 + 𝛽1 𝐴𝑔𝑒𝑖 + 𝛽2 𝑠𝑒𝑥𝑖 + 𝛽3 𝐸𝑑𝑢𝑐_𝑑.𝑖 + 𝛽4 𝐸𝑥𝑡. 𝑠𝑒𝑟𝑣.𝑖 + 𝛽5 𝐹𝑚. 𝑑𝑖𝑠𝑡𝑎𝑛𝑐𝑒𝑖 + 𝛽6 𝑆𝑜𝑖𝑙. 𝑝𝑒𝑟𝑐𝑒𝑝𝑡𝑛𝑖 + 𝛽7 𝐹𝑠𝑖𝑧𝑒𝑖 + 𝛽8 𝐾𝑛𝑤. 𝐸𝐵𝑀𝐹𝑃𝑖 + 𝜀𝑖
(13)
Government and Community managed irrigation schemes (overall) 𝐿𝑜𝑔𝑦𝑖 = 𝛽0 + 𝛽1 𝐴𝑔𝑒𝑖 + 𝛽2 𝑠𝑒𝑥𝑖 + 𝛽3 𝐸𝑑𝑢𝑐_𝑑.𝑖 + 𝛽4 𝐸𝑥𝑡. 𝑣𝑖𝑠𝑖𝑡𝑠.𝑖 + 𝛽5 𝐹𝑚. 𝑑𝑖𝑠𝑡𝑎𝑛𝑐𝑒. 𝑖𝑟𝑟𝑖 + +𝛽6 𝑆𝑜𝑖𝑙. 𝑝𝑒𝑟𝑐𝑒𝑝𝑡𝑛𝑖 + 𝛽7 𝐹𝑠𝑖𝑧𝑒. 𝑖𝑟𝑟𝑖 + 𝛽8 𝐾𝑛𝑤. 𝐸𝐵𝑀𝐹𝑃𝑖 + 𝛽9 𝐼𝑟𝑖𝑔𝑖 + 𝜀𝑖
(14)
𝑤ℎ𝑒𝑟𝑒: 𝐴𝑔𝑒𝑖 = 𝐴𝑔𝑒 𝑜𝑓 𝑓𝑎𝑟𝑚𝑒𝑟 𝑆𝑒𝑥𝑖 = 𝑆𝑒𝑥 (1 = 𝑖𝑓 𝑓𝑒𝑚𝑎𝑙𝑒,
0 = 𝑚𝑎𝑙𝑒)
𝐸𝑑𝑢𝑐_𝑑.𝑖 = 𝐸𝑑𝑢𝑐𝑎𝑡𝑖𝑜𝑛 (1 = ℎ𝑎𝑑 𝑓𝑜𝑟𝑚𝑎𝑙 𝑒𝑑𝑢𝑐𝑎𝑡𝑖𝑜𝑛 (𝐽𝐻𝑆 𝑒𝑑𝑢𝑐𝑎𝑡𝑖𝑜𝑛 𝑎𝑛𝑑 𝑎𝑏𝑜𝑣𝑒), 0 = 𝑝𝑟𝑖𝑚𝑎𝑟𝑦 𝑎𝑛𝑑 𝑛𝑜 𝑓𝑜𝑟𝑚𝑎𝑙 𝑒𝑑𝑢𝑐𝑎𝑡𝑖𝑜𝑛) 𝐸𝑥𝑡. 𝑣𝑖𝑠𝑖𝑡𝑠𝑖 = 𝐸𝑥𝑡𝑒𝑛𝑠𝑖𝑜𝑛 𝑣𝑖𝑠𝑖𝑡𝑠 (1 = 𝑟𝑒𝑐𝑒𝑖𝑣𝑒𝑑 𝑎𝑡 𝑙𝑒𝑎𝑠𝑡 2 𝑒𝑥𝑡𝑒𝑛𝑠𝑖𝑜𝑛 𝑠𝑒𝑟𝑣𝑖𝑐𝑒𝑠 𝑙𝑎𝑠𝑡 𝑠𝑒𝑎𝑠𝑜𝑛, 0 = 𝑟𝑒𝑐𝑒𝑖𝑣𝑒𝑑 1 𝑜𝑟 𝑛𝑜 𝑒𝑥𝑡𝑒𝑛𝑠𝑖𝑜𝑛 𝑠𝑒𝑟𝑣𝑖𝑐𝑒 𝑙𝑎𝑠𝑡 𝑠𝑒𝑎𝑠𝑜𝑛) 𝐹𝑚. 𝑑𝑖𝑠𝑡𝑎𝑛𝑐𝑒. 𝑖𝑟𝑟𝑖 = 𝐼𝑟𝑟𝑖𝑔𝑎𝑏𝑙𝑒 𝑓𝑎𝑟𝑚 𝑑𝑖𝑠𝑡𝑎𝑛𝑐𝑒 𝑓𝑟𝑜𝑚 ℎ𝑜𝑚𝑒 ( 𝑘𝑖𝑙𝑜𝑚𝑒𝑡𝑒𝑟𝑠) 𝑆𝑜𝑖𝑙. 𝑝𝑒𝑟𝑐𝑒𝑝𝑡𝑛𝑖 = 𝑓𝑎𝑟𝑚𝑒𝑟𝑠 ′ 𝑝𝑒𝑟𝑐𝑒𝑝𝑡𝑖𝑜𝑛 𝑜𝑓 𝑖𝑟𝑟𝑖𝑔𝑎𝑡𝑒𝑑 𝑓𝑎𝑟𝑚 𝑠𝑜𝑖𝑙 𝑓𝑒𝑟𝑡𝑖𝑙𝑖𝑡𝑦 (1 = 𝑓𝑒𝑟𝑡𝑖𝑙𝑒, 0 = 𝑛𝑜𝑡 𝑓𝑒𝑟𝑡𝑖𝑙𝑒) 𝐹𝑠𝑖𝑧𝑒. 𝑖𝑟𝑟𝑖 = 𝐼𝑟𝑟𝑖𝑔𝑎𝑏𝑙𝑒 𝑓𝑎𝑟𝑚 𝑠𝑖𝑧𝑒 𝐾𝑛𝑤. 𝐸𝐵𝐹𝑀𝑃𝑖 = 𝑃𝑒𝑟𝑐𝑒𝑖𝑣𝑒𝑑 𝑘𝑛𝑜𝑤𝑙𝑒𝑑𝑔𝑒 𝑜𝑓 𝐸𝐵𝐹𝑀𝑃𝑠 (𝑖𝑛𝑑𝑒𝑥𝑒𝑑 𝑜𝑛 𝑡ℎ𝑒 𝑖𝑚𝑝𝑜𝑟𝑡𝑎𝑛𝑐𝑒 𝑜𝑓 𝐸𝐵𝐹𝑀𝑃𝑠) 𝐼𝑟𝑖𝑔_𝑡𝑦𝑝𝑒𝑖 = 𝑐𝑎𝑡𝑒𝑔𝑜𝑟𝑦 𝑜𝑓 𝑖𝑟𝑟𝑖𝑔𝑎𝑡𝑖𝑜𝑛 (1 = 𝑖𝑓 𝑐𝑜𝑚𝑚𝑢𝑛𝑖𝑡𝑦 𝑚𝑎𝑛𝑎𝑔𝑒𝑑, 0 = 𝑖𝑓 𝑔𝑜𝑣𝑒𝑟𝑛𝑚𝑒𝑛𝑡 𝑚𝑎𝑛𝑎𝑔𝑒𝑑)
55
www.udsspace.uds.edu.gh
𝑌𝑖 = [ 0 = 𝑖𝑓 𝑓𝑎𝑟𝑚𝑒𝑟 𝑓𝑎𝑖𝑙𝑠 𝑡𝑜 𝑎𝑑𝑜𝑝𝑡 𝑎𝑛𝑦 𝑜𝑓 𝑡ℎ𝑒 𝑝𝑟𝑎𝑐𝑡𝑖𝑐𝑒𝑠, 1 = 𝑖𝑓 𝑓𝑎𝑟𝑚𝑒𝑟 𝑎𝑑𝑜𝑝𝑡𝑠 𝑜𝑛𝑙𝑦 𝑜𝑛𝑒, 2 = 𝑖𝑓 𝑓𝑎𝑟𝑚𝑒𝑟 𝑎𝑑𝑜𝑝𝑡𝑠 𝑡𝑤𝑜, 3 = 𝑖𝑓 𝑓𝑎𝑟𝑚𝑒𝑟 𝑎𝑑𝑜𝑝𝑡𝑠 𝑡ℎ𝑟𝑒𝑒, 4 = 𝑖𝑓 𝑓𝑎𝑟𝑚𝑒𝑟 𝑎𝑑𝑜𝑝𝑡𝑠 𝑓𝑜𝑢𝑟, 5 = 𝑖𝑓 𝑓𝑎𝑟𝑚𝑒𝑟 𝑎𝑑𝑜𝑝𝑡𝑠 𝑓𝑖𝑣𝑒, . . . 𝑛]
Table 3.1: Definition of variables and apriori expectations for adoption models Variable
Variable definition
Units of measurement
Expected Sign
Y
EBFMP
Number of EBFMPs used
Age
Age
Years
+/-
Sex
Sex
Dummy (1=female, 0=male)
+/-
Educ_d
Education
Ext.serv.
Extension services
Dummy (1=had formal + education (JHS and above), 0=below JHS) Dummy (1=received at least 2 + extension services last season, 0= received 1 or no extension service)
Fm.distance.irr
Distance of irrigated from Kilometers
-
home Soil.perceptn
Farmers’ perception of soil Dummy (1=fertile, 0=not fertile) fertility
Fsize.irr
Irrigable farm size
Knw.EBFMP
Perceived Knowledge of Indexed
Irig_type
Acres
on
each
EBFMP +
EBMFPs
importance stated
Category of irrigation
Dummy ( 1= CIS, 0=GIS)
Source: Author’s construction, 2016.
56
+
www.udsspace.uds.edu.gh
3.4.3 Computing WTP value for EBFMPs sustainability and willingness to pay levels The Contingent Valuation Method (CVM) was used to elicit farmers’ willingness to pay (WTP) for the sustainability of the EBFMPs and the value they are willing to pay. The iterative bidding technique was employed to determine the amounts (in Ghana cedi) farmers are willing to pay to sustain the services provided by the EBFMPs. The amount a farmer is willing to pay to sustain the EBFMPs was obtained by finding the average value of minimum and maximum amounts he/she is willing to pay, which is presented mathematically as follows:
𝑊𝑇𝑃𝑖 =
𝑀𝑖𝑛𝑖𝑊𝑇𝑃 + 𝑀𝑎𝑥𝑖𝑊𝑇𝑃
(15)
2
𝑤ℎ𝑒𝑟𝑒: 𝑊𝑇𝑃𝑖 = 𝑡ℎ𝑒 𝑎𝑚𝑜𝑢𝑛𝑡 𝑎 𝑓𝑎𝑟𝑚𝑒𝑟 𝑖𝑠 𝑤𝑖𝑙𝑙𝑖𝑛𝑔 𝑡𝑜 𝑝𝑎𝑦 𝑡𝑜 𝑠𝑢𝑠𝑡𝑎𝑖𝑛 𝑡ℎ𝑒 𝐸𝐵𝐹𝑀𝑃𝑠 𝑀𝑖𝑛𝑖𝑊𝑇𝑃 = 𝑡ℎ𝑒 𝑚𝑖𝑛𝑖𝑚𝑢𝑚 𝑎𝑚𝑜𝑢𝑛𝑡 𝑎 𝑓𝑎𝑟𝑚𝑒𝑟 𝑖𝑠 𝑤𝑖𝑙𝑙𝑖𝑛𝑔 𝑡𝑜 𝑝𝑎𝑦 𝑡𝑜 𝑠𝑢𝑠𝑡𝑎𝑖𝑛 𝑡ℎ𝑒 𝐸𝐵𝐹𝑀𝑃𝑠 𝑀𝑎𝑥𝑖𝑊𝑇𝑃 = 𝑡ℎ𝑒 𝑚𝑎𝑥𝑖𝑚𝑢𝑚 𝑎𝑚𝑜𝑢𝑛𝑡 𝑎 𝑓𝑎𝑟𝑚𝑒𝑟 𝑖𝑠 𝑤𝑖𝑙𝑙𝑖𝑛𝑔 𝑡𝑜 𝑝𝑎𝑦 𝑡𝑜 𝑠𝑢𝑠𝑡𝑎𝑖𝑛 𝑡ℎ𝑒 𝐸𝐵𝐹𝑀𝑃𝑠 This was to ensure that farmers do not overvalue or undervalue the services provided by the EBFMPs. The mean willingness to pay amount by farmers for sustaining the EBFMPs was then computed as follows: ̅̅̅̅̅̅̅ = 𝑊𝑇𝑃
∑ 𝑊𝑇𝑃𝑖 𝑛
(16)
𝑤ℎ𝑒𝑟𝑒: ̅̅̅̅̅̅̅ = 𝑡ℎ𝑒 𝑚𝑒𝑎𝑛 𝑎𝑚𝑜𝑢𝑛𝑡 𝑓𝑎𝑟𝑚𝑒𝑟𝑠 𝑎𝑟𝑒 𝑤𝑖𝑙𝑙𝑖𝑛𝑔 𝑡𝑜 𝑝𝑎𝑦 𝑡𝑜 𝑠𝑢𝑠𝑡𝑎𝑖𝑛 𝐸𝐵𝐹𝑀𝑃𝑠 𝑊𝑇𝑃 ∑ 𝑊𝑇𝑃𝑖 = 𝑠𝑢𝑚 𝑜𝑓 𝑖𝑛𝑑𝑖𝑣𝑖𝑑𝑢𝑎𝑙 𝑓𝑎𝑟𝑚𝑒𝑟𝑠 ′ 𝑤𝑖𝑙𝑙𝑖𝑛𝑔𝑛𝑒𝑠𝑠 𝑡𝑜 𝑝𝑎𝑦 𝑎𝑚𝑜𝑢𝑛𝑡 𝑡𝑜 𝑠𝑢𝑠𝑡𝑎𝑖𝑛 𝐸𝐵𝐹𝑀𝑃𝑠 𝑛 = 𝑛𝑢𝑚𝑏𝑒𝑟 𝑜𝑓 𝑖𝑛𝑑𝑖𝑣𝑖𝑑𝑢𝑎𝑙 𝑓𝑎𝑟𝑚𝑒𝑟𝑠 57
www.udsspace.uds.edu.gh
The mean comparison t-test was used to test whether there is statistical significant difference in the mean willingness to pay values for farmers under community-managed irrigation schemes and government-managed irrigation scheme. It further tests which particular irrigation scheme type have a greater mean willingness to pay value. Charts were used to present the proportion of farmers willing to pay for EBFMPs sustainability under the community-managed and government-managed irrigation schemes. 3.4.4 Estimating the effects of using EBFMPs on livelihoods of farmers The forth objective seeks to analyse the effect of EBFMPs on the livelihood outcomes of farmers. As such, a treatment effect model (regression adjustment) was used to achieve that objective. This was to ensure that farmers are placed at the same pedestal for the true effect of the EBFMPs to be achieved. Again, an average livelihood status score (indexed) was used to measure the livelihoods of the farmers. The proceeding subsections give details of how the treatment effect model was employed and how farmers’ livelihood was measured. 3.4.4.1 Empirical representation of treatment effects The empirical representation for determining the treatment effects of EBFMPs adoption on livelihoods of farmers are expressed as: 𝐴𝑇𝐸 = 𝐸(𝑦1𝑖 − 𝑦0𝑖 |𝐴𝑔𝑒𝑖 , 𝑆𝑒𝑥𝑖 , 𝐸𝑑𝑢𝑐𝑑𝑖 , 𝐻𝐻. 𝑠𝑖𝑧𝑒𝑖 , 𝐹. 𝑠𝑖𝑧𝑒. 𝑖𝑟𝑟𝑖 , 𝑅𝑒𝑚𝑖𝑡𝑡𝑎𝑛𝑐𝑒𝑠𝑖 , 𝑂𝑓𝑓 − 𝑓𝑎𝑟𝑚 𝑖𝑛𝑐𝑖 . , 𝐼𝑟𝑟𝑖𝑔_𝑡𝑦𝑝𝑒𝑖 )
(17)
𝐴𝑇𝐸𝑇 = 𝐸(𝑦1𝑖 − 𝑦0𝑖 |𝐴𝑔𝑒𝑖 , 𝑆𝑒𝑥𝑖 , 𝐸𝑑𝑢𝑐𝑑𝑖 , 𝐻𝐻. 𝑠𝑖𝑧𝑒𝑖 , 𝐹. 𝑠𝑖𝑧𝑒. 𝑖𝑟𝑟𝑖 , 𝑅𝑒𝑚𝑖𝑡𝑡𝑎𝑛𝑐𝑒𝑠𝑖 , 𝑂𝑓𝑓 − 𝑓𝑎𝑟𝑚 𝑖𝑛𝑐𝑖 . , 𝐼𝑟𝑟𝑖𝑔_𝑡𝑦𝑝𝑒𝑖 , 𝑡 = 1) (18) The functional forms of the potential outcome models are: 𝑦1𝑖 = 𝛽0 + 𝛽1 𝐴𝑔𝑒𝑖 + 𝛽2 𝑆𝑒𝑥𝑖 + 𝛽3 𝐸𝑑𝑢𝑐. 𝑑𝑖 + 𝛽4 𝐻𝐻. 𝑠𝑖𝑧𝑒𝑖 + 𝛽5 𝐹. 𝑠𝑖𝑧𝑒. 𝑖𝑟𝑟𝑖 + 𝛽6 𝑅𝑒𝑚𝑖𝑡𝑡𝑎𝑛𝑐𝑒𝑠 + 𝛽7 𝑂𝑓𝑓 − 𝑓𝑚. 𝑖𝑛𝑐𝑖 + 𝛽8 𝐼𝑟𝑟𝑖𝑔. 𝑡𝑦𝑝𝑒𝑖 + 𝜀𝑖 58
(19)
www.udsspace.uds.edu.gh
𝑦0𝑖 = 𝛽0 + 𝛽1 𝐴𝑔𝑒𝑖 + 𝛽2 𝑆𝑒𝑥𝑖 + 𝛽3 𝐸𝑑𝑢𝑐. 𝑑𝑖 + 𝛽4 𝐻𝐻. 𝑠𝑖𝑧𝑒𝑖 + 𝛽5 𝐹. 𝑠𝑖𝑧𝑒. 𝑖𝑟𝑟 + 𝛽6 𝑅𝑒𝑚𝑖𝑡𝑡𝑎𝑛𝑐𝑒𝑠 + 𝛽7 𝑂𝑓𝑓 − 𝑓𝑚. 𝑖𝑛𝑐𝑖 + 𝛽8 𝐼𝑟𝑟𝑖𝑔. 𝑡𝑦𝑝𝑒𝑖 + 𝜀𝑖 (20)
𝑤ℎ𝑒𝑟𝑒: 𝑦1𝑖 = 𝑝𝑜𝑡𝑒𝑛𝑡𝑖𝑎𝑙 𝑜𝑢𝑡𝑐𝑜𝑚𝑒 𝑜𝑓 𝑎𝑣𝑒𝑟𝑎𝑔𝑒 𝑙𝑖𝑣𝑒𝑙𝑖ℎ𝑜𝑜𝑑 𝑠𝑡𝑎𝑡𝑢𝑠 𝑠𝑐𝑜𝑟𝑒 (𝐴𝐿𝑆𝑆) 𝑖𝑓𝑓𝑎𝑟𝑚𝑒𝑟 ℎ𝑎𝑑 𝑎𝑑𝑜𝑝𝑡𝑒𝑑 ℎ𝑖𝑔ℎ 𝑦0𝑖 = 𝑝𝑜𝑡𝑒𝑛𝑡𝑖𝑎𝑙 𝑜𝑢𝑡𝑐𝑜𝑚𝑒 𝑜𝑓 𝑎𝑣𝑒𝑟𝑎𝑔𝑒 𝑙𝑖𝑣𝑒𝑙𝑖ℎ𝑜𝑜𝑑 𝑠𝑡𝑎𝑡𝑢𝑠 𝑠𝑐𝑜𝑟𝑒 (𝐴𝐿𝑆𝑆) 𝑖𝑓 𝑓𝑎𝑟𝑚𝑒𝑟 ℎ𝑎𝑑 𝑎𝑑𝑜𝑝𝑡𝑒𝑑 𝑙𝑜𝑤 𝐴𝑔𝑒𝑖 = 𝐴𝑔𝑒 𝑜𝑓 𝑓𝑎𝑟𝑚𝑒𝑟 𝑆𝑒𝑥𝑖 = 𝑠𝑒𝑥 𝑜𝑓 𝑓𝑎𝑟𝑚𝑒𝑟(1 = 𝑓𝑒𝑚𝑎𝑙𝑒, 0 = 𝑚𝑎𝑙𝑒) 𝐸𝑑𝑢𝑐. 𝑑𝑖 = 𝐸𝑑𝑢𝑐𝑎𝑡𝑖𝑜𝑛 𝑙𝑒𝑣𝑒𝑙 (1 = ℎ𝑎𝑑 𝑓𝑜𝑟𝑚𝑎𝑙 𝑜𝑓 𝑒𝑑𝑢𝑐𝑎𝑡𝑖𝑜𝑛 (𝐽𝐻𝑆 𝑒𝑑𝑢𝑐𝑎𝑡𝑖𝑜𝑛 𝑎𝑛𝑑 𝑎𝑏𝑜𝑣𝑒), 0 = 𝑛𝑜 𝑓𝑜𝑟𝑚𝑎𝑙 𝑒𝑑𝑢𝑐𝑎𝑡𝑖𝑜𝑛) 𝐻𝐻. 𝑠𝑖𝑧𝑒𝑖 = 𝐻𝑜𝑢𝑠𝑒ℎ𝑜𝑙𝑑 𝑠𝑖𝑧𝑒 𝐹. 𝑠𝑖𝑧𝑒𝑖 = 𝐼𝑟𝑟𝑖𝑔𝑎𝑏𝑙𝑒 𝑓𝑎𝑟𝑚 𝑠𝑖𝑧𝑒 𝑜𝑓 𝑟𝑒𝑠𝑝𝑜𝑛𝑑𝑒𝑛𝑡 𝑅𝑒𝑚𝑖𝑡𝑡𝑎𝑛𝑐𝑒𝑠𝑖 = 𝑅𝑒𝑚𝑖𝑡𝑡𝑎𝑛𝑐𝑒𝑠 𝑟𝑒𝑐𝑒𝑖𝑣𝑒𝑑 𝑖𝑛 𝐺𝐻₵ 𝑂𝑓𝑓 − 𝑓𝑚. 𝑖𝑛𝑐𝑖 = 𝑂𝑓𝑓 − 𝑓𝑎𝑟𝑚 𝑖𝑛𝑐𝑜𝑚𝑒 𝑖𝑛 𝐺𝐻₵ 𝐼𝑟𝑟𝑖𝑔. 𝑡𝑦𝑝𝑒𝑖 = 𝑇𝑦𝑝𝑒 𝑜𝑓 𝑖𝑟𝑟𝑖𝑔𝑎𝑡𝑖𝑜𝑛 𝑠𝑐ℎ𝑒𝑚𝑒 (1 = 𝑖𝑓 𝑐𝑜𝑚𝑚𝑢𝑛𝑖𝑡𝑦 𝑚𝑎𝑛𝑎𝑔𝑒𝑑, 0 = 𝑖𝑓 𝑔𝑜𝑣𝑒𝑟𝑛𝑚𝑒𝑛𝑡 𝑚𝑎𝑛𝑎𝑔𝑒𝑑) Note: With regression adjustment, we do not need to specify the treatment model but only required to select the treatment variable (Stata, 2013).
59
www.udsspace.uds.edu.gh
Table 3.2: Definition of variables and apriori expectations for treatment effect model
Variable
Variable definition
Units of measurement
Expected Sign
ALSS
Average livelihood status Index of livelihood indicators score
Age
Age
Years
+/-
Sex
Sex
Dummy (1=female, 0=male)
+/-
Educ.d
Education
Dummy (1=had formal education + (JHS and above), 0= below JHS)
HH.size
Household size
Number of people in household
+
F.size
Irrigable farm size
Acres
+
Remittances
Remittances
Ghana cedi
+
Off-fm.inc
Off-farm income
Ghana cedi
+
Irrig_type
Category of irrigation
Dummy ( 1=CIS, 0=GIS)
+/-
Source: Author’s construction, 2016. 3.5.3.2 Livelihood indicators and measurement of ALSS of farmers There are indicators that one needs to consider when measuring livelihood. The indicators that were used to measure the livelihoods of farmers include food availability, housing condition, health situation, water facilities, sanitation, participation in social activities, decision-making in cash expenditure (Sheheli, 2012), health of the ecosystem services and income. The ‘Average Livelihood Status Score’, adopted and modified from Sheheli (2012) was used to measure the livelihood status of the farmers. The above mentioned livelihood indicators were indexed to compute the average livelihood status score of the farmers. Below is a detail discussion of these livelihood indicators and how they were measured.
60
www.udsspace.uds.edu.gh
a) Food availability Food availability is one of the major indicators used to determine the livelihood status of people. It has a multi-dimensional effect on people's nutritional health, education and general physical soundness of which a setting like Ghana is not an exception (Young et al, 2001). The food availability indicator was measured by considering the accessibility of food in farmer’s household throughout the whole year. The scoring for food availability was ‘3’ for sufficient, ‘2’ for insufficient and ‘1’ for extreme shortage. The total score for food availability ranged from 12 to 36. A person with a score of 36 means the person is food sufficient throughout the year. On the other side, a person with a score of 12 means the person has extreme shortage of food. Appendix B gives a tabular representation of how food availability was scored and measured. b) Housing condition To measure the livelihood of a person, then one needs to consider the housing condition of that individual. Housing is an important asset to farmers as it serves as shelter and sometimes used for both productive (renting rooms) and reproductive purposes (Meikle, 2002). The housing condition indicator was measured by considering the current condition of farmers' house facilities. Some of the facilities that were considered include number of rooms that are roofed with roofing sheets, number of rooms built with cement blocks, number of rooms floored, ownership of house and general impression. The overall score of a farmer was obtained by summing the scores from the five housing characteristics. The possible score ranged from 5 to 16. A score of 16 represented a farmer with owned house and of better condition and a score of 5 represents a farmer in a poor condition house. See appendix B for details on scoring and measurement.
61
www.udsspace.uds.edu.gh
c) Health situation The health of a person and the household is very important for his/her total development. In that regard, including health characteristics in the analysis is paramount to determine the livelihood status of the farmers. The health situation of farmers was considered in two perspectives namely; availability of health facility and access to health treatment. The availability of health facility was measured with a maximum score of 2 and a minimum score of 1. The access to health treatment was measured by considering whether a farmer’s household are subscribers of the National Health Insurance Scheme (NHIS) or have money to access health treatment. The maximum score was 9 meaning a farmer always has full access to health treatment and the minimum score was 3 meaning a farmer has no access to health treatment. Appendix B gives a further explanation of how farmers’ health situation was measured. d) Water facilities The water facilities indicator was also measured in three dimensions- water sources, availability of drinking water and perceived quality of drinking water. The source of water was measured by considering the sources farmers’ households get water for drinking, cooking, bathing and other domestic purposes. Here, the possible score ranged from 1 to 4 with 4 being the maximum score and 1 the minimum score. Water from borehole/pipe was scored 4, mechanized well 3, uncovered well 2 and water from river/pond 1. Perceived quality of drinking water score ranged from 1 to 3. A farmer who perceives the water to be good or clean was scored 3, a score of 2 was given to a farmer who perceives the water to be clean but smells and a minimum score was given to a farmer who perceives the water to be unclean. Water availability was measured considering if it is adequate, inadequate or scarce. The score ranged from 12 to 36. A maximum score of 36 means the farmer has adequate water available throughout the year and 62
www.udsspace.uds.edu.gh
a minimum score of 12 means the farmer has scarcity of water. The total score for water facilities was obtained by summing all the three dimensions. The score ranged from 14 to 43 as shown in appendix B. e) Decision-making in cash expenditure This refers to the level of decision making of a farmer on how to spend money on household demands. The household demands include daily expenditure, investment on land, children's education, health and household assets. The score for this indicator ranged from 5 to 20, where 5 indicates ‘low level of decision-making on cash expenditure’, i.e., the farmer depends highly on extended family members to take decisions, and a maximum score of 20 indicates ‘high level of decision-making on cash expenditure’, i.e. the farmer takes all decisions by himself/herself. See appendix B for details on measurement. f) Sanitation Sanitation is another key indicator for measuring livelihood especially in the Ghanaian setting. This was measured by considering two sub-dimensions- possession of a toilet facility and condition of the toilet. Possession of a toilet facility ranged from 1 to 3 with 3 being the maximum score indicating a farmer who have his/her own household toilet, a score of 2 for those depending on public toilets and 1 being the minimum score representing a farmer with no toilet facility. The condition of the toilet also ranged from 1 to 3 with 3 representing a farmer with a good hygienic toilet facility and 1 indicating a farmer with an unhygienic toilet facility. See appendix B for details on measurement.
63
www.udsspace.uds.edu.gh
g) Participation in community gatherings Participation in community gatherings looks at the extent to which a farmer can easily visit any social gathering. The scoring ranged from 1 to 2 with 2 indicating the freedom to participate in any gathering, 1 indicating limited freedom to participate. h) Health of the ecosystem services Ecosystems provide enormous services that have both direct and indirect connection with livelihoods of farmers. As a result, this indicator seeks to determine how farmers' livelihoods have been affected by the ecosystems services within the area. The highest score is 30 meaning the ecosystem services are sustained to contribute to farmers' livelihoods and the minimum score is 10 meaning the ecosystems services in the area are worsened hence can less contribute significantly on farmers' livelihoods. The parameters used to measure the ecosystem services are shown in appendix B. i) Income Another core indicator of livelihood measurement is total income. This includes the sum of monies received as remittances, off-farm income and farm income (both rain-fed and irrigation). These incomes have a significant effect on farmers’ livelihoods in the Ghanaian setting and hence cannot be excluded when computing livelihood scores of a person. The highest score for the income is 11 meaning a farmer has income above Gh₵10,000 and the minimum score is 1 if a farmer has income value less than Gh₵1,000. The distribution of the total income categories is presented in appendix B.
64
www.udsspace.uds.edu.gh
3.5.3.3 Development of farmers’ Average Livelihood Status Score (ALSS) The ALSS was calculated in two steps. First of all, individual farmer’s indicator percentage score (IFIPS) was determined for each of the livelihood indicators. Thereafter, the average livelihood status score (ALSS) was computed on the score of the identified livelihood indicators. a) Calculation of Individual Farmer’s Indicator Percentage Score (IFIPS)
Individual farmer’s indicator percentage score (IFIPS):
𝐼𝐹𝐼𝑃𝑆𝑖𝑘
𝐼𝐹𝐹𝑆𝑖𝑘 = × 100 𝐼𝐹𝑃𝑀𝑆𝑘
(21)
𝑤ℎ𝑒𝑟𝑒: 𝐼𝐹𝐼𝑃𝑆𝑖𝑘 = 𝑖𝑛𝑑𝑖𝑣𝑖𝑑𝑢𝑎𝑙 𝑓𝑎𝑟𝑚𝑒𝑟 ′ 𝑠 𝑖𝑛𝑑𝑖𝑐𝑎𝑡𝑜𝑟 𝑝𝑒𝑟𝑐𝑒𝑛𝑡𝑎𝑔𝑒 𝑠𝑐𝑜𝑟𝑒 𝑜𝑓 𝑘 𝑙𝑖𝑣𝑒𝑙𝑖ℎ𝑜𝑜𝑑 𝑖𝑛𝑑𝑖𝑐𝑎𝑡𝑜𝑟 𝑓𝑜𝑟 𝑖𝑡ℎ 𝑓𝑎𝑟𝑚𝑒𝑟 𝐼𝐹𝐹𝑆𝑖𝑘 = 𝐼𝑛𝑑𝑖𝑣𝑖𝑑𝑢𝑎𝑙 𝑓𝑎𝑟𝑚𝑒𝑟 ′ 𝑠 𝑓𝑖𝑒𝑙𝑑 𝑠𝑐𝑜𝑟𝑒 𝑜𝑓 𝑘 𝑙𝑖𝑣𝑒𝑙𝑖ℎ𝑜𝑜𝑑 𝑖𝑛𝑑𝑖𝑐𝑎𝑡𝑜𝑟 𝑓𝑜𝑟 𝑖𝑡ℎ 𝑓𝑎𝑟𝑚𝑒𝑟 𝐼𝐹𝑃𝑀𝑆 𝑘 = 𝐼𝑛𝑑𝑖𝑣𝑖𝑑𝑢𝑎𝑙 𝑓𝑎𝑟𝑚𝑒𝑟 ′ 𝑠 𝑝𝑜𝑠𝑠𝑖𝑏𝑙𝑒 𝑚𝑎𝑥𝑖𝑚𝑢𝑚 𝑠𝑐𝑜𝑟𝑒 𝑓𝑜𝑟 𝑘 𝑙𝑖𝑣𝑒𝑙𝑖ℎ𝑜𝑜𝑑 𝑖𝑛𝑑𝑖𝑐𝑎𝑡𝑜𝑟
b) Calculation of Average Livelihood Status Score (ALSS) The ALSS of each farmer is then computed by summing all the percentage scores for each livelihood indicator divided by the number of livelihood indicators represented mathematically as follows:
Average livelihood status score (ALSS):
𝑘 ∑𝑘=9 𝑘=𝑖 𝐼𝐹𝐼𝑃𝑆𝑖 𝐴𝐿𝑆𝑆𝑖 = 𝑛𝑘
(22)
65
www.udsspace.uds.edu.gh
𝑤ℎ𝑒𝑟𝑒: 𝑛𝑘 = 𝑛𝑢𝑚𝑏𝑒𝑟 𝑜𝑓 𝑙𝑖𝑣𝑒𝑙𝑖ℎ𝑜𝑜𝑑 𝑖𝑛𝑑𝑖𝑐𝑎𝑡𝑜𝑟𝑠 = 9 𝑘=9
∑ 𝐼𝐹𝐼𝑃𝑆𝑖𝑘 𝑘=𝑖
= 𝑠𝑢𝑚 𝑜𝑓 𝑖𝑛𝑑𝑖𝑣𝑖𝑑𝑢𝑎𝑙 𝑓𝑎𝑟𝑚𝑒𝑟 ′ 𝑠 𝑖𝑛𝑑𝑖𝑐𝑎𝑡𝑜𝑟 𝑝𝑒𝑟𝑐𝑒𝑛𝑡𝑎𝑔𝑒 𝑠𝑐𝑜𝑟𝑒 𝑓𝑜𝑟 𝑎𝑙𝑙 𝑡ℎ𝑒 9 𝑙𝑖𝑣𝑒𝑙𝑖ℎ𝑜𝑜𝑑 𝑖𝑛𝑑𝑖𝑐𝑎𝑡𝑜𝑟𝑠
66
www.udsspace.uds.edu.gh
CHAPTER FOUR RESULTS AND DISCUSSION 4.1 Socio-Demographic Characteristics of Farmers The study found that the distribution of farmers is skewed towards males forming 71% of the respondents interviewed while only 29% are females (Table 4.1). The segregated data also revealed that a greater proportion of females are within the community-managed irrigation schemes (42%) compared to the government-managed irrigation scheme (16%). This indicates that women find it more appealing to be engaged under community managed irrigation schemes than the government managed irrigation scheme. The skewedness of respondents towards males is consistent with the findings of Seidu (2011), who reported that irrigation farming in the Kassena-Nankana area is predominantly done by males. Until recently, farming in the area was culturally seen as a male dominated economic activity while women were basically in-charge of sales of farm produce and other petty trading. From Table 4.2, the average age of farmers in irrigation farming is about 42 years with a standard deviation of 11 years. This suggests that averagely the farmers in irrigation farming falls within the productive age cohort. The mean age in the community-managed irrigation schemes (about 45years) is however higher than the mean age in the government-managed irrigation scheme (about 38years) with the associated standard deviations of 11 years and 10 years respectively. This also suggests that, younger people engage more in the government-managed irrigation scheme (GIS) than in the community-managed irrigation schemes (CIS). Again, it shows that the government managed irrigation scheme is more appealing to the youth than the community managed irrigation schemes. Moreover, a major land area of the GIS is owned by
67
www.udsspace.uds.edu.gh
ICOUR hence operates as an open access system where the youth have an equal chance of securing lands for farming. Majority of the farmers had no formal education or had only basic education (Table 4.1). The level of education of the respondents shows that approximately 45% had no formal education, 21% with primary education, 21% with JHS education, 11% with SHS/Voc. /Tech. education, and 2% with tertiary and/or university education level. Narrowing it to CIS and GIS, the study realised that over 52% of the respondents under CIS had no formal education compared to GIS with 36%. This implies that most of the farmers under the CIS will have greater weakness in reading and understanding new agricultural interventions or programmes. This finding is similar to the finding of Seidu (2011), who reported that 42% of the farmers in Tono irrigation had primary or no formal education and only 2% can be found in the tertiary education. Furthermore, the study revealed that the mean household size of the respondents is about 6 with a standard deviation of 2 (Table 4.2). The mean household size for the CIS is however larger than the mean household size of the GIS. From the table, the average household size of the CIS is about 6 while that of GIS is about 5 with standard deviations of 3 and 2 respectively. This means that farmers under the CIS relatively have larger potential household labour force to help in farming than the farmers in GIS. Again, it can be observed in Table 4.1 that about 65% of the respondents are married while 35% otherwise (single, separated and widowed). It also shows that 71% of the respondents are household heads while 29% are not. From the survey, some household heads lost their spouses and some are staying with their children alone because of broken homes. Comparatively, it can be observed in Table 4.1 that a greater percentage of the respondents in GIS (73%) are household heads than the respondents in CIS (69%). This further explains why most of the respondents
68
www.udsspace.uds.edu.gh
under the CIS are females relative to the GIS. Details of the statistics for the socio-demographic characteristics of farmers are shown in Table 4.1 and Table 4.2.
69
www.udsspace.uds.edu.gh
Table 4.1: Summary statistics of categorical variables Variables
Sex Females Males Marital status Married Otherwise (single, separated and widowed) Household head Yes No Initial Soil perception Fertile Not fertile Adoption High adopters of EBFMPs(>mean) Low adopters of EBFMPs(=chibar2 =1.000 =1.000 =1.000 Dispersion=Mean Log likelihood =-255.107 =-242.655 =-501.122 *, **, ***, stands for values statistically significant at 1%, 5% and 10% respectively. Figures in parenthesis stands for standard errors. Source: Field survey, 2016.
91
www.udsspace.uds.edu.gh
4.4 Valuation of Ecosystem-Based Farm Management Practices The third objective of the study was to assess the proportion of farmers willing to pay for the sustainability of the EBFMPs and to estimate the willingness to pay (WTP) value. In pursuance of this objective, the contingent valuation method (CVM) was used to elicit farmers’ WTP values through the iterative bidding technique. The values obtained directly shows the extent farmers worth the services provided by the EBFMPs in maintaining the health of the agroecosystems. Figure 4.6 shows that a greater proportion of the farmers (nine in ten farmers) are willing to pay to sustain the services provided by the EBFMPs (as shown by the pooled outcome). Figure 4.6 also suggests that almost the same percentage of the farmers from the community and government managed irrigation schemes are willing to pay to sustain the EBMFPs. In addition, Table 4.7 shows that farmers under CIS are willing to pay approximately a mean amount of GH₵520.00 to sustain the services provided by the agro-ecosystems. However, those under the GIS are willing to offer approximately GH₵336.00 to sustain the services provided by the agro-ecosystems. These outcomes imply that farmers under CIS appreciate more the services provided by the EBFMPs than those under the GIS. Farmers under CIS are more willing to pay for the services of the EBFMPs because of the direct effect on their livelihoods. For exampe, beyond the fruits from the mango plantations serving as food to households, income is equally generated from the sales of these fruits to support households’ livelihoods.
92
www.udsspace.uds.edu.gh
Not willing to pay 7%
CIS
Not willing to pay 11%
Willing to pay 93%
Willing to pay
GIS
Willing to pay
Willing to pay 89%
Pooled 91%
9%
9%
Willing to pay Not willing to pay Figure 4.6: Proportion of farmers willing to pay for EBFMPs sustainability Source: Field survey, 2016. Table 4.7: T-test (mean-comparison) of farmers’ WTP value for EBMFP sustainability Irrigation type
Observation
Mean
Standard deviation
CIS
150
520.0133
340.4149
GIS
150
335.8033
209.5558
Combined
300
427.9083
296.888
Difference
184.21
𝐻0 : 𝑊𝑇𝑃𝐶𝐼𝑆 = 𝑊𝑇𝑃𝐺𝐼𝑆 𝐻𝐴 : 𝑊𝑇𝑃𝐶𝐼𝑆 ≠ 𝑊𝑇𝑃𝐺𝐼𝑆 Pr(|T| > |t|) = 0.0000 𝐻𝐴 : 𝑊𝑇𝑃𝐶𝐼𝑆 > 𝑊𝑇𝑃𝐺𝐼𝑆 Pr(T > t) = 0.0000 Source: Field survey, 2016. 93
www.udsspace.uds.edu.gh
The t-test (mean-comparison) of farmers’ WTP value for EBFMP sustainability indicates that there is significant difference in the mean values of farmers under CIS and GIS. The first alternative hypothesis (HA: mean (diff) ≠ 0) is significant at 1% suggesting that there is statistical difference in the means of CIS and GIS hence rejecting the null hypothesis of no significant difference (Table 4.7). The second alternative hypothesis (HA: mean (diff) > 0) also conclude at 1% significance that farmers under CIS are more willing to pay for the sustainability of the EBMFPs than those under GIS. This re-emphasizes that farmers in community managed irrigation schemes value more the services provided by the various EBMFPs than their counterparts in the government managed irrigation scheme.
4.5 Effects of EBFMPs Adoption on the Livelihoods of Farmers The objective four was to analyse the effects of using EBFMPs on the livelihoods of farmers. In achieving this objective, the study examined the livelihood indicators of farmers and how generally livelihoods of farmers have been affected with the adoption of EBFMPs in irrigation. The livelihoods of farmers were measured by indexing nine (9) indicators. However, the effects of EBFMPs on the livelihoods of farmers was analysed with a treatment effect model (regression adjustment). This was to ensure that farmers are placed at the same pedestal to obtain a true effect of using EBFMPs on their livelihoods. The analysis considered under the treatment effect model are the average treatment effect on farmers (ATE), the average treatment effect on the treated (ATET) and the potential outcome means (POMs) of farmers’ livelihood scores. Figure 4.7 shows the mean percentages of farmers’ livelihood indicators and standard deviations in parenthesis. The indicators show that irrigation farmers’ livelihoods (both in CIS and GIS) are appreciably high (above a score of 6 in 10 marks) except their sanitation and incomes’ of farmers under community managed irrigation schemes. The difference in incomes 94
www.udsspace.uds.edu.gh
stems from the relative sizes of farmlands of CIS and GIS. It is also attributed to the types of crops predominantly cultivated in the two types of schemes. Even though, farmers under the GIS obtain higher incomes than their counterparts in the CIS, there is no much difference in their livelihoods’ indicators as shown in Figure 4.7. The graph indicates that farmers under CIS are relatively better than those in the GIS in terms of their health situation, freedom in cash expenditure, sanitation and health of ecosystem services. Key among the differences is on the health of the ecosystems which implies that farmers under CIS are more conscious about sustaining the health of their agro-ecosystem than those under the GIS.
75.87% (29.86) 53.64% (31.47)
Income
68.29% (7.73) 69.91% (6.61)
Health of ecosystem services
99.33% (5.75) 99.33% (5.75)
Livelihood indicators
Participation in social gatherings 38.44% (14.70) 41.22% (18.59)
Sanitaion
89.9 (12.79) 91.43% (12.55)
Freedom in cash expenditure Water facilities
95.63% (8.46) 89.98% (11.27)
Health situation
89.15% (8.79) 91.09% (8.12) 66.88% (12.19) 66.85% (10.92)
Housing condition
84.02% (12.19) 79.13% (11.60)
Food availability 0
20
40
60
80
Percentage of indicators
Figure 4.7: Percentages of livelihood indicators Source: Field survey, 2016.
95
100
GIS
120
CIS
www.udsspace.uds.edu.gh
The outcome regression of the average treatment effect (ATE) suggests that being a high adopter of EBFPs have a positive effect on the livelihoods of farmers. This finding is statistically significant at 1% and in terms of magnitude, the result shows that if farmers decide to adopt high number of EBMFPs in irrigation schemes, they will experience about 3% improvement in their livelihood scores (ALSS) from an average livelihood status score (ALSS) of 75.76% for low adopters. This means that adoption of EBFMPs on irrigation schemes is not only a sustainability measure but also helps to improve the livelihoods of farmers. This finding is consistent with IUCN (2004) which suggested that ecosystem restoration practices are uniquely valuable because of their inherent capacity to provide people with the opportunity not only to improve their livelihood conditions but also to repair ecological damage. Most of the irrigation schemes that use more EBFMPs usually have fruits that serve as food for farmer’s households. There are also fresh grasses that serve as feed for their livestock. Table 4.8: Average treatment effect (ATE) on farmers’ livelihoods Variables
Average treatment effect Category (High adoption vs. low adoption ) Potential outcome mean Category (Low adoption)
Coefficients
Robust Standard error
2.977***
.569
75.757***
.440
Number of observations=300 Iteration 0: EE criterion = 8.657e-28 Iteration 1: EE criterion = 7.733e-30 Outcome model : linear Treatment model: none ***, **, *, stands for values statistically significant at 1%, 5% and 10% respectively. Source: Field survey, 2016.
96
www.udsspace.uds.edu.gh
The average treatment effect (ATE) discussed above does not give the true effect of using EBFMPs on livelihoods’ of true high adopters since the results only showed the average amount by which livelihood scores (ALSS) in general was affected by farmers’ decision to use high number of EBFMPs. As such, the study revealed further the average amount by which livelihoods' scores (ALSS) of actual high adopters have been improved as a result of using high number of EBFMPs. The coefficient of the ATET in Table 4.9 suggests that the decision to use high number of EBFMPs causes an additional increase of 3.29% in livelihood scores of farmers who are high adopters and this is statistically significant at 1%. This is considered as the true effect of EBFMPs adoption because the effect is analysed on only farmers who are indeed high adopters. The outcome re-emphasizes the importance of EBFMPs adoption on farmers’ livelihoods and how it sustains their economic activities. Table 4.9: Average treatment effect on the treated (ATET) Variables
ATE on the treated Category (High adoption vs. low adoption ) Potential outcome mean Category (Low adoption)
Coefficients
Robust standard error
3.297***
.698
75.344***
.622
Number of observations=300 Iteration 0: EE criterion = 8.509e-28 Iteration 1: EE criterion = 1.870e-29 Outcome model : linear Treatment model: none ***, **, *, stands for values statistically significant at 1%, 5% and 10% respectively Source: Field survey, 2016.
97
www.udsspace.uds.edu.gh
In addition, the study further revealed the likely livelihoods scores farmers would obtain if they all decide to either use high or low number of EBFMPs and this is reflected in the potential outcome means (POMs) of farmers (Table 4.10). Potential outcome means are the averages of the predicted livelihoods of farmers based on their category of adoption (see appendix C for the actual regression equations used to estimate the POMs). The coefficient of POM for low adoption implies that, if all the irrigated farmers decide to use low number of EBFMPs on their farms, then their expected mean livelihoods score would be 75.75% at 1% significant level. On the other hand, the coefficient of POM for high adoption indicates that, if all irrigated farmers decide to use high number of EBMFPs on their farms, then their expected mean livelihoods score would be 78.73% at 1% significant level. These outcomes suggest that a current tradeoff of more sustainable farm practices for lesser number of ecosystem friendly practices by farmers who are originally more sustainable in their farming activities will lead to a fall in their mean livelihoods score (ALSS) in the near future.
The reverse also suggests that a current tradeoff of
unsustainable farm practices (which gives immediate gains) for more conservative practices by farmers who are actually ecosystem unfriendly in irrigation will lead to an increase in their mean livelihoods score (ALSS) in the near future.
98
www.udsspace.uds.edu.gh
Table 4.10: Potential outcome means of farmers Variables
Coefficients
Robust standard error
Potential outcome means Low adoption High adoption
75.757*** 78.734***
.440 .456
Number of observations = 300 Iteration 0: EE criterion = 8.657e-28 Iteration 1: EE criterion = 4.547e-29 Outcome model : linear Treatment model: none ***, **, *, stands for values statistically significant at 1%, 5% and 10% respectively. Source: Field survey, 2016.
99
www.udsspace.uds.edu.gh
CHAPTER FIVE SUMMARY, CONCLUSIONS AND RECOMMENDATIONS 5.1 Summary The adoption of Ecosystem-based farm management practices (EBFMPs) have a direct effect on the sustainability of soil fertility and the livelihoods of farmers. The study analysed the use of EBFMPs among government managed irrigation scheme (Tono) and community managed irrigation schemes. The EBFMPs identified were manure/compost application, conservative tilling, intercropping with legumes, mulching, vegetation conservation, efficient drainage systems, crop rotation and soil bunding. The study revealed that there is low adoption of EBFMPs in both irrigation and rain-fed farming in the study area. However, it was realized that farmers under community managed irrigation schemes (CIS) are using more EBFMPs than those under the government managed irrigation scheme (GIS). The exception was on soil bunding where a lot of farmers under the GIS practiced soil bunding than those under the CIS. This is because rice farmers were predominantly found in GIS than in CIS and majority of the farmers who practiced soil bunding were rice farmers. In addition, the factors influencing the adoption of EBFMPs by farmers were identified using the Poisson and negative binomial models. The over-dispersion parameter (alpha) test was not significant and thus the negative binomial model reduced back to the Poisson regression indicating that there was no over-dispersion in the data. The factors influencing the intensity of EBFMPs adoption were identified to be age of farmers, distance of irrigated farm from home,
100
www.udsspace.uds.edu.gh
farmer’s perception of soil fertility, farmers’ knowledge of EBMFPs, number of extension visits and the type of irrigation scheme the farmers cultivated. The study went further to determine farmers’ willingness to pay (WTP) for the sustainability of the EBFMPs. It was revealed that farmers under CIS were willing to pay more for the sustainability of the EBFMPs than those under the GIS. The results revealed that farmers under CIS and GIS are willing to pay mean amounts of GH₵520.00 and GH₵336.00 respectively to sustain the services provided by the EBFMPs. Further analysis using the t-test (mean comparison) revealed that the amount farmers in CIS are willing to pay is significantly higher than that of the GIS. The study also looked at the effects of using EBFMPs in irrigation on the livelihoods of farmers. The treatment effect model (adjustment regression) was used to determine the effects of using the EBFMPs on livelihood. Farmers who used 3 or less EBFMPs were classified as low adopters while those who used four or more were classified as high adopters. The outcome of the treatment effect model showed that a decision to use high number of EBFMPs significantly increases the livelihood status scores of farmers. The findings from the study therefore show that the adoption of EBFMPs is not only a sustainable activity but also helps to improve the livelihoods of farmers.
5.2 Conclusions It was evident from the study that farmers’ adoption of ecosystem-based farm management practices is low. Most of the irrigation schemes are characterized with leaking canals and poor drainage systems, leaking water pumping machines, silted dams, burning of vegetation and unstructured dugouts. The study showed that farmers under CIS use more EBFMPs than those under the GIS. 101
www.udsspace.uds.edu.gh
Again, the intensity of EBFMPs adoption is significantly determined by the age of farmers, distance of irrigated farms from home, farmer’s perception of soil fertility, farmers’ knowledge of EBFMPs, number of extension visits and the type of irrigation scheme the farmers cultivated. Furthermore, a greater proportion of the farmers are willing to pay for the sustainability of the EBFMPs but farmers under CIS are willing to pay more than those under GIS. Lastly, it is evident from the study that the use of more EBFMPs have a positive effect on the livelihoods of farmers in the study area.
5.3 Policy Recommendations The study recommends that MoFA directorates in the Kassena-Nankana East District and Kassena-Nankana West District should educate farmers more about the importance of using traditional indigenous practices, which are currently discarded for higher yields. It is also recommended that they should intensify their extension activities to farmers (especially farmers under the CIS) since it increases their level of EBFMPs adoption. Farmers under the government managed irrigation scheme, especially the youth should also be trained more on how to expand production without compromising the biological functioning of the agro-ecosystems. Farmers should be trained on how to prepare compost on farm sites to offset the challenge of transporting compost to far distanced farms from home. Again, it is recommended that non-governmental organisations, GIDA and other key partners in irrigation should train farmers (especially those under GIS) on the linkages between ecosystem services and sustainability of irrigation farming. This will help create awareness among farmers on the true value of ecosystem friendly practices. Lastly, the study recommends that GIDA and other development partners should tailor more programs and projects on sustainable farming since it improves more of farmers’ livelihoods. This is based on the finding 102
www.udsspace.uds.edu.gh
that using high number of EBFMPs improves farmers’ livelihood status scores than using low number of EBFMPs.
5.4 Limitations of the Study One of the major limitation of the study was time and resources constraint. As such, the sample size may be small in relation to the entire population of the study area. This might have an influence on the inferences made about the population. The selection of the communities might not also be a fair representation of the entire study area since only one community (PagaNania) is from the Kassena-Nankana West District.
5.5 Suggestions for Future Research The study suggests that future researchers should look at crop yield differentials between farmers under the government management irrigation scheme and the community managed irrigation schemes. Future researchers should also look at the area percentage of farmlands which farmers employed EBFMPs on and the number of years farmers have practiced the EBFMPs. Future studies should also consider increasing the sample size and include more communities from the Kassena-Nankana West District for fair representation of the entire study area.
103
www.udsspace.uds.edu.gh
REFERENCES Abdul-Hanan, A., Ayamga, M., & Donkoh, S. A. (2014). Smallholder adoption of soil and water conservation techniques in Ghana. African Journal of Agricultural Research, 9(5), 539546. Agyedu, G. O., Donkoh, F., & Obeng, S. (2013). Teach yourself research methods. Kumasi, Ghana. p 94-95. Alemayehu, T. (2014). Smallholder Farmer’s Willingness to Pay for Improved Irrigation Water: A Contingent Valuation Study in Koga Irrigation Project, Ethiopia. Journal of Economics and Sustainable Development, 5(19), 5-15. Allen, T. F., & Hoekstra, T. W. (1992). Toward a unified ecology. Columbia University Press, New York, USA. Ansong, M., & Røskaft, E. (2014). Local communities’ willingness to pay for sustainable forest management in Ghana. JENRM, Vol. I, No. 2, 80-87. Armah, R. N., Al-Hassan, R. M., Kuwornu, J. K., & Osei-Owusu, Y. (2013). What influences farmers’ choice of indigenous adaptation strategies for agrobiodiversity loss in Northern Ghana? British Journal of Applied Science & Technology, 3(4), 1162. Assan, J. K., & Beyene, F. R. (2013). Livelihood Impacts of Environmental Conservation Programmes in the Amhara Region of Ethiopia. Journal of Sustainable Development, 6(10), p87. Bagson, E., & Kuuder, C.-J. W. (2013). Assessment of a Smallscale Irrigation Scheme on Household Food Security and Leisure in Kokoligu; Ghana.Research on Humanities and Social Sciences, Volume 3;1 Barbier, E. B., Baumgärtner, S., Chopra, K., Costello, C., Duraiappah, A., Hassan, R., . . . Polasky, S. (2009). The valuation of ecosystem services. Biodiversity, ecosystem functioning, and human wellbeing. An ecological and economic perspective. Oxford University Press, New York, USA, 248-262. Bashiru, M., Dumayiri, M., & Sabutey, G. T. (2014). Drivers for the Adoption of Risk Management Practices by Farmers in Ghana: Critical Inquiry from the Wa East District. Paper presented at the Information and Knowledge Management.
Boafo, Y. A., Saito, O., Takeuchi, K., & Gyasi, E. (2014). Provisioning ecosystem services in rural savanna landscapes of Northern Ghana: an assessment of supply, utilization, and drivers of change. Journal of Disaster Research, 9(4), 501-515.
104
www.udsspace.uds.edu.gh
Boelee, E., Atapattu, S., & Amede, T. (2011). Ecosystems for water and food security: UNEP, 18-21. Boyd, J., & Banzhaf, S. (2007). What are ecosystem services? The need for standardized environmental accounting units. Ecological Economics, 63(2), 616-626. Boyd, J., & Wainger, L. (2003). Measuring ecosystem service benefits: the use of landscape analysis to evaluate environmental trades and compensation. Resources for the future discussion paper, 2, 63. Christian, R. (2003). Concepts of ecosystem, level, and scale. Encyclopedia of Life Support Systems (EOLSS). EOLSS Publishers, Oxford. Costanza, R., de Groot, R., Sutton, P., van der Ploeg, S., Anderson, S. J., Kubiszewski, I., . . . Turner, R. K. (2014). Changes in the global value of ecosystem services. Global Environmental Change, 26, 152-158. Dale, V. H., & Polasky, S. (2007). Measures of the effects of agricultural practices on ecosystem services. Ecological Economics, 64(2), 286-296. Danso, G., Drechsel, P., Fialor, S., & Giordano, M. (2006). Estimating the demand for municipal waste compost via farmers’ willingness-to-pay in Ghana. Waste management, 26(12), 1400-1409. Davari, M., Ram, M., Tewari, J., & Kaushish, S. (2010). Impact of agricultural practice on ecosystem services. International Journal of Agronomy and Plant Production, 1(1), 1123. De Groot, R., Brander, L., Van Der Ploeg, S., Costanza, R., Bernard, F., Braat, L., . . . Hein, L. (2012). Global estimates of the value of ecosystems and their services in monetary units. Ecosystem services, 1(1), 50-61. Dinye, R. (2013). Irrigated agriculture and poverty reduction in Kassena Nankana district in the upper-east region, Ghana. Journal of Science and Technology (Ghana), 33(2), 59-72. Dittoh, S., Bhattarai, M., & Akuriba, M. A. (2013). Micro Irrigatino-Based Vegetable Farming for Income, Employment and Food Security in West Africa. Nova Science Publishers, Inc.,177-200. Egoh, B. N., O'Farrell, P. J., Charef, A., Gurney, L. J., Koellner, T., Abi, H. N., . . . Willemen, L. (2012). An African account of ecosystem service provision: use, threats and policy options for sustainable livelihoods. Ecosystem services, 2, 71-81. Ehiakpor, S. D., Mabe, N. F. and Tendeku, D. (2015). Improved electricity supply: what factors determine how much domestic customer are willing to pay in tamale urban and periurban area? . British Journal of Economics, Management & Trade, Vol.: 6. 105
www.udsspace.uds.edu.gh
FAO. (2010). Conservation Agriculture-Food and Agriculture Organisation. July, 2015, from http://www.fao.org/ag/ca/index.html.
Retrieved 10th
Fisher, B., Bateman, I., & Turner, R. K. (2011). Valuing ecosystem services: benefits, values, space and time. Garming, H., & Waibel, H. (2007). Do farmers adopt IPM for health reasons? The case of Nicaraguan vegetable growers. Paper presented at the Proceedings of the Tropentag Conference Utilisation of Diversity in Land Use Systems: Sustainable and Organic Approaches to Meet Human Needs. GIDA. (2011). National Irrigation Policy, Strategies and Regulatory Measures. Retrieved 20th September, 2015, from http://mofa.gov.gh/site/wp-content/uploads/2011/07/GHANAIRRIGATION-DEVELOPMENT-POLICY1.pdf Gómez-Baggethun, E., & Ruiz-Pérez, M. (2011). Economic valuation and the commodification of ecosystem services. Progress in Physical Geography, 35(5), 613-628. Gordon, L. J., Finlayson, C. M., & Falkenmark, M. (2010). Managing water in agriculture for food production and other ecosystem services. Agricultural Water Management, 97(4), 512-519. Greene, W. (2008). Functional forms for the negative binomial model for count data. Economics Letters, 99(3), 585-590. Greene, W. H. (2003). Econometric analysis: Pearson Education Inc., India. Gross, L. H., Erickson, J. D., & Méndez, V. E. (2014). Supporting Rural Livelihoods and Ecosystem Services Conservation in the Pico Duarte Coffee Region of the Dominican Republic. Agroecology and Sustainable Food Systems, 38(9), 1078-1107. GSS. (2012). 2010 Population and Housing Census. Summary Report of Final Results. Accra. GSS. (2014). Poverty Profile in Ghana 2005-2013. Living Standard Survey IV. Accra. Hancock, J. (2010). The case for an ecosystem service approach to decision-making: an overview. Bioscience Horizons, 3(2), 188-196. Hapsari, A. (2010). Assessing and Mapping Ecosystem Services in Offinso District, Ghana. University of Twente Faculty of Geo-Information and Earth Observation ITC, Enschede. IUCN. (2004). Ecological Restoration, a means of conserving biodiversity and sustaining livelihoods. International Union for conservation of Nature. Retrieved 1st September, 2015, from http://www.ser.org/docs/default-document-library/ser-iucn-globalrationale.pdf?sfvrsn=2
106
www.udsspace.uds.edu.gh
IUCN. (2010). Agricultural ecosystems-Facts and Trends. International Union for conservation of Nature. Retrieved 5th August, 2015, from http://cmsdata.iucn.org/downloads/agriculturalecosystems_2.pdf Kim, S.-A., Gillespie, J. M., & Paudel, K. P. (2005). Count data analysis of the adoption of best management practices in beef cattle production. Paper presented at the Southern Agricultural Economics Association Annual Meetings, Little Rock, Arkansas. King, D. M., & Mazzotta, M. J. (2000). Contingent Valuation Method. Retrieved 20th January 2016, from http://www.ecosystemvaluation.org/contingent_valuation.htm Kpieta, B. A., Owusu-Sekyere, E., & Bonye, S. Z. (2013). Reaping the benefits of small-scale irrigation dams in North-Western Ghana: Experiences from three districts in the Upper West Region.Research Journal of Agriculture and Environmental Management, Vol. 2; Issue 7. Kyei-Baffour, N., & Ofori, E. (2007). Irrigation development and management in Ghana: Prospects and challenges. Journal of science and technology (Ghana), 26(2), 148-159. Leeuwis, C., & Ban, A. (2004). Communication for rural innovation: Rethinking agricultural extension. Oxford: Blackwell Science. Magdoff, F. (2007). Ecological agriculture: Principles, practices, and constraints. Renewable Agriculture and Food Systems, 22(02), 109-117. Meikle, S. (2002). The urban context and poor people. Urban Livelihoods: A people-centred approach to reducing poverty, 37-51. Meikle, S., Ramasut, T., & Walker, J. (2001). Sustainable urban livelihoods: Concepts and implications for policy.Development Planning Unit, UCL: London, UK. Working Papers 112. Mendelsohn, R., & Olmstead, S. (2009). The economic valuation of environmental amenities and disamenities: methods and applications. Annual Review of Environment and Resources, 34, 325-347. Millennium Ecosystem Assessment (2007). A Toolkit for Understanding and Action. Protecting Nature’s Services. Protecting Ourselves. Retrieved 30th January, 2016, from http://www.unpei.org/sites/default/files/PDF/ecosystems-economicanalysis/MEA-AToolkit.pdf. Millennium Ecosystem Assessment (2005). Ecosystems and human well-being (Vol. 5): Island Press Washington, DC. Mohammadi, G. (2012). Living mulch as a tool to control weeds in agroecosystems: A Review: INTECH Open Access Publisher. 107
www.udsspace.uds.edu.gh
Mooleki, P., & Recksiedler, B. (2009). Benefits of including legumes in your crop rotation. Retrieved 12th August, 2015, from http://www.agriculture.gov.sk.ca/AGV_0907_4
Munang, R., Liu, J., Chuku, C. A., Codjoe, S., Dovie, D., Mkwambisi, D. D., & Rivington, M. (2011). UNEP-Environment for Development : Putting Ecosystem Management in the Vision of Africa’s Development : Towards a sustainable Green Economy. Mwingyine, D. T. (2008). Towards Sustainable Rural Land Use Practices in the Northern Savannah Zone of Ghana: Case Study of the Sissala West District. Department of Land Economy, Kwame Nkrumah University of Science and Technology. Namara, R. E., Horowitz, L., Kolavalli, S., Kranjac-Berisavljevic, G., Dawuni, B. N., Barry, B., & Giordano, M. (2011). Typology of irrigation systems in Ghana (Vol. 142): IWMI. Nata, J. T., Mjelde, J. W., & Boadu, F. O. (2014). Household adoption of soil-improving practices and food insecurity in Ghana. Agriculture & Food Security, 3(1), 17. Navrongo Health Research Centre (unpublished). The Navrongo Health and Demorgraphic Surveillance System(NHDSS). (Accessed on: 10/02/2016). Ngwira, A., Johnsen, F. H., Aune, J. B., Mekuria, M., & Thierfelder, C. (2014). Adoption and extent of conservation agriculture practices among smallholder farmers in Malawi. Journal of Soil and Water Conservation, 69(2), 107-119. Nkegbe, P. K., & Shankar, B. (2014). Adoption intensity of soil and water conservation practices by smallholders: evidence from Northern Ghana. Bio-based and Applied Economics, 3(2), 159-174. Nkegbe, P. K., Shankar, B., & Ceddia, G. M. (2012). Smallholder Adoption of Soil and Water Conservation Practices in Northern Ghana. Journal of Agricultural Science and Technology(2), 595-605. Norris, K. (2012). Biodiversity in the context of ecosystem services: the applied need for systems approaches. Philosophical transactions of the royal society B: biological sciences, 367(1586), 191-199. Nzama, A. (2009). The nexus between sustainable livelihoods and ecological management of the World Heritage Sites: lessons from iSimangaliso World Heritage Park, South Africa. Inkanyiso: Journal of Humanities and Social Sciences, 1(1), 34-42. Odum, E. P. (1971). Fundamentals of ecology 1971. Philadelphia: WB Saunders Company. Oxfam. (2012). Qualitative Monitory of Maputo Declaration on Agriculture and Food SecurityThe case study of Ghana-Final Report. Retrieved 30th January, 2016, from 108
www.udsspace.uds.edu.gh
http://maputo10.ipar.sn/index.php?option=com_phocadownload&view=category&downl oad=3:qualitative-monitoring-of-maputo-declaration-on-agriculture-and-food-securitythe-case-of-ghana&id=5:ghana Pascual, U., Muradian, R., Brander, L., Gómez-Baggethun, E., Martín-López, B., Verma, M., . . . Eppink, F. (2010). The economics of valuing ecosystem services and biodiversity. Pathak, K. (2002). Insect pestss of agri-horticultural crops and their management in NEH region. Integrated Watershed Management for Sustainable Development. Pickett, S. T., & Cadenasso, M. L. (2002). The ecosystem as a multidimensional concept: meaning, model, and metaphor. Ecosystems, 5(1), 1-10. Power, A. G. (2010). Ecosystem services and agriculture: tradeoffs and synergies. Philosophical transactions of the royal society B: biological sciences, 365(1554), 2959-2971. Raghu, P. T., & Manaloor, V. (2014). Factors influencing adoption of farm management practices in agro-biodiversity hotspots of India: An analysis using Negative Binomial Count Data model. Journal of Natural Resources and Development, 04, 46-53. doi: 10.5027/jnrd.v4i0.07 Ramirez, O. A., & Shultz, S. D. (2000). Poisson count models to explain the adoption of agricultural and natural resource management technologies by small farmers in Central American countries. Journal of Agricultural and Applied Economics, 32(01), 21-33. Rasul, G. (2009). Ecosystem services and agricultural land-use practices: a case study of the Chittagong Hill Tracts of Bangladesh. Sustainability: Science, Practice & Policy, 5(2), 15-27 Rasul, G., Chettri, N., & Sharma, E. (2011). Framework for valuing ecosystem services in the Himalayas: International Centre for Integrated Mountain Development (ICIMOD). Rezvanfar, A., Samiee, A., & Faham, E. (2009). Analysis of factors affecting adoption of sustainable soil conservation practices among wheat growers. World Applied Sciences Journal, 6(5), 644-651. Rezvanfar, A., Eraktan, G., & Olhan, E. (2011). Determine of factors associated with the adoption of organic agriculture among small farmers in Iran. African Journal of Agricultural Research, 6(13), 2950-2956. Rodale. (2011). Crop Rotation-Build the perfect rotation schedule to nourish the soil and improve your crops. Retrieved 12th August, 2015, from http://www.rodalesorganiclife.com/garden/crop-rotation. Rogers, E. M. (2003). Elements of diffusion. Diffusion of innovations, 5, 1-38.
109
www.udsspace.uds.edu.gh
Sahin, I. (2006). Detailed Review of Rogers' Diffusion of Innovations Theory and Educational Technology-Related Studies Based on Rogers' Theory. Online Submission, 5(2). Sandhu, H. S., Wratten, S. D., & Cullen, R. (2010). Organic agriculture and ecosystem services. Environmental science & policy, 13(1), 1-7. Seidu, I. (2011). The Effects of Agricultural Modernisation on Poverty Reduction: A Case Study of Tono Irrigation Scheme in the Kassena-Nankana District of the Upper East Region of Ghana. Department of African and General Studies, University for Devevelopment Studies. Sharma, Y., Prasad, M., & Prasad, A. (2002). Disease problems of important crops of NEH region and their management. Integrated Watershed Management for Sustainable Development. Sheheli, S. (2012). Improving livelihood of rural women through income generating activities in Bangladesh. Berlin, Humboldt Universität zu Berlin, Diss., 2012. Simpson, D. R. (2011). The “ecosystem service framework”: a critical assessment: Ecosystem Services Economics Unit.UNEP Publications, Nairobi, Kenya. Singh, A. K., Singh, R. K., Singh, A., Singh, V., Rawat, S., Mehta, K., . . . Thakur, S. (2014). Bio-mulching for ginger crop management: Traditional ecological knowledge led adaptation under rainfed agroecosystems. Indian Journal of Traditional Knowledge, 13(1), 111-122. Stata,
A. (2013). STATA Treatment-Effects Outcomes/Counterfactual Outcomes Release 13.
Reference
Manual:
Potential
Sterve, H. (2011). Factors restricting adoption of sustainable agricultural practices in a smallholder agro-ecosystem: a case study of Potshini community, upper Thukela region, South Africa. Sudmeier-Rieux, K., Masundire, H. M., & Rizvi, A. H. (2006). Ecosystems, Livelihoods and Disasters: An integrated approach to disaster risk management: IUCN. Swinton, S. M., Lupi, F., Robertson, G. P., & Hamilton, S. K. (2007). Ecosystem services and agriculture: cultivating agricultural ecosystems for diverse benefits. Ecological Economics, 64(2), 245-252. Thiaw, I., Kumar, P., Yashiro, M., & Molinero, C. (2011). UNEP-Food and Ecological Security : Identifying synergy and trade-offs. UNEP, 1-12. UNDP. (2013). Livelihoods & Economic Recovery in Crisis Situations. Retrieved 31st August, 2015, from http://www.undp.org/content/dam/undp/library/crisis%20prevention/20130215_UNDP% 20LER_guide.pdf 110
www.udsspace.uds.edu.gh
Williams, R. (2015). Models for Count Outcomes. Retrieved 6th September, 2015, from https://www3.nd.edu/~rwilliam/stats3/CountModels.pdf. Verbeek, M. (2008). A guide to modern econometrics: John Wiley & Sons Winkelmann, R. (2015). Counting on count data models. IZA World of Labor. Young, H., Jaspers, S., Brown, R., Frize, J., & Khogali, H. (2001). Food-security assessments in emergencies: a livelihoods approach: Overseas development institute (ODI). Humanitarian practice network (HPN). Zhang, W., Ricketts, T. H., Kremen, C., Carney, K., & Swinton, S. M. (2007). Ecosystem services and dis-services to agriculture. Ecological Economics, 64(2), 253-260. Zimmermann, R., Bruntrüp, M., & Kolavalli, S. (2009). Agricultural Policies in Sub-Saharan Africa. Understanding CAADP and APRMPolicy Processes. The German Development Institute. Electronic references https://en.wikipedia.org/wiki/Overdispersion (Accessed on: 19/ 01/2016) https://en.wikipedia.org/wiki/Poisson_distribution (Accessed on: 07/09/2015) https://en.wikipedia.org/wiki/Rhizobium (Accessed on: 12/09/2015) https://en.wikipedia.org/wiki/Mulch
(Accessed on: 12/09/2015)
http://kassenanankana.ghanadistricts.gov.gh/?arrow=atd&_=105&sa=1271 4/07/2015)
(Accessed
https://www.researchgate.net/figure/281340874_fig2 (Accessed on: 13/07/2016) http://mofa.gov.gh/site/?page_id=3032 (Accessed on: 16/07/2015) https://www.surveymonkey.com/mp/sample-size-calculator/ (Accessed on: 05/07/ 2015).
111
on
www.udsspace.uds.edu.gh
Appendix A Survey Guide Disclaimer and Consent: Dear Research Participant(s), The aim of this survey is to assess the ecosystem-based management farm practices used by farmers in government and community managed irrigation schemes in the Kassena-Nankana Area. It is a study in partial fulfillment for the award of Master of Philosophy (M.Phil.) degree in Agricultural Economics at the University for Development Studies (UDS), Tamale. Thus, the information obtained through this interview is for academic purposes only and will be accorded the highest degree of confidentiality. Your consent is therefore sought to provide frank responses to the questions contained in this guide. Thank you for your cooperation and understanding. Date of Interview: [ ][ ]/[ ][ ]/[ ][ ][ ][ ] Respondent's code: [ ][ ][ ]/[ ][ ][ ]/[ ][ ][ ] Government managed irrigation scheme- GIS Biu irrigation scheme- BIU
Community managed irrigation scheme- CIS Saboro irrigation scheme – SAB
Bonia irrigation scheme –BON Korania irrigation scheme- KOR
Pungu-Talenia irrigation scheme - PUN Paga irrigation scheme –PGA
SECTION A 1.0 Socio- demographic data of farmer 1.1 Are you the household head? 0-No, 1-Yes 1.2 Indicate the composition of Household Category your household ( people eating by Age from the same pot) 0-14 15-24 25-54 55-64 65+ Total 1.3 What is your major occupation?
1.4 Sex of respondent 1.5 Age of respondent 1.6 Educational level
Code [ ] Total number of Household members Male Female
1- Crop farming 2-Trading or craftsmanship 3-Salary worker (state actual occupation) [______________________________] 0-Male 1-Female, Quote the exact age 1-No formal education 2- Primary education 112
Variable HH
HHsize
[
[ [ [
]
Occuptn.
] ][
] ]
Sex Age Educ.
www.udsspace.uds.edu.gh
3- JHS education 4- Vocational sch. /SHS/technical institute 5-Teacher/Agric/Nursing training colleges 6-Polytechnics/University 1- Single 2-Married 3-Seperated 4-Widowed
1.7 Marital Status
[
]
Mar_sta
SECTION B 2.0 The ecosystem-based farm management practices (EBFMPs) adopted by the farmer 2.1 What type of crops do Irrigated farm(s) Rain-fed farm(s) you cultivate?
2.2 What sustainable farm practices do you use on your farm(s)?
2.3 What are the benefits of using each of the above sustainable farm practices?
1.____________________________
1.____________________________
2.____________________________
2.____________________________
3.____________________________
3.____________________________
4.____________________________
4.____________________________
5_____________________________
5_____________________________
6_____________________________
6_____________________________
Irrigated farm(s)
Rain-fed farm(s)
Tick [√] those adopted 1-Manure/compost application [ ] 2-Conservative tillage /no tillage [ ] 3-Intercropping with legumes [ ] 4-Crop rotation [ ] 5-Mulching [ ] 6-Conservation of vegetation or trees [ ] 7-Efficient drainage system [ ] 8-Soil/stone bunding [ ]
Tick [√] those adopted 1-Manure/compost application [ ] 2-Conservative tillage /no tillage [ ] 3-Intercropping with legumes [ ] 4-Crop rotation [ ] 5-Mulching [ ] 6-Conservation of vegetation or trees [ ] 7-Efficient drainage system [ ] 8-Soil/stone bunding [ ]
Others:
Others:
............................................................
............................................................
............................................................
............................................................
............................................................
............................................................
______________________________________________________________ ______________________________________________________________ ______________________________________________________________ ______________________________________________________________ ______________________________________________________________ 113
www.udsspace.uds.edu.gh
:______________________________________________________________ ______________________________________________________________ ______________________________________________________________ ______________________________________________________________ ______________________________________________________________ ______________________________________________________________ ______________________________________________________________ ______________________________________________________________ ______________________________________________________________ ______________________________________________________________ ______________________________________________________________ ______________________________________________________________ 2.4 Why have you not used all the sustainable farm practices? 2.5 What other farming practices have you used that are not sustainable?
2.6 What are the reasons for using the above unsustainable farm practices? 2.7 What do you think are the effects of the above unsustainable farm practices?
Irrigated farm(s)
Rain fed farm(s)
Tick [√] those adopted 1- Excessive fertilizer application [ ] 2-Excessive insecticides and herbicides use [ ] 3-Cutting of trees [ ] 4-Leaking canals and general poor water management [ ] 5-Bush burning [ ] 6-Excessive tillage [ ] 7-Others (specify) [____________________________] _____________________________
Tick [√] those adopted 1- Excessive fertilizer application [ ] 2-Excessive insecticides and herbicides use [ ] 3-Cutting of trees [ ] 4-Leaking canals and general poor water management [ ] 5-Bush burning [ ] 6-Excessive tillage [ ] 7-Others (specify) [____________________________] _____________________________
______________________________
______________________________
______________________________
____________________________
_____________________________
_____________________________
______________________________
______________________________
______________________________
______________________________
______________________________
______________________________
2.8 What is your 1. Fertile [ ] 1. Fertile [ ] perception about the soil 0. Not fertile [ ] 0. Not fertile [ ] fertility SECTION C 3.0 Factors influencing the adoption of ecosystem-based farm management practices. Code Variables 114
www.udsspace.uds.edu.gh
3.1 Indicate the number of acres of your farmland(s) under cultivation. 3.2 Indicate your level of ownership of the farmland(s) under cultivation.
Irrigated farm(s) Rain-fed farm (s) Irrigated farm(s)
Rain-fed farm (s)
3.3 Do you have access to that particular land under cultivation in 3.1? ( skip if respondent have full ownership of land) 3.4 Indicate the distance of your farmland under cultivation from your home.
3.5 Is there farmer(s) who have adopted sustainable farm practices close to your farmland(s)? 3.6 How many times do you get extension officer visiting your farm in a year? 3.7 Is there any farmers' association that you belong? 3.8 Do you have access to organic manure or compost? 3.9 How many years have you been farming? 3.10 Are you into livestock rearing?
Irrigated farm(s) Rain-fed farm (s)
1- Full ownership 2- Share ownership 3-Rented 4-Gift 1- Full ownership 2- Share ownership 3-Rented 4-Gift 0-No 1-Yes 0-No 1-Yes
Write the approximated distance in meters/kilometers Write the Rain-fed approximated farm (s) distance in meters/kilometers 0-No Irrigated 1-Yes farm(s) 0-No Rain-fed farm 1-Yes (s) Quote the exact number of times
[ [
][ ][
[
]
[
]
] ]
Land_ownsp
[
] Land_access
[
]
Farm_distance
Irrigated farm(s)
0-No 1-Yes If yes, name? [______________________________] 0-No 1-Yes Irrigated farm(s) Rain-fed farm (s) 0-No 1-Yes
Farm_size
Close_adopters
[
]
[
]
[
][
[
]
Grp_Mem
[
]
Access_ Org
[ [
][ ][
]
] ]
Ext.Visits
Yrs_Experience Livestock_ownsh p
SECTION D INSTRUCTIONS: Diligence should be taken to explain the importance of the EBFMPs to farmers with the aid of the reference guide attached to the questionnaire before commencement of this session. 4.0 Farmer's Willingness to Pay (WTP) value for the sustainability of the EBFMPs 115
www.udsspace.uds.edu.gh
4.1 Do you usually get very good yield with the use of fertilizer? 4.2 What are some of the problems you are currently experiencing from the use of fertilizer? 4.3 What can be done to salvage the situation?
4.4 How much do you spend averagely to fertilize the soil and control pests and diseases in a season? 4.5 Considering the cost you usually incur on fertilizer in 4.4, how much will you be willing to pay for compost to fertilize your soil per an acre?
4.6 How much will you also be willing to pay the environment for controlling diseases and pests considering the cost on Pesticides per an acre in 4.4? 4.7 How much will you be willing to pay the natural environment for maintaining the temperature level of crops on your farm(s)?
Code [ ]
0-No 1-Yes
Variable
___________________________________________________________ ___________________________________________________________
___________________________________________________________ ___________________________________________________________ Qty
Unit
Unit price
Amt GH₵
Fertilizer Pesticides Herbicides Probe for the maximum s/he will be WTP 1- GH₵ 0 [ ] 2- GH₵ 1-50 [ ] 3- GH₵51-100 [ ] 4- GH₵101-150 [ ] 5- GH₵151-200 [ ] 6- GH₵ 201-250 [ ] 7- GH₵ 251-300 [ ] 8- GH₵ 301-350 [ ] 9- GH₵ 351-400 [ ] 10- GH₵401-450 [ ] 11- GH₵451-500 [ ] 12- above GH₵500 [ ] Probe for the maximum s/ he will be WTP 1- GH₵ 0 [ ] 2- GH₵ 1-50 [ ] 3- GH₵51-100 [ ] 4- GH₵101-150 [ ] 5- GH₵151-200 [ ] 6- above GH₵ 200 [ ] Probe for the maximum s/he will be WTP 1- GH₵ 0 [ ] 2- GH₵ 1-50 [ ] 3- GH₵51-100 [ ] 4- GH₵101-150 [ ] 5- GH₵151-200 [ ] 6- GH₵ 201-250 [ ] 116
[
]
[
]
[
]
[
]
www.udsspace.uds.edu.gh
4.8 What usually happens to your crops and/or economic life when there is shortage of water for farm business? 4.9 Considering the effects in 4.8, how much are you willing to pay for the services provided by the sustainable farm practices in ensuring regular water supply?
7- above GH₵250.00 [ ] _____________________________________________________________ _____________________________________________________________ _____________________________________________________________ Probe for the maximum s/he will be WTP 1- GH₵ 0 [ ] 2- GH₵ 1-50 [ ] 3- GH₵51-100 [ ] 4- GH₵101-150 [ ] 5- GH₵151-200 [ ] 6- GH₵ 201-250 [ ] 7- above GH₵250.00 [ ]
[
]
SECTION E 7.0 How farmers' livelihood conditions have been affected A. Food availability situation in farmer's household for the past 12 months Instructions: tick[ √] and score the appropriate condition for each month Sufficient =3, Insufficient=2, Extreme shortage=1 Grading Jan Feb Mar Apri May Jun Jul Aug Sep Oct Nov Month Score Total Score
Dec
B. Housing condition Instructions: tick[ √] the appropriate condition for each housing condition Ownership of house Number of rooms roofed with roofing sheets (e.g. zinc or aluminium sheets etc.). Number of rooms built with cement blocks. Number of rooms floored. General impression.
Score Personal house= 3 Family house= 2 Rented =1 [ ] All rooms =3 Half of the rooms =2 Below [ ] half=1
Total Score
[ All rooms = 3 half=1
Half of the rooms= 2
Below [
]
All rooms = 3 Half of the rooms= 2 Below [ half=1 Excellent =4 Very good =3 Good= 2 Bad= 1 [
]
C. Health situation Availability of health facility Any close-by health District hospital/ Community health centre/ CHPS facility? compound = 2 No health post closely available =1 117
]
]
Score [ ]
Total Score [ ]
www.udsspace.uds.edu.gh
Access to health treatment District All household members= 3, Some members =2 , hospital/Community No access=1 health centre Pharmacy Always =3 Difficult=2 Not at all=1 Herbal treatment Always =3 Difficult=2 Not at all=1 D. Water facilities (i) Water source Source of water
Score [ ]
Total Score [
[ [
] ]
Score [ ]
Borehole/pipe= 4 Mechanized well=3 Uncovered well=2 River/pond=1
]
Total score [ ]
score Total score (ii) Water quality Drinking water Good= 3 Clean but smells or hard =2 Unclean=1 [ ] [ ] (iii) Availability of water Adequate =3 Inadequate=2 Scarcity =1 Grading Jan Feb Mar Apr May Jun Jul Aug Sep Oct Nov Dec Month Score Total Score E. Freedom in cash expenditure Level of decision in cash expenditure Things for expenditure Farmer =4 Farmer and Spouse =2 spouse=3 Daily expenditure Investment on land Children education Health Household assets
Score
Total score
Extended family =1 [ [ [ [ [
] ] ] ] ]
[
]
F. Sanitation Access to a toilet facility Owned toilet=3 Community toilet=2 None=1 Condition of toilet Hygienic =3 Better= 2 Unhygienic =1
Score [ ] [ ]
Total score [ ] [ ]
G. Participation in social activities Participation level -Freedom to participate in any gathering=2 -Limited freedom to participate=1
Score [ ]
Total score [ ]
H. Health of ecosystem services Ecosystem services Sustained =3
Score
Total score
[ [
[
Deteriorating =2
Fish availability Vegetation for animals 118
Worsened =1 ] ]
]
www.udsspace.uds.edu.gh
Availability of medicinal plants Availability of fuel wood Fruits availability Water availability for recreational purposes Flood control Erosion control Siltation control Pests and diseases control SECTION F
[
]
[
]
[ [
] ]
[ [ [ [
] ] ] ]
Factors that might affect farmers' livelihood Crop farm income of household members for the past 12 months Household Members Crop (a)Total (b) Units output of {e.g. bags, crop bowls etc} Household Irrigated Head
(c) Crop Value per unit GH₵
(d) Total crop value {a*c} GH₵
Rain-fed
Spouse
Irrigated
Rain-fed Children and others
Irrigated Rain-fed
TOTAL
Inventory of Farmer's household livestock (Skip if respondent does not rear livestock) Type of livestock Number sold Number Number Number Number in over the last dead stolen killed for stock 12 months household consumption 119
www.udsspace.uds.edu.gh
Cattle Sheep Goat Pigs Poultry birds
Total
Other livelihood supporting income of farmer's household ( Skip if not applicable ) Remittances received Value in Gh₵ [ Average monthly salary of Household head ( if a Value in Gh₵ [ salary earner) Average monthly salary of Household head's Value in Gh₵ [ spouse (if a salary earner) Others [ ______________________________]
Name of interviewer: [__________________________________]
Signature: [____________]
Contact of interviewee (if any): [________________________________________________]
120
] ] ]
www.udsspace.uds.edu.gh
EBFMPs Reference Guide
EBFMPs Manure application Conservative tillage Inter-cropping with legumes Crop rotation
Mulching Conservation of vegetation Efficient drainage systems Soil/stone bunding
Some Importance of EBFMPs It provides energy for microbes and other minerals for growth of crops It also introduces nitrogen to the soil It conserves soil carbon which help maintain agricultural soil structure and fertility It controls soil erosion and siltation It provides organic nitrogenous compounds to plants
Allows biological balancing of soil nutrients such as fixation of nitrogen It controls chronic soil borne diseases It controls weeds and maintain crops temperature It also help reduce incidence of diseases Decompose to fertilize the soil nutrients It also prevents salination Prevents siltation and water wastage
Prevents water wastage and loss of soil nutrients.
121
www.udsspace.uds.edu.gh
Appendix B Livelihood indicators of farmers and scores of measurements Livelihood Indicators
Scores of Measurement
Total Score
A. Monthly food availability
Scores for all months in the year
January February * * * December
Sufficient =3, Insufficient Extreme shortage =1
B. Housing Conditions
Scores for housing condition parameters Personal house=3, Family house=2, HTS=16,
Ownership of house
=2, HTS=36, 𝐼𝐹𝐼𝑃𝑆𝑖𝐹𝐴
LTS=12 𝐼𝐹𝐹𝑆𝑖𝐹𝐴 = × 100 36
LTS=5
rented house= 1 Number of rooms roofed with All rooms =3, Half of the rooms=2, roofing sheets( e.g. aluminium or zinc sheets) Below half=1
𝐼𝐹𝐼𝑃𝑆𝑖𝐻𝐶 =
𝐼𝐹𝐹𝑆𝑖𝐻𝐶 × 100 16
Number of rooms built with All rooms =3, Half of the rooms=2, cement blocks Below half=1 Number of rooms floored
All rooms =3, Half of the rooms=2, Below half=1
General impression
Excellent =4, Very good= 3, Good=2, Bad=1
C. Health situation
Scores for health situation parameters Availability of close-by health District Hospital/community health HTS=11, facility centre/CHPS compound =2,
122
LTS=4
www.udsspace.uds.edu.gh
No health facility closely available=1 Access to Hospital/community centre
𝐼𝐹𝐼𝑃𝑆𝑖𝐻𝑆
District All household members= 3, Some health members =2 , No access=1
Access to herbal treatment
Always= 3, Difficult =2 ,
𝐼𝐹𝐹𝑆𝑖𝐻𝑆 = × 100 11
Not at
all=1 Pharmacy
Always= 3, Difficult =2 ,
Not at
all=1
D. Water facilities
Scores for water facilities parameters LTS=14 Source of water Borehole/pipe=4, Mechanized HTS=43, well=3, Uncovered well=2, River/pond=1 𝐼𝐹𝐹𝑆𝑖𝑊𝐹 𝑊𝐹 𝐼𝐹𝐼𝑃𝑆 = × 100 𝑖 Perceived quality of drinking Good= 3, Clean but smells=2, 43 Unclean =1 water Monthly availability of water
Adequate =3, Scarcity=1
Inadequate =2,
January February * * * December
E. Decision-making in cash Scores on decision parameters expenditure HTS=20, Daily expenditure Investment on land
Farmer=4,
Children's education
spouse=2, extended family=1
LTS=5
farmer and spouse=3,
Households assets
123
𝐼𝐹𝐼𝑃𝑆𝑖𝐹𝐶𝐸 =
𝐼𝐹𝐹𝑆𝑖𝐹𝐶𝐸 × 100 20
www.udsspace.uds.edu.gh
Health
F. Sanitation
Scores on sanitation parameters
Possession of toilet
Owned toilet=3, community toilet=2, HTS=6, None=1
Condition of toilet
LTS=2
𝐼𝐹𝐼𝑃𝑆𝑖𝑆 =
Hygienic=3, Better=2, Unhygienic=1
𝐼𝐹𝐹𝑆𝑖𝑆 × 100 6
G. Participation of in social Freedom to participate =2, limited HTS=2, LTS=1 freedom to participate =1
activities
H. Health services
of
𝐼𝐹𝐼𝑃𝑆𝑖𝑃 =
𝐼𝐹𝐹𝑆𝑖𝑃 × 100 2
ecosystem Scores on health of ecosystems services parameters HTS=30 ,
Fish availability Vegetation for animals Availability of medical plants Fuel wood availability Fruits availability Water availability recreational purposes Flood control Erosion control Siltation control Pests and diseases control
LTS=10
Sustained =3, Deteriorating =2 , Worsened=1
𝐼𝐹𝐼𝑃𝑆𝑖𝐸𝑐𝑜 =
I. Income
Scores on farm income
Category of last season’s crops value (GH₵ )
Category (GH₵ )
Score