SPECIAL FEATURE
Assimilation and differences between the settlement patterns of individual immigrants and immigrant households Mark Ellis*† and Richard Wright‡ *Department of Geography, University of Washington, Seattle, WA 98195-3550; and ‡Department of Geography, Dartmouth College, Hanover, NH 03755-3571
Analyses of immigrant settlement patterns typically rely on counts of foreign-born individuals by neighborhood, metropolitan area, state, or region. As an alternative, this study classifies immigrants and their descendents into household types to shift attention from individuals to relationships between individuals. The study uses pooled current population survey data to identify seven household types, six of which have various degrees of immigrant or secondgeneration presence. The research compares distributions of firstand second-generation immigrants with different types of households that include first- and second-generation immigrants. Our analysis shows that the geography of immigration based on households differs considerably from geographies based on individuals. The spatial distribution and concentration of the foreignstock population provides one picture of immigrant geographies, whereas the patterns of concentration by several different household types opens up the chance to tell other stories. More pointedly, we emphasize that the unit of analysis shapes assimilation research results and implies that this analytical choice cannot be thought of as independent from the politics of immigration. immigration 兩 spatial assimilation
T
he analysis of immigrant settlement patterns encompasses the study of ethnic residential neighborhoods and employment enclaves and the investigation of immigration’s impact on metropolitan and state ethnic and racial population change. In some cases, the spotlight falls on the location of all of the foreign-born; in others, it shines on specific national origin groups or subsets, such as immigrants in the work force. No matter the scale or focus, the analytical strategy typically highlights the difference between the geography of immigrants and a reference group, usually those born in the United States. The use of a referent in immigration analysis reflects the prevalent idea that characteristics of the U.S.-born residents are the yardstick by which society measures how well immigrants ‘‘fit’’ into society. Geographers contribute to this assessment by following their impulse to map immigrants with increasingly powerful cartographic software. Such mappings almost inevitably produce distinctive geographies of U.S.- and foreign-born individuals, cementing notions of an immigrant difference from the U.S.born, regardless of the value of these cartographies for our understanding of the underlying forces of sociospatial stratification. Of course, mapping immigrants can be a useful tool for social analysis and policy, exposing immigrant exploitation or relative deprivation or showcasing their progress in American society. But detailed locational information on the foreign-born is a double-edged sword; it can also aid efforts to surveil and control them (a much-enhanced prospect in the post-September 11, 2001, political climate) and can incite significant public unease. For example, the recent release of Arab-American locational information by the U.S. Census Bureau to the Department of Homeland Security has parallels with a similar effort to locate Japanese-Americans in the 1940s (1). www.pnas.org兾cgi兾doi兾10.1073兾pnas.0507310102
Although the uses and abuses of immigrant cartographies is certainly an interesting topic and one worthy of deeper investigation, our present concerns have less to do with particular maps than with the unit of such analyses: the individual immigrant. Maps of immigrants rely on counts of individuals for two main reasons: (i) The vast majority of individuals have clearly defined singular places of origin; and (ii) census and other demographic data, first and foremost, count and categorize individuals. This paper asks what happens when we shift from a focus on individuals to relationships between individuals. More specifically, what happens to our understanding of the geography of immigration when it is examined at the scale of the household rather than the individual? To begin to think about mapping the household arrangements of immigrants, we define ‘‘foreign-stock households’’ as containing at least one foreign-born person or someone whose parent(s) was (were) foreign-born. Such households contain at least one member whose lived experience is inseparable from the experience of immigration, either directly or through a parent. Mapping counts of individual immigrants obscures this experience by conjuring up images of a discrete population of foreignborn individuals, atomized not only from each other but also from the U.S.-born. The visual impression is one in which immigrants share interests and social bonds only with other immigrants, whereas the U.S.-born likewise interact only with other native-born individuals. By contrast, a household approach counters the notion of discrete U.S.- and foreign-born populations and moves to the foreground the intersections in the lives of many immigrants and the U.S.-born. To illustrate what this approach means for our understanding of immigration, imagine two places. In both, the population is 30% foreign-born. However, in one, the majority of immigrants share households with U.S.-born persons, whereas in the other, most immigrants live in households made up exclusively of the foreignborn. A simple body count indicates that these places have indistinguishable experiences of immigration. The difference in living arrangements and household relations between these two places, however, would surely affect the economic and cultural experiences of both groups. It also seems likely that antagonism toward the foreign-born would be diminished in the location where most of them share households with the U.S.-born. The remainder of this essay consists of three sections. We start by elaborating on some of the ideas touched on in the introduction, especially concerning whom and what to map, the implications of these choices for uncovering the geography of immigration, and the effect this decision has on perceptions of immigrant separateness. We then examine the living arrangements of immigrants and their children in the United States by Conflict of interest statement: No conflicts declared. This paper was submitted directly (Track II) to the PNAS office. †To
whom correspondence should be addressed. E-mail:
[email protected].
© 2005 by The National Academy of Sciences of the USA
PNAS 兩 October 25, 2005 兩 vol. 102 兩 no. 43 兩 15325–15330
SOCIAL SCIENCES
Edited by William A. V. Clark, University of California, Los Angeles, CA, and approved September 15, 2005 (received for review July 1, 2005)
categorizing households by the presence of combinations of first-generation, second-generation, and third-generation-plus immigrants. Next, the investigation explores how these household types differ in their spatial dispersion across the United States. Most U.S. immigrants live in just six states (California, New York, Florida, Texas, New Jersey, and Illinois), but there are recent signs of their dispersion beyond these locations (2). This paper explores how the interstate geography of immigrants may be related to their living arrangements. In the last section, we discuss the findings and delineate directions for future household-scale investigations of immigration. Counting and Categorization: Individuals or Households? The concentration on the individual in immigration research matches up with the main pillars of population research. Fertility, mortality, and migration are unquestionably events associated with individual bodies. Of course, household structure and geographic context condition these events, but, analytically, they are probably best comprehended when structured as individual births, deaths, and geographic movements. This interest in individual outcomes carries over into the development of categorization schemes. Classifications by age, sex, and race, among others, help refine our understanding of the causative forces behind various outcomes. Questions about the propensity for women to migrate compared with men or the infant mortality rates of African-American children compared with nonHispanic white children hinge on such taxonomy. While such groupings may assist in making sense of individual outcomes, they are, of course, not fixed or preordained; rather they are social constructions imposed to order reality according to evolving ideas of human difference. The fluidity of U.S. racial classification schemes perhaps best illustrates this point (3, 4). Age categories, however, also shift; the definitions of groups such as children, middle-aged, and elderly change with the times. Sex, too, is forced to fit within accepted binary-gendered norms. Counting exercises that use these categories help animate group identity and rationalize hierarchies. Hacking (5) refers to this process as ‘‘dynamic nominalism,’’ whereby the acts of naming categories and counting by them help bring groups into existence. An additional effect of categorization is the division of populations by how individuals are marked rather than how their lives are lived, and, importantly, who they are lived with (cf. refs. 6 and 7). In terms of mapping immigrants, this categorization system has yielded much cartography of immigrant individuals that disguises the existence of mixed-nativity households. Foregrounding immigrant living arrangements could offer greater insight into immigrant geography. It could also enrich immigrant social analysis more generally. For example, one could use a household approach to contrast poverty rates between immigrant households (defined as households with at least one immigrant) and U.S.-born households (defined as households without any immigrants). Such a contrast shifts the focus from foreign-born versus U.S.-born differences to the relationship between immigrant–native living arrangements and material wellbeing. A household approach could also generate insight into immigrant residential processes. For many years, the theory and analysis of residential mobility has recognized the centrality of household types and household attributes in residential decisionmaking. Yet these insights have not trickled into assessments of the effect of mixed-nativity households on tenure choice and residential distributions. Ignoring immigrant–native household connections could exaggerate the difference in homeownership rates between U.S.-born and foreign-born populations (8). Additionally, awareness of these immigrant–native household connections could deepen our understanding of the process of immigrant spatial assimilation (9). 15326 兩 www.pnas.org兾cgi兾doi兾10.1073兾pnas.0507310102
It would be foolish to suggest that all analyses of immigration should use households, not individuals, as the unit of analysis. Insights predicated on a comparison between individual immigrants and the U.S.-born will remain useful in some circumstances. But in those cases where analysis centers on individuals, with household and other contexts either submerged or conceived of as no more than mediating effects, scholars must always reflect on their analytical choices and erasures in immigration research. Accordingly, this paper offers an alternative perspective that features interconnections between the lives of immigrants and the U.S.-born. Our aim is not simply to improve understanding of the processes of immigrant sociospatial incorporation; we also seek to illustrate how the judicious use of the tools of social geography can show some of the ways in which immigrants constitute ‘‘us,’’ not ‘‘them.’’ The Living Arrangements of Immigrants The measurement of immigrant–native mixing within households requires data that record the nativity of individuals and their connections to household members. The richest data source for this sort of analysis is the March Annual Demographic Supplement of the Current Population Survey (CPS) (31). The public-use microdata files of the decadal census have much larger samples and information on ancestry, but, unlike the CPS, no information on an individual’s parents’ birthplace is given. To ensure sufficient sample sizes for this analysis, we pooled the outgoing sample rotations of the March CPS from 1997–2001. These data allow the classification of individuals into three generations: (i) immigrants or the foreign-born (those born outside the United States or its possessions), (ii) second generation (those born in the United States to at least one foreignborn parent), and (iii) third generation plus (those born in the United States and whose parents were also born in the United States). Immigrants and the second generation combined make up what is known as foreign-stock population, the part of the population that has a direct connection to immigration through either foreign-birth or immigrant parentage. These three generations yield seven household types (defined by using people of all ages in households, not just adults), the first six of which have various degrees of foreign-stock (immigrant or second generation) presence: 1. 2. 3. 4.
Immigrant-only household Immigrant兾second-generation household Immigrant兾third-generation-plus household Immigrant兾second-generation兾third-generation-plus household 5. Second-generation-only household 6. Second-generation兾third-generation-plus household 7. Third-generation-plus-only household All but household type 7, third-generation-plus-only households, are connected to immigration directly through the presence of a foreign-born person, or indirectly through the presence of a parent who was foreign-born. The production of this seven-tier classification scheme links this study to a growing literature that uses typologies of household structure to explore the relationships between immigration status, living arrangements, and various social outcomes (e.g., refs. 10–14). Table 1 shows the distribution of the U.S. population by these household types. It shows that foreign-stock households, those with at least one foreign-born or second-generation member, hold 28% of the U.S. population, while the other 72% live in third-generation-plus households. To gain perspective on this proportion, Table 2 shows the percentage of individuals by generational status. It reveals that 79% of U.S. individuals in 1999 could claim to be third or more generation compared with the 72% of the population living in Ellis and Wright
Household type Immigrant-only Second-generation-only Immigrant兾second-generation Immigrant兾third-generation-plus Second-generation兾thirdgeneration-plus Immigrant兾second-generation兾 third-generation-plus Total foreign-stock Third-generation-plus-only Total
Population
Percent
12,014,871 5,855,220 22,797,476 4,263,607 24,968,022
4.46 2.17 8.47 1.58 9.27
6,606,241
2.45
76,505,436 192,744,742 269,250,178
28.41 71.59 100.00
Total foreign-stock (bolded text) is the sum of the population of the six foreign-stock households above. The overall total (bolded text) is the sum of the population in foreign-stock households plus that in the third-generationplus households. Source: Ref. 31.
third-generation-plus only households. The difference of 7% represents almost 17 million third-generation-plus people who share households with immigrants or their children. A closer look at Table 1 shows that the share of population in specific types of foreign-stock households varies greatly. Notably, combinations involving a third-generation-plus person account for almost half of the population who live in a foreignstock households. Not, surprisingly, the biggest category here is the second generation兾third generation plus combination (25 million), but almost 11 million people live in households in which the third-generation-plus mix with immigrants (immigrant兾third generation plus and immigrant兾second generation兾third generation plus). Admittedly, there is a larger population living in immigrant-only households (12 million), and especially in immigrant兾second-generation households (23 million), but 11 million people living in households in which immigrants and third-generation-plus individuals mix is a sizeable group. The extent to which immigrants and their descendents share households with the U.S.-born from the third generation plus should not be surprising in light of the primacy of family reunification under U.S. immigration law. Immediate family members of U.S. citizens (spouses, parents, and children under 18) immigrate to the United States with ease, relative to some other avenues of entrance, and represent a significant proportion of the total immigrant flow. For example, in 2001, the number of immediate relatives of United States citizens admitted was 443,035 of the annual inflow of 1,064,318 (see ref. 15, table 4). Whereas the law structures much immigration as a family act, other influences bind the lives of immigrants and the U.S.-born within households. Many immigrants are relatively isolated from the U.S.-born by language and cultural differences in the months and years after arrival. Over time, however, contact in the workplace and other arenas of daily life elevates the odds of Table 2. Distribution of immigrant and U.S.-born population by individuals Individuals
Population
Percent
Immigrant Second-generation Total foreign-stock Third-generation-plus Total
27,918,324 29,300,304 57,218,628 212,031,550 269,250,178
10.37 10.88 21.25 78.75 100.00
Total foreign-stock (bolded text) is the sum of the immigrant population. The overall total (bolded text) is the sum of the foreign-stock population and the third-generation-plus population. Source: Ref. 31.
Ellis and Wright
Individuals, Households, and Settlement Geographies Most spatial assimilation studies focus on the neighborhood (re)location of immigrants within metropolitan areas, masking the household as an interesting scale within urban analysis. The roots of this interest in city neighborhoods run deep and trace back to the social ecology models of Park and Burgess in the 1920s (32, 33). These Chicago School scholars remarked on the suburban dispersion of immigrants and their descendents who moved out from zones of initial settlement near the central city in accordance with both cultural adjustment and economic achievement. Massey (17) rearticulated this process in new detail, and his reformulation forms the basis for much subsequent work investigating neighborhood change and the spatial adjustments of immigrants in the United States (e.g., refs. 18–21). In the same decade that Park and Burgess pioneered urban social ecology, Thomas and Znaniecki (22) published their classic study of the culture and social organization of Polish immigrant lives. This work, which is often remembered for its analysis of the immigrant community, devoted considerable attention to understanding the role of family in immigration and the loosening of its solidarity that occurred with international resettlement. Within the subdiscipline of immigration history, Thomas and Znaniecki’s work has had substantial impact. It is therefore not surprising that the immigrant family兾household has received more attention in history than in other disciplines concerned with immigration (e.g., ref. 23). Some contemporary sociological studies of immigration have responded to these ideas, centering their analysis of incorporation on the family (e.g., ref. 24). Whereas some ethnographic accounts of immigration delve into household experiences and the effects of migration on family ties and roles, with a few exceptions (e.g., refs. 25, 26) census-based accounts of immigrant residential experience tend to privilege the analysis of neighborhoods. Most studies never ask the question: With whom do immigrants live at the household rather than the census tract scale? Even White and his colleagues (25, 26) do not get into the details of household structure. In contrast, we hypothesize that different types of immigrant households experience dissimilar trajectories of spatial assimilation. The focus falls on the interaction between types of immigrant–native mixing at the household scale and the spatial distribution of these households. Spatial assimilation theory provides a guide for how immigrant geography will change over generations. Initially, it suggests that immigrants concentrate in a few locations, funneled there by networks of family and friends. Over time, they and their children’s generation will disperse away from ethnic concentrations with acculturation and economic advancement. In logical progression, third-generation descendents should move even farther afield as socioeconomic and cultural adaptations continue. Although the theory was designed to explain immigrant intrametropolitan moves, the literature on interstate immigrant geography is infused with the same logic. Embedded within research on immigrant and second-generation migration within the United States is an expectation that immigrant socioeconomic progress will generate immigrant moves away from cities and states of immigration, in much the same fashion as it drives their residential mobility within cities (e.g., refs. 27–29). Accordingly, our analysis of immiPNAS 兩 October 25, 2005 兩 vol. 102 兩 no. 43 兩 15327
SPECIAL FEATURE
selecting life partners from outside the ethnic origin group, possibly from the U.S.-born of third or greater generation ancestry. Such mixing will be even more likely for the second generation. The methods and presentation here could be extended beyond the confines of the household to the extended family. Goldstein’s (16) research on mixed-race contact within extended families is instructive, for it shows how contact with others operates beyond the immediate confines of the household. The same sorts of connections probably exist with many immigrant groups.
SOCIAL SCIENCES
Table 1. Distribution of immigrant and U.S.-born population by household type
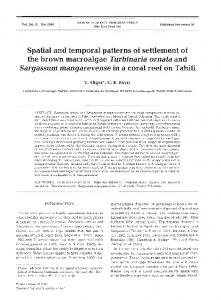
Fig. 1. Hypothesized relationships between foreign-stock types household and spatial dispersion. The colored circles depict the expected spatial dispersion for three generations of immigrant individuals. The colored stars depict the expected spatial dispersion for four types of foreign-stock households.
grant household interstate geography uses core ideas from spatial assimilation theory as an initial guiding framework. Fig. 1 depicts what spatial assimilation theory expects for the spatial dispersion of the populations of three generations of immigrant individuals (colored circles) when no account is taken of their living arrangements (the sequence described in the previous two paragraphs). Household composition will mediate the dispersion process, with blends of households that contain third-generation-plus individuals more dispersed than those with only immigrants or immigrants and their children. Fig. 1 sketches some of these expectations, showing dispersion for four types of foreign-stock households (colored stars). On the whole, generational mixing within households is expected to be associated with increased spatial dispersion. Immigrant兾third-generation-plus households will likely not be as dispersed as second-generation兾third-generation-plus households. The former household type is placed higher on the mixing scale as it contains foreign-born and U.S.-born people, whereas the latter contains only U.S.-born individuals. We expect immigrant兾third-generation-plus households to be more geographically concentrated than second-generation兾third-generationplus households because of the draw of immigrant locations for immigrant family members. The difference in spatial concentration between these groups, however, may be quite small. As a first empirical cut at these ideas, Fig. 2 maps the distribution of four groups: the immigrant individual population (for reference purposes) and the populations of three household types, immigrant兾second-generation, immigrant兾third-generation-plus, and second-generation兾third-generation-plus. These maps show distributions of location quotients, a commonly used and easy-tointerpret measure of over- or underrepresentation on maps. The quotients in this instance are ratios of the state percentage share of the group population divided by the state percentage share of the U.S. population. For example, a ratio of 1 means that the state share of the group is the same as its share of the U.S. population. A ratio of 2 means that the state share of the group is twice that of its share of the U.S. population. A ratio of 0.5 means that the state share of the group is only half that of its share of the U.S. population. Areas shaded in red indicate overrepresentation, with the darkest red shade meaning the highest levels of overrepresentation. Blue shades mean underrepresentation with the deepest blue indicating the lowest representation level. The immigrant individual population (Fig. 2 Upper Left) shows a familiar distribution with highest concentrations in Hawaii, California, New York, Florida, and New Jersey, and modest 15328 兩 www.pnas.org兾cgi兾doi兾10.1073兾pnas.0507310102
concentrations in Texas and in some of the states abutting California. Note that Illinois, which ranks among the top six states in terms of number of immigrants, has a location quotient of ⬍1 because its share of immigrants is smaller than its share of total U.S. population. The distribution of the population in immigrant兾second-generation households (Fig. 2 Upper Right) is quite similar to the immigrant map, but there are some noteworthy differences: New Jersey and Florida fall out of the top category; Nevada rises to the top; and Illinois and Rhode Island shift from underrepresentation to overrepresentation. For the population in immigrant兾third-generation households (Fig. 2 Lower Left), the distribution is quite different from that in the maps in Fig. 2 Upper. Hawaii, Florida, Arizona, and Colorado have the greatest relative concentrations of these households. New York and California are only moderately overrepresented, along with a large group of states in the west and northeast, plus Minnesota and North Carolina. Relative to the first two maps, this map depicts a more spatially even distribution. The final map, of second-generation兾third-generation households (Fig. 2 Lower Right), is an even more dispersed population, with Washington, Hawaii, and states in the northeast exhibiting the highest rates of concentration. As in the other three maps, the southeast remains a region of underrepresentation. The maps hint at some of the expected differences in dispersion charted in Fig. 1. To explore the question of dispersion more precisely, we calculate the entropy of these distributions across states. D(K) is defined as
冘 K
D共K兲 ⫽
pkln
k⫽1
1 , pk
[1]
where pk is the percentage share of the distribution in state k, K is the total number of states, and
冘 K
pk ⫽ 1.
[2]
k⫽1
D(K) has a maximum value of ln(K), which occurs when all values of pk are identical, indicating maximum evenness or dispersion, and a minimum value of 0 which occurs when K ⫺ 1 observations record a probability of 0. D(K) can be scaled to range between 0 and 1 when divided by ln(K), the mathematical maximum. Alternatively, dividing by a value taken from a reference distribution can scale D(K). Ellis and Wright
SPECIAL FEATURE SOCIAL SCIENCES
Fig. 2. State distributions of the population of immigrant individuals (Upper Left) and those living in three types of foreign-stock households (Upper Right and Lower). The maps show distribution of location quotients. These are the ratios of the state percentage share of the group population divided by the state percentage share of the U.S. population. A ratio of 1 means that the state share of the group is the same as its share of the U.S. population. Source: Ref. 31.
We adopt the latter option by using the entropy calculated from the distribution of population in third-generation-plus only households as the reference distribution. The geographical distribution of this household type is spatial assimilation theory’s normative target distribution, i.e., the geography that immigrants and their descendents are hypothesized to ultimately assume. Table 3 lists entropy scores relative to this target distribution for all six foreign-stock household types and, for reference purposes, three populations of individuals: immigrants, the second generation, and the third generation plus (these three groups are in boldface to distinguish them from household types). The scores are calculated in three ways: for the full sample (All) and two subsamples defined as above or below median household income. Income is a crucial marker of successful incorporation into U.S. society, and spatial assimilation theory argues that increased income translates into household moves to better locations. There should be greater dispersion by those above median household income than by those below it. The groups are ranked from high to low by their scores for the full sample in column 1. Beginning with the three individual groups in boldface, Table 3 shows greater dispersion with each generation. This trend precisely follows spatial assimilation theory’s prediction. FurEllis and Wright
thermore, immigrants and second-generation individuals in higher-income households are more dispersed than those in households with below-median income. The difference in dispersion by income groups, however, is quite small, especially in the second generation. Thus, generational status, not income, appears to have the most effect on dispersion at the state level. Foreign-stock household types range in their dispersion as Fig. 1 predicts. Immigrant兾second-generation household populations are considerably more concentrated than all other groups, even more than the population of immigrant individuals. In contrast, households in which immigrants mix with the third generation plus are much more dispersed than immigrant individuals. Immigrant兾third-generation households and second-兾 third-generation households have relative entropies in the 0.9 range, indicating that their dispersion across states is approaching that of third-generation-plus households. Like individual patterns, these household patterns are relatively unaffected by household income. Comparisons across income within household type show that in most instances high-income households are slightly more dispersed than their low-income counterparts. The absence of a strong income effect suggests that differences in the dispersion of types of foreignPNAS 兩 October 25, 2005 兩 vol. 102 兩 no. 43 兩 15329
Table 3. Relative entropies of household types and immigrant populations by generation Relative entropy
Household兾population type Third-generation-plus population Second-third-generation households Immigrant兾third-generation households Second-generation-only households Immigrant兾second-generation兾 third-generation-plus households Second-generation population Immigrant-only households Immigrant population Immigrant兾second-generation households
All
Below median income
Above median income
0.9953 0.9206
0.9969 0.9238
0.9936 0.9176
0.9008
0.8916
0.8994
0.8625 0.8437
0.8748 0.8234
0.7993 0.8492
0.8256 0.7584 0.7503 0.6874
0.8162 0.7442 0.7308 0.6627
0.8341 0.7755 0.7712 0.7113
Boldface indicates populations of individuals. Source: Merged March Annual Demographic Supplement of the Current Population Survey, 1997–2001.
stock households are not an artifact of their income status in U.S. society. In fact, with whom an immigrant lives matters more than household income for state-scale spatial dispersion. Table 3 shows that both low- and high-income household types that include immigrants and the third generation plus are more dispersed than the high-income populations of immigrant and second-generation individuals. Discussion and Conclusions With whom immigrants live relates to where immigrants live. Our central finding generally holds across the income spectrum and at the state scale. This household effect is invisible to current spatial assessments of assimilation, which compare locational patterns of individual immigrants with those of the U.S.-born. The roots of these individually focused group comparisons reach back to the work of Chicago School sociologists. The accuracy of such a perspective in 1920s Chicago is not the issue here, although household mixing of groups for that time and place certainly deserves investigation. Rather, the question is how to move beyond 1. Clemetson, L. (July 30, 2004) New York Times, Section A, p. 14. 2. Singer, A. (2004) The Rise of the New Immigrant Gateways (Brookings Institution, Washington, DC). 3. Anderson, M. (1988) The American Census: A Social History (Yale Univ. Press, New Haven, CT). 4. Rodrı´guez, C. (2000) Changing Race: Latinos, the Census, and the History of Ethnicity in the United States (New York Univ. Press, New York). 5. Hacking, I. (1983) Representing and Intervening: Introductory Topics in the Philosophy of Natural Science (Cambridge Univ. Press, Cambridge, U.K.). 6. Brown, M. (1995) Environ. Plan. D 13, 159–183. 7. Marston, S. A. (2000) Prog. Hum. Geogr. 24, 219–242. 8. Jasso, G. (2004) Brookings–Wharton Papers on Urban Affairs, pp. 188–203. 9. Wright, R., Ellis M. & Parks, V. (2005) City Commun. 4, 111–135. 10. Brandon, P. D. (2002) Int. Migr. Rev. 36, 416–436. 11. Perez, I. (1996) in The New Second Generation, ed. Portes, A. (Russell Sage, New York), pp. 108–118. 12. Oropesa, R. S. & Landale, N. (1995) Soc. Sci. Q. 78, 399–416. 13. Jasso, G., Massey, D. S., Rosenzweig, M. R. & Smith, J. P. (2000). Int. Migr. Rev. 34, 443–459. 14. Fix, M. E. & Zimmerman, W. (1999) All Under One Roof: Mixed-Status Families in an Era of Reform (Urban Institute Research Paper no. 409100). 15. U.S. Immigration and Naturalization Service (2003) Statistical Yearbook of the Immigration and Naturalization Service, 2001 (U.S. Government Printing Office, Washington, DC) p. 25. 16. Goldstein, J. R. (1999) Demography 36, 399–407. 17. Massey, D. S. (1985) Sociol. Soc. Res. 69, 315–350.
15330 兩 www.pnas.org兾cgi兾doi兾10.1073兾pnas.0507310102
conceptualizations of spatial assimilation that pay little or no heed to the evident mixing between generations in today’s households. Although we are not the first to recognize that household processes are part of assimilation, only a few other researchers address how household composition may shape group geographies and patterns of their locational change (e.g., ref. 21). Despite the exclusive empirical attention to states in this analysis, the household approach makes sense for examinations of immigrant geography in smaller spatial units: metropolitan areas, counties, cities, and neighborhoods. Unfortunately, household data are not typically available for public use at the finest spatial scales. To replicate this analysis using metropolitan-area census tracts would require approval to access confidential census data in a secure facility. Moreover, analysis of residential location by household type increases analytical difficulty for at least two reasons. First, it requires building information about relationships within households into descriptive statistics and models. Second, such an analysis must disentangle any endogeneity between household residential location and the level and type of generational mixing within households. Although challenging, these problems are not insurmountable. Our own research using tract-level confidential data shows that mixed-nativity households in Los Angeles are much less likely to live in enclave neighborhoods than same-nativity households (30). This trend is consistent with the greater state-scale dispersion of mixed generation households found in this analysis. The results of this paper speak not only to assimilation theory but also to some broader political concerns. In social science research, the repeated analysis of the foreign and U.S.-born at the scale of the individual promotes the idea of the social distinctiveness of these groups. This study shows show that household-scale relationships among the foreign- and U.S.-born are relatively common and that the configuration of these domestic arrangements relates to where immigrants live. These geographies of living arrangements are likely bound up with local immigration impacts, both real and perceived. For example, states with a high frequency of immigrant兾thirdgeneration-plus household types may find that these family connections both ease the sociocultural and economic adjustment of newcomers and defuse more general native anxieties about immigrants. These and other potential effects of immigrant living arrangements warrant investigation. We thank Bill Clark and Susan Hanson and the anonymous reviewers for their valuable suggestions to improve the paper. National Science Foundation Grant BCS-9986877 supported this study. 18. 19. 20. 21. 22. 23. 24. 25. 26.
27. 28.
29. 30. 31. 32. 33.
Logan, J. R., Alba, R. D. & Zhang, W. (2002) Am. Sociol. Rev. 67, 299–322. Alba, R. D., Logan, J. R. & Stults, B. J. (2000) Soc. Forces 79, 587–621. Allen, J. P. & Turner, E. (1996) Prof. Geogr. 28, 140–155. Zhou, M. (1992) Chinatown: The Socioeconomic Potential of an Urban Enclave (Temple Univ. Press, Philadelphia). Thomas, W. I. & Znaniecki, F. (1920) The Polish Peasant in Europe and America: Monograph of an Immigrant Group (Univ. of Chicago Press, Chicago). Bodnar, J. (1985) The Transplanted (Indiana Univ. Press, Bloomington). Hondagneu-Sotelo, P. (1994) Gendered Transitions (Univ. of California Press, Berkeley). White, M. J. & Sassler, S. (2000) Sociol. Sci. Q. 81, 997–1013. White, M. J. & Omer, A. (1997) in Keys to Successful Immigration: Implications of the New Jersey Experience, ed. Espenshade, T. J. (Urban Institute Press, Washington, DC), pp. 375–394. Bartel, A. (1989) J. Labor Econ. 7, 371–391. Frey, W. H. & Liaw, K. L. (2005) Explaining Migration Within the United States: The Impact of Immigrant Minorities and Blacks (Brookings Institution, Washington, DC). Kritz, M. M. & Nogle, J. M. (1994) Demography 31, 509–524. Ellis, M., Wright, R. & Parks, V. (2005) Urban Geogr., in press. Current Population Survey (2001) March Annual Demographic File, 1997–2001 (U.S. Dept. of Commerce, Bureau of the Census, Washington, DC). Park, R. E. (1925) in The City, eds. Park, R. E., Burgess, E. W. & McKenzie, R. D. (Chicago Univ. Press, Chicago), pp. 1–46. Burgess, E. W. (1925) in The City, eds. Park, R. E., Burgess, E. W. & McKenzie, R. D. (Chicago Univ. Press, Chicago) pp. 47–62.
Ellis and Wright