association between Java Programming Language (JPL) coding standard and fault density of .... âR18: do not use static mutable fields.â â. â. âR19: declare ...
(IJACSA) International Journal of Advanced Computer Science and Applications, Vol. 8, No. 5, 2017
Association between JPL Coding Standard Violations and Software Faults: An Exploratory Study Bashar Q. Ahmed
Mahmoud O. Elish
Computer Science Department Taiz University Taiz, Yemen
Computer Science Department Gulf University for Science and Technology Mishref, Kuwait
Abstract—Since the software community has realised the importance of adopting coding standards during the development process for improved software quality, many coding standards have been proposed and used during the software development. The main objective of this paper is to explore the association between Java Programming Language (JPL) coding standard and fault density of classes in object-oriented software. For this purpose, a set of metrics that quantify the violations of coding standards has been proposed. An exploratory study was then conducted in which data were collected from six open source software systems. The study involved principal component analysis, bivariate correlation analysis, and univariate regression analysis. The principle component analysis has shown that many of the proposed metrics fall into the first two components which in turn reflects the importance and diversity of these metrics. Furthermore, associations between some metrics and fault density have been observed across all systems, and thus indicate that these metrics can be useful predictors for improved early estimation of faulty density of object-oriented classes. Keywords—Coding standard; Software faults; Software quality; Exploratory study
I.
INTRODUCTION
Coding standards and programming styles form a set of pre-defined formal rules which are internally shared among software project team members, and enforced by software projects managers by applying static analysis during the source code writing [1]. The rules of these standards are typically based on expert’s opinions, and reflect different concerns that affect different aspects of source code writing with the aim of improving many quality attributes of the underlying software system [2]. The usage of coding standards and tools for enforcing their rules is becoming a popular trend in software development especially during the writing of code lists [3]. Coding standard’s rules can be targeted towards different software quality attributes and hence are believed to improve quality [2]. However, there is no empirical evidence on the relationship between coding standard’s rules violations at the class level of object-oriented software and the presence of faults and their density. This research paper mainly aims to find an answer to the following question: Does the violation of coding standard’s rules have a relationship with the existence of faults in software products? The paper focuses on the class-level of object-oriented software and adopts the Java Programming
Language (JPL) coding standard [4] for the purpose of conducting the exploratory study. A set of metrics that quantify the violations of coding standards has been proposed. The rest of the paper is organised as: Section 2 reviews related work. Section 3 describes JPL coding standard. Section 4 describes the coding standards’ violation-based metrics. Section 5 describes the conducted exploratory study and reports its findings. Finally, Section 6 provides concluding remarks. II.
RELATED WORK
Boogerd and Moonen [3] applied the MISRA-C:2004 [5] coding standard to measure the quality of source code of two commercial projects before and after bug fixes during the development of two embedded C applications. They propose simple metric called violations density which is the number of violations divided by the number of lines of code of the corresponding unit (project, module, and file). They considered 89 coding rules belonging to different coding categories. As a result, they found that only 10 rules from the considered 89 rules are significant predictors for fault locations. Those 10 rules were found to be positively correlated with fault proneness. In another work, Boogred and Moonen [2] applied the MISRA-C:2004 [5] coding standard against all the revisions of two commercial software projects. To build a body of empirical knowledge to understand the relationship between coding standard’s violations and faults density, they used two metrics called violations density metric (the number of violations per version divided by the number of KLOC for that version) and fault density metric (the number of faults per version divided by the number of KLOC for that version) at the system level. Their study considered only 72 rules out of 141 rules of MISRA-C:2004 standard. As a result of their study, they found that there is a positive correlation between violations density and faults density only for 12 rules. Basalaj and Beuken [6] used a coding standard’s violations metric as a measure of internal quality of software source code. Their study measured the number of coding guidelines violations in 18 closed source products written in C and C++ of two software production companies. Among the 900 rules of high-integrity C++ [7], MISRA-C:2004 [5], they found a positive correlation between coding rules’ violations and faults only for 12 rules out of the mentioned 900 rules. In addition to
151 | P a g e www.ijacsa.thesai.org
(IJACSA) International Journal of Advanced Computer Science and Applications, Vol. 8, No. 5, 2017
faults they also found that the compliance to a coding standard has a positive impact on the portability of software products. In their study, Kawamoto and Mizuno [8] evaluated the relationship between the length of identifiers and the existence of software faults in a software module. To investigate such relation, they built a model to determine faulty-module using a machine learning technique from the number of occurrences of the identifiers. Their study tested two metrics Oc(L) which is the number of the occurrences of identifiers with length L in a module (they considered the length of the identifier as one of the characteristics of identifier’s naming rules) and TN which is the total number of identifiers found in a module against two open source projects. As a result for their experimentation, they showed that there is a certain relationship between the length of identifier and the existence of software faults and they also specified the best length the identifiers should have. There are server limitations with previous studies. Most of them have focused on the highest code granularity level which is the software system as a whole in terms of its releases. This makes it difficult to identify which portion of the software system needs to be reviewed or refactored. Moreover, even in those studies that have used the coding standards violationsbased metrics at the class level, the researchers used them in a limited way. For example, Elish and Offutt [9] conducted a controlled small-scale experiment that tries to determine to which extent the open source Java programmers adhere to a small set of coding practices. Similarly, Kawamoto and Mizuno [8] used as coding standards violations-based metrics, only one metric called the number of occurrences of identifiers with length L in a class which collect the violations for only one rule related to the naming conventions. Another limitation of previous studies is that the target set of systems under study was small which in turn restrict the generalisation of the obtained results. Although Basalaj and Beuken [6] used 18 closed source products in their study. They used only one metric which is the number of coding standard’s violations per software product in terms of versions, which in turn makes the prediction models unsatisfactory. III.
JPL CODING STANDARD
Since the software community realises the importance of adopting coding standards during the software development process, many coding standards have been proposed and used during the software development. Some of these coding standards are general and applicable for several programming languages, while others are dedicated for specific language. Furthermore, some standards are well known and widely used by the software community like Sun Java coding standard 1999 [10] presented by Sun Micro-Systems (the first owner of Java language), while others are self-imposed and developed by special software production companies. Some standards are targeted towards several software quality attributes, while others are targeted at certain quality attribute. Among the proposed and published coding standards, this research selected the Java Programming Language (JPL) coding standard [4] due to many reasons: (1) The primary purpose of JPL standard is reducing faults which is the addressed quality attribute by this study. (2) It is one of the most recent published standards. (3) It is published by a reliable and reputable
institution. (4) It is supported by the available static analysers. (5) It is dedicated for Java programming language which is the underlying programming language of this study. JPL coding standard comprises a set of 53 rules expressing bad programming practices and bugs patterns that mostly have to be avoided during writing code lists. These rules are categorised into 11 categories reflecting the usage of Java language constructs. It is worth here to mention that the developers of this standard do not prioritise the rules. Furthermore, they recommend using these rules as guidelines and they mentioned that some rules have exceptions and should not be followed to the extreme. Although there has been developed a dedicated rule checker called semmle static analyser which implements the rules of JPL standard. This research experiments used FindBugs, PMD and CheckStyle rules checkers due to these reasons: (1) Those static analysers are well known and widely used by Java community. (2) Those static analysers are recommended by the authors of JPL standard as alternatives for semmle static analyser. (3) The semmle static analyser is a commercial tool. JPL standard’s rules are presented in Table 1 with their inspection possibility by the static analysers used in this study. Since the aim is to empirically study the relationship between coding standard’s rules violations and faults at the granular level of classes, this study ignores the JPL standard’s rules that are targeted towards higher levels such as packages or systems as a whole. Such ignored rules are marked with a single asterisk (*) symbol in Table 1. Some other rules are ignored due to the lack of support for such rules by the used static analysers. Those rules are marked with double asterisks (**) in Table 1. This means that among the 53 rules of the underlying standard, 43 rules are checked, which means almost 82% coverage of the JPL standard. IV.
CODING STANDARD’S VIOLATIONS-BASED METRICS
Coding standards violations-based metrics are suite of metrics computed using the data collected from the software source code artefacts by means of some tools called static analysers. Among the functionalities provided by such tools is coding rules violations detection. Those tools inspect the source code looking for the violations of coding standard’s rules. The coding standard’s violations-based metrics can be defined at the standard’s level, category’s level or at the rule’s level. These metrics can also be gathered at different granularity levels such as line’s level, method’s level, class’s level, package’s level or system’s level. In this research, we defined and gathered these metrics at the class level. Reviewing the research works that have been done in the literature, it was found that almost all previous research works used metrics based on the total number of violations and violations density. Those metrics used in the literature suffer from many limitations such as, the lack of distinguishing between violations diversity at the standard level, the lack of distinguishing between violations diversity at the category level, the lack of distinguishing between categories of violations and the lack of distinguishing between violations severity.
152 | P a g e www.ijacsa.thesai.org
(IJACSA) International Journal of Advanced Computer Science and Applications, Vol. 8, No. 5, 2017
Process
Names
Packages, Classes and Interfaces
Fields
Methods
Declarations and Statements
Expressions
Exceptions
Types
Concurrency Complexity
JPL Rule
“R01: compile with checks turned on.” * “R02: apply static analysis.” * “R03: document public elements.” “R04: write unit tests.” * “R05: use the standard naming conventions.” “R06: do not override field or class names.” “R07: make imports explicit.” “R08: do not have cyclic package and class dependencies.” * “R09: obey the contract for equals().” “R10: define both equals() and hashCode().” “R11: define equals when adding fields.” “R12: define equals with parameter type Object.” “R13: do not use finalisers.” “R14: do not implement the Cloneable interface.” “R15: do not call non-final methods in constructors.” “R16: select composition over inheritance.” ** “R17: make fields private.” “R18: do not use static mutable fields.” “R19: declare immutable fields final.” “R20: initialize fields before use.” “R21: use assertions.” “R22: use annotations.” “R23: restrict method overloading.”** “R24: do not assign to parameters.” “R25: do not return null arrays or collections.” “R26: do not call System.exit.” “R27: have one concept per line.” “R28: use braces in control structures.” “R29: do not have empty blocks.” “R30: use breaks in switch statements.” “R31: end switch statements with default.” “R32: terminate if-else-if with else.” ** “R33: restrict side effects in expressions.” “R34: use named constants for non-trivial literals.” “R35: make operator precedence explicit.” “R36: do not use reference equality.” “R37: use only short-circuits logic operators.” “R38: do not use octal values.” “R39: do not use floating point equality. “R40: use one result type in conditional expressions.” “R41: do not use string concatenation operator in loops.” “R42: do not drop exceptions.” “R43: do not abruptly exit a finally block.” “R44: use generics.” “R45: use interfaces as types when available.” “R46: use primitive types.” “R47: do not remove literals from collections.” ** “R48: restrict numeric conversions.” “R49: program against data races.” “R50: program against deadlocks.” “R51: do not rely on the scheduler for synchronization.” ** “R52: wait and notify safely.” “R53: reduce code complexity.”
The results of the static analysers’ inspection are violations reports for the coding rules whose equivalent or correspondent tools’ rules are turned on. The violations report contains information about the coding rule’s being violated in the inspected module such as the module name, the violated rule, and the code line number in which the rule is violated. The
FindBugs
JPL Category
CheckStyle
JPL STANDARD’S RULES WITH THEIR INSPECTION POSSIBILITY BY THE STATIC ANALYSERS
PMD
TABLE I.
√ √ √
√ √ √
√
√
√ √
√ √ √ √
√ √ √
√ √ √
√
√ √ √ √
√
√ √
√ √ √ √ √ √ √ √ √
√
√ √ √ √ √
√ √
√
√
√
√ √
√ √ √
√ √ √
√ √ √ √
√ √ √ √ √ √
√ √
√
√ √
√ √ √ √ √
violations report for each class is inserted into the violations database. At this point, the metrics values can be calculated and retrieved from the database by means of SQL queries. The following proposed metrics are derived according to the coding rules’ categorisation presented and adopted by the JPL coding standard.
153 | P a g e www.ijacsa.thesai.org
(IJACSA) International Journal of Advanced Computer Science and Applications, Vol. 8, No. 5, 2017
a) M1: The percentage of standard’s rules violated per class (PSRV). b) M2: The percentage of standard’s rules violated normalised by the class code size (PSRVD). c) M3: The percentage of category’s rules violated in a class. M3.1: The percentage of names category’s rules violated in a class (PNCRV).
being being being being
M3.2: The percentage of packages, classes and interfaces category’s rules being violated in a class (PPCICRV). M3.3: The percentage of fields category’s rules being violated in a class (PFCRV). M3.4: The percentage of methods category’s rules being violated in a class (PMCRV). M3.5: The percentage of declarations and statements category’s rules being violated in a class (PDSCRV).
M4.7: The percentage of exceptions category’s rules being violated in a class normalised by the class code size (PExcCRVD). M4.8: The percentage of types category’s rules being violated in a class normalised by the class code size (PTCRVD). M4.9: The percentage of concurrency category’s rules being violated in a class normalised by the class code size (PConCRVD). M4.10: The percentage of complexity category’s rules being violated in a class normalised by the class code size (PComCRVD). e) M5: The percentage of standard’s categories being violated in a class (PSCV). f) M6: The percentage of standard’s categories being violated in a class normalised by the class code size (PSCVD). V.
EXPLORATORY STUDY
M3.6: The percentage of expressions category’s rules being violated in a class (PExpCRV).
This section describes the conducted exploratory study and reports its findings.
M3.7: The percentage of exceptions category’s rules being violated in a class (PExcCRV).
A. Evaluated Systems The coding standards violations-based metrics were collected from six open source software systems: (1) Ant-1.7.0, (2) Apache-Camel-1.6.0, (3) Poi-3.0, (4) Synapse-1.2, (5) Velocity-1.6.1, and (6) Xalan-2.6.0. All systems are long-lived, of reasonable size in terms of the number of classes, and from different application domains. Working on long-lived systems prevents results from being biased by the potential data fluctuations experienced during short period of time [11]. Additionally, selecting a bigger set of systems from different domains makes the obtained findings more generalisable. Furthermore, investigating reasonable-size systems in terms of the number of classes increases the number of data points which is considered a good feature for statistical analysis [12]. Some descriptive statistics about the evaluated systems are reported in Table 2. As shown in the table, each system has different code size, different numbers of classes and faults, and percentages of faulty classes.
M3.8: The percentage of types category’s rules being violated in a class (PTCRV). M3.9: The percentage of concurrency category’s rules being violated in a class (PConCRV). M3.10: The percentage of complexity category’s rules being violated in a class (PComCRV). d) M4: The percentage of category’s rules being violated in a class, normalised by the class code size. M4.1: The percentage of names category’s rules being violated in a class normalised by the class code size (PNCRVD). M4.2: The percentage of packages, classes and interfaces category’s rules being violated in a class normalised by the class code size (PPCICRVD). M4.3: The percentage of fields category’s rules being violated in a class normalised by the class code size (PFCRVD). M4.4: The percentage of methods category’s rules being violated in a class normalised by the class code size (PMCRVD). M4.5: The percentage of declarations and statements category’s rules being violated in a class normalised by the class code size (PDSCRVD). M4.6: The percentage of expressions category’s rules being violated in a class normalised by the class code size (PExpCRVD).
TABLE II. System Name Synapse1.2 Velocity1.6.1 Poi3.0 Xalan2.6.0 Camel1.6.0 Ant1.7.0
DESCRIPTIVE STATISTICS OF THE EVALUATED SYSTEMS
System Code Size (LOC)
Fault Count
Number of Classes
Number (Percentage) of Faulty Classes
19554
145
256
86 (33.98%)
25241
190
229
78 (34.06%)
51402
500
439
281 (63.43%)
151485
625
885
411 (46.44%)
56444
500
933
188 (20.15%)
87741
338
745
166 (22.28%)
154 | P a g e www.ijacsa.thesai.org
(IJACSA) International Journal of Advanced Computer Science and Applications, Vol. 8, No. 5, 2017
B. Data Collection To calculate the coding standards violations-based metrics, three static analysis tools called (1) FindBugs 2.0.3, (2) PMD 5.0.2, and (3) CheckStyle 5.6.1 were used. These tools are popular and widely used for inspecting Java source code. They are powerful, yet intuitive and easy to use. These tools can be used in three different ways: (1) as a command line, (2) an Eclipse plugin or (3) an Ant target element with almost any operating system platform. FindBugs and PMD provide an extra feature in which users can export the violations reports into an XML or Excel files for further processing. However, to the best of our knowledge, CheckStyle lacks such feature which in turn imposes manual processing for its generated reports. Furthermore, all of these three tools provide some sort of severity for their rules or checks. Unfortunately, some conflicts are found between the prioritisation of equivalent rules of these tools. These conflictions in severity of tools’ rules was the reason behind discarding rules’ severity to be one of this research objectives in which the JPL standard’s rules will be prioritised from the point of view of fault density. These tools also enable users to configure their inspection according to the adopted coding standard, bugs patterns or bad practices they looking for. Since the underlying coding standard of this study was JPL coding standard for Java programming language, the experiments’ settings enabled totally 176 rules from different categories of rules for each tool. From the totally enabled rules, the tools’ portions was 55, 73, 48 rules for FindBugs, PMD and CheckStyle, respectively. Another important point that deserves to be mentioned here is, although each tool has its own categorisation for its rules, this research ignored these categorisations and adopted the categorisation provided by the JPL coding standard. For the coding standards violations-based metrics to be collected, the analysis and report were focused on the tools being used from the Eclipse plugin. The plugin for each tool comes with its own perspective. Since both CheckStyle and PMD works only on source code (not byte code), the Java open source projects were imported into the eclipse to be analysed by CheckStyle and PMD. The generated violations reports by both tools were then inserted into the coding rules violations database using the developed tool for further analysis. Regarding FindBugs, instead of importing the source code from of the systems under study, the executable forms (.Jar) of the systems were imported into the Eclipse to be analysed by FindBugs because it works only on the Byte code (not source code). The generated violations report was then inserted into the coding rules violations database for the purpose of doing further analysis. Having all generated coding standard violations data in the database, the coding standards violationsbased metrics can be retrieved as SQL queries for each class of each open source project. At this point, the coding standards violations-based metrics data were then plugged into MS Excel sheets for further analysis. The faults data for each class of the systems under study was collected from the PROMISE software engineering repository [13]. Additionally, the class code size data extracted
by the understand tool was used to calculate the faults density in each class of the target set of systems. The density data for each class was then combined with the coding standard violations-based metrics data and plugged into CSV file format. Each class in the CSV file represents a data point or observation. C. Results and Analysis The obtained results from this conducted exploratory study are reported and analysed next. 1) Principal Component Analysis Principal component analysis (PCA) refers to the process by which principal components (PCs) are computed for the subsequent use of these components in understanding the data [14]. In other words, PCA is a standard technique to derive a small number of linear combinations (principal components) of a set of variables that retain as much of the information in the original variables as possible. If a group of variables in a data set are strongly correlated, these variables are likely to measure the same underlying dimension. The sum of the squares of the coefficients of the standardised variables in one linear combination is equal to one. In order to identify these variables, and interpret the PCs, the rotated components are considered. As the dimensions are independent, orthogonal rotation is used. There are various strategies to perform such rotation. This research used the Varimax rotation, which is the most frequently used strategy in literature [15]. The PCA results are presented in Table 3, which indicate that the dimensions captured by the coding standard violationsbased metrics can be classified into the below mentioned dimensions: standard’s rules and categories, naming rules, classes and interfaces rules, fields rules, methods rules, types rules, declarations and statements rules, expressions rules, exceptions rules, concurrency rules, and complexity rules. These dimensions reflect the standard rules’ categories which the metrics are derived from. The results in Table 3 show some overlapping among these dimensions. For example, some metrics were expected to fall into a certain dimension; however, they fall into other dimensions. The general observation is that metrics which were found to be significant are falling in the first two components in almost all case studies which in turn reflect the importance of these metrics. For instance, the metrics PSRV and PSCV in all case studies fall into the first or the second component. Additionally, it is clear from Table 3, that except for the first two components, each component corresponds to one dimension. For example, in Camel case study system, the PC3, PC4, PC5, PC6, PC7 and PC8 correspond to expression rules dimension, exceptions rules dimension, fields rules dimension, methods rules dimension, declarations and statements rules dimension, packages and classes rules dimension, types rules dimension, and complexity rules dimension, respectively. 2) Bivariate Correlation Analysis To explore the relationship between each metric in the coding standard violations-based suite and the fault density, Spearman correlation analysis technique was performed. First, the Spearman correlation coefficient was calculated between each metric and the variable capturing the density of faults
155 | P a g e www.ijacsa.thesai.org
(IJACSA) International Journal of Advanced Computer Science and Applications, Vol. 8, No. 5, 2017
which defined as the number of faults in a class divided by the class code size in terms of KLOC (excluding comments and blank lines). For each system from the target set of systems TABLE III. System
Ant
Velocity
Synapse
Poi
Xalan
Camel
PC1 PSRV PNCRV PFCRV PExpCRV PSCV PSRV PNCRV PFCRV PComCRV PSCV PSRVD PNCRVD PSCVD PSRVD PNCRVD PSCVD
PSRV PMCRV PDSCRV PExpCRV PComCRV PSCV PSRVD PNCRVD PSCVD
under study, the correlation values were obtained from the data of all system’s classes.
PCA OF CODING STANDARD’S VIOLATIONS-BASED METRICS
PC2 PSRVD PNCRVD PSCVD
PC3 PConCRV PConCRVD
PC4 PPCICRV PPCICRVD
PC5 PMCRV PMCRVD
PC6 PExcCRV PExcCRVD
PC7 PTCRV PTCRVD
PC8 PDSCRV PDSCRVD
PSRVD PNCRVD PFCRVD PComCRVD PSCVD PSRV PNCRV PFCRV PSCV PSRV PNCRV PFCRV PFCRVD PSCV PSRVD PExpCRVD PSCVD
PTCRV PTCRVD
PMCRV PMCRVD
PExcCRV PExcCRVD
PPCICRV PPCICRVD
PExpCRV PExpCRVD
PDSCRV PDSCRVD
PFCRVD PTCRV PTCRVD
PExcCRV PExcCRVD
PMCRV PMCRVD
PDSCRV PDSCRVD
PExpCRV PExpCRVD
PPCICRV PPCICRVD
PComCRV PComCRVD
PDSCRV PDSCRVD
PPCICRV PPCICRVD
PMCRV PMCRVD
PExcCRV PExcCRVD
PExpCRV PExpCRVD
PComCRV PComCRVD
PTCRV PTCRVD
PExcCRV PExcCRVD
PConCRV PConCRVD
PPCICRV PPCICRVD
PTCRV PTCRVD
PDSCRVD PComCRVD
PFCRV PFCRVD
PMCRVD
PNCRV PNCRVD
PSRV PNCRV PSCV
PExpCRV PExpCRVD
PExcCRV PExcCRVD
PFCRV PFCRVD
PMCRV PMCRVD
PDSCRV PDSCRVD
PPCICRV PPCICRVD
PTCRV PTCRVD
PComCRV PComCRVD
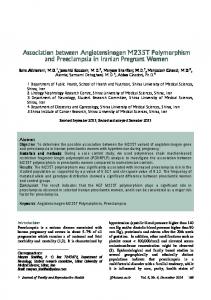
The results of correlation coefficients and p-values using Spearman’s technique are presented in Table 4. For each metric, the significance of correlation was tested at 0.05 level of significance. The values that are rendered in boldface highlights significant correlation coefficients at 0.05 level as shown in Table 4. It is clear to observe that PSRV, PNCRV, PExpCRV and PSCV were found to be significantly correlated with the fault density of classes across all the systems under study. Regarding the rest of metrics, the correlation analysis results show that PSCVD was found to be significantly correlated with fault density in all systems except Camel system. In addition, the correlation analysis results also show that PFCRV, PComCRV, PPCICRVD, PDSCRV, PDSCRVD, PNCRVD, PFCRVD, PPCICRV, PExcCRV, PExcCRVD, PTCRV, PTCRVD and PComCRVD were found to be significantly correlated with fault density in two, three or four systems from the target set of systems under study. Furthermore, the correlation analysis results show that PMCRV and PMCRVD were found to be significantly correlated with fault density only in Ant system. Figure 1 ranks the metrics based on the number of systems in which they are significantly correlated with fault density. The differences in the significance of correlation across the systems under study can be explained as: The class code size in terms of lines of code (LOC without comments and blank lines) is a dominant factor which has a great impact on the number of introduced violations for coding standard’s rules in addition to the diversity of such introduced violations. So the differences in size across system’s classes might have an impact on the values of coding standard violations-based metrics which in turn, affect the correlation significance
PC9 PComCRV PComCRVD
PC10 PExpCRVD
PC11 PFCRVD
between the metrics under study and the fault density of classes.
Fig. 1. Metrics are ranked based on the number of systems in which they are significantly correlated with fault density.
156 | P a g e www.ijacsa.thesai.org
(IJACSA) International Journal of Advanced Computer Science and Applications, Vol. 8, No. 5, 2017 TABLE IV. Metric PSRV PSRVD PNCRV PNCRVD PPCICRV PPCICRVD PFCRV PFCRVD PMCRV PMCRVD PDSCRV PDSCRVD PExpCRV PExpCRVD PExcCRV PExcCRVD PTCRV PTCRVD PConCRV PConCRVD PComCRV PComCRVD PSCV PSCVD
Synapse Corr. p-value Coef. 0.0000 0.3355 0.0015 -0.1974 0.0044 0.1777 0.0130 -0.1551 0.0123 0.1563 0.0232 0.1419 0.0000 0.2988 0.0001 0.2486 0.0869 0.1656 0.0874 0.1631 0.1047 0.0945 0.1013 0.1059 0.0006 0.2138 0.0044 0.1776 0.0391 0.5331 0.0396 0.5279 0.0042 0.1785 0.0040 0.1794
0.1434 -0.0605 0.3221 -0.2185
0.0217 0.3346 0.0000 0.0004
Velocity Corr. p-value Coef. 0.0021 0.2024 0.0180 -0.1563 0.0038 0.1903 0.0195 0.7693 0.0341 0.6074 0.0312 0.6384 0.1062 0.1089 0.0649 0.3281 0.0510 0.4423 0.0499 0.4519 -0.0386 0.5615 -0.0543 0.4134 0.0458 0.1321 0.1062 0.1089 0.1248 0.0592 0.1250 0.0590 0.0872 0.1887 0.0883 0.1830
Corr. Coef. 0.2371 0.1406 0.1514 0.0842 0.0660 0.0238 0.0412 0.0616 -0.0125 -0.0129 0.2773 0.2975 0.2565 0.2929 0.0286 0.0287 0.0260 0.0239
0.0065 0.0615 0.0015 0.0338
-0.0702 -0.0818 0.2579 0.1277
0.1795 0.1238 0.2081 -0.1403
TABLE V. Metric PSRV PSRVD PNCRV PNCRVD PPCICRV PPCICRVD PFCRV PFCRVD PMCRV PMCRVD PDSCRV PDSCRVD PExpCRV PExpCRVD PExcCRV PExcCRVD PTCRV PTCRVD PConCRV PConCRVD PComCRV PComCRVD PSCV PSCVD
SPEARMAN CORRELATION RESULTS Poi p-value 0.0000 0.0032 0.0015 0.0779 0.1675 0.6196 0.3895 0.1973 0.7932 0.7870 0.0000 0.0000 0.0000 0.0000 0.5507 0.5489 0.5870 0.6181
0.1417 0.0869 0.0000 0.0074
Camel Corr. p-value Coef. 0.0000 0.1620 0.0385 0.2402 0.0008 0.1095 0.0137 0.0806 0.0354 0.2804 0.0346 0.2912 0.0001 0.1268 0.0004 0.1152 0.0551 0.0924 0.0548 0.0943 0.0304 0.3539 0.0226 0.4899 0.0001 0.1319 0.0002 0.1203 0.0202 0.0760 0.0202 0.0760 0.0015 0.9639 0.0015 0.9624
0.1025 0.0684 0.1677 0.0261
0.0017 0.0367 0.0000 0.4260
Ant Corr. p-value Coef. 0.0000 0.3976 0.0000 -0.2126 0.0000 0.3124 0.0001 -0.1407 0.0000 0.2141 0.0000 0.1968 0.0000 0.3075 0.0113 0.0930 0.0000 0.2647 0.0000 0.2533 0.0000 0.1899 0.0009 0.1215 0.0000 0.3398 0.0000 0.1741 0.0001 0.1435 0.0001 0.1425 0.0000 0.2285 0.0000 0.1836 -0.0195 0.5953 -0.0195 0.5953 0.0000 0.2570 -0.0233 0.5263 0.0000 0.3822 0.0000 -0.2396
UNIVARIATE PREDICTION ACCURACY RESULTS
Synapse MAE RMSE 12.401 23.009 13.309 23.292 12.576 22.974 12.763 23.063 12.458 22.958 12.753 23.427 12.342 22.995 11.278 22.690 12.584 22.981 12.604 23.079 12.576 22.944 12.573 22.994 12.554 22.965 12.140 23.356 12.545 22.931 12.580 22.946 12.483 23.493 11.758 21.845
Velocity MAE RMSE 17.340 29.420 17.296 29.549 17.175 29.571 17.300 29.558 17.269 29.423 17.269 29.423 17.182 29.335 17.183 29.452 17.080 29.416 17.270 29.572 17.066 29.328 17.269 29.658 17.385 29.423 17.296 29.512 17.216 29.477 17.177 29.472 17.212 29.539 17.255 29.705
MAE 13.344 12.635 13.329 13.150 13.329 13.357 13.176 13.353 13.171 13.179 13.240 12.560 13.319 12.898 13.284 13.331 13.247 13.228
Poi RMSE 23.008 22.619 22.995 22.886 22.850 22.979 22.947 23.021 22.882 22.884 23.003 22.847 23.002 22.922 22.940 23.029 22.974 22.913
12.892 12.547 12.308 13.321
17.385 17.226 17.308 17.342
13.125 13.265 13.406 12.581
22.768 22.967 22.994 22.676
23.023 22.957 23.021 23.237
Xalan Corr. p-value Coef. 0.0002 0.1275 0.0018 -0.1055 0.0000 0.1553 0.0088 0.7958 0.0025 0.1022 0.0051 0.0945 0.0298 0.3790 -0.0060 0.8593 0.0395 0.2427 0.0365 0.2806 0.0017 0.1060 0.0433 0.2007 0.0328 0.0722 0.0487 0.1499 -0.0647 0.0557 -0.0637 0.0596 0.0475 0.1608 0.0327 0.3337 0.0340 0.3151 0.0340 0.3148 0.0228 0.5012 0.0117 -0.0852 0.0001 0.1339 0.0052 -0.0945
29.521 29.610 29.451 29.541
Some common results can be observed from the evaluated systems. For example, the positive correlation between PSRV, PNCRV, PExpCRV, and PSCV metrics and the class fault density suggest that the higher values for these metrics, the more the faults density of the class. Additionally, it is observed that PConCRV and PConCRVD reported null p-values and correlation coefficients in Synapse, Velocity, Poi and Camel systems because of the zero values of all observations for these two metrics. This implies that either
Xalan MAE RMSE 10.655 19.307 10.561 19.653 10.579 19.560 10.500 19.357 10.469 19.513 10.540 19.587 10.612 19.394 10.565 19.516 10.533 19.510 10.571 19.598 10.613 19.409 10.554 19.591 10.493 19.378 10.541 19.557 10.514 19.543 10.547 19.571 10.554 19.533 10.544 19.589 10.548 19.565 10.564 19.583 10.400 19.151 10.521 19.519 10.586 19.296 10.569 19.756
Camel MAE RMSE 19.309 43.206 18.885 42.856 19.273 43.192 19.111 43.227 19.151 43.190 19.135 43.191 19.213 43.231 18.895 43.204 19.188 43.170 19.166 43.173 19.209 43.181 19.129 43.182 19.266 43.197 19.186 43.212 19.077 43.184 19.077 43.184 19.145 43.191 19.172 43.237
19.277 18.981 19.277 18.930
43.209 43.226 43.221 42.829
MAE 4.462 4.694 4.521 4.764 4.665 4.720 4.643 4.707 4.612 4.729 4.664 4.705 4.538 4.721 4.669 4.726 4.658 4.713 4.716 4.716 4.615 4.709 4.494 4.677
Ant RMSE 9.512 9.562 9.510 9.596 9.540 9.542 9.545 9.533 9.521 9.563 9.541 9.536 9.520 9.553 9.539 9.584 9.537 9.536 9.539 9.539 9.536 9.551 9.519 9.562
the classes of these systems do not violate any rules of the concurrency category or the systems nature is irrelative to parallelism and concurrency. Regarding Ant and Xalan systems, the correlation analysis shows that PconCRV and PConCRVD were found to be insignificantly correlated with fault density. By inspecting the observations of these two systems, only two observations in Xalan and one observation in Ant were found to violate the concurrency category which
157 | P a g e www.ijacsa.thesai.org
(IJACSA) International Journal of Advanced Computer Science and Applications, Vol. 8, No. 5, 2017
can be considered neglectable with contrast to 875 and 741 observations of Xalan and Ant, respectively. 3) Univariate Regression Analysis Univariate linear regression modelling [14] is a simple and useful technique for predicting a quantitative response. It is a straightforward technique for predicting a quantitative response Y (dependent variable) on the basis of a single predictor variable (independent variable) X. It is an approach for modelling the relationship between a scalar dependent variable Y and one explanatory variable denoted X by fitting a linear equation to the observed data. This research used univariate linear regression to model the relationship between each coding standards violations-based metric (independent variable) and the faults density (dependent variable). The predictive accuracy of the prediction models is evaluated using the mean absolute error (MAE) and the root mean squared error (RMSE). These two measures are based on what so called residual which is the difference between the predicted and the observed values. The results of the prediction accuracy were analysed in terms of these two measures. The lower values of these two measures are always better than the higher values. Additionally, the values of RMSE are always higher than MAE. Table 5 presents the results of the prediction accuracy for all linear regression models in all systems that were investigated by this study. It can be observed from Table 5 that the best accuracy results of the linear regression models were achieved in Ant system while the worst accuracy results were achieved in Camel system. It can be observed that all regression models, for each system, achieved very similar accuracy results. VI.
some metrics and fault density have been observed across all systems, and thus indicate that these metrics can be useful predictors for improved early estimation of faulty density of object-oriented classes. Future works include exploring the associations between coding standards and other software quality attributes, and also using the proposed metrics in addition to traditional product metrics to improve the accuracy of fault predictive models. [1] [2]
[3]
[4] [5]
[6]
[7] [8]
[9]
CONCLUDING REMARKS
This paper has reported an exploratory study that was conducted to investigate whether or not the violation of coding standard’s rules has a relationship with the fault density of classes in object-oriented software systems. The investigation scope was on the JPL coding standard. A set of 24 metrics were proposed to quantify the violations of coding standards. Data were collected from six open source software systems written in Java. Several statistical analysis techniques were performed on the collected data including principal components analysis, bivariate correlation analysis, and univariate regression analysis. The principle component analysis has shown that many of the proposed coding standard violations-based metrics fall into the first two components which in turn reflects the importance and diversity of these metrics. In addition, associations between
[10] [11]
[12] [13]
[14] [15]
REFERENCES S. Pfleeger, Software Engineering: The Production of Quality Software: Macmillan Publishing Company, 1991. C. Boogerd and L. Moonen, "Assessing the value of coding standards: An empirical study," in IEEE International Conference on Software Maintenance, 2008, pp. 277-286. C. Boogerd and L. Moonen, "Evaluating the relation between coding standard violations and faultswithin and across software versions," in 6th IEEE International Working Conference on Mining Software Repositories, 2009, pp. 41-50. K. Havelund and A. Niessner, "JPL Java Coding Standard," Technical Report, California Institute of Technology, 2010. MISRA, "MISRA-C:2004 Guidelines for the Use of the C Language in Critical Systems," Technical Report, Motor Industry Software Reliability Association (MISRA), 2004. W. Basalaj and F. v. d. Beuken, "Correlation Between Coding Standards Compliance and Software Quality," Technical Report, Programming Research, 2006. PRQA, "High Integrity C++ Coding Standard Manual," Technical Report, Programming Research, 2004. K. Kawamoto and O. Mizuno, "Predicting Fault-Prone Modules Using the Length of Identifiers," in 4th International Workshop on Empirical Software Engineering in Practice, 2012, pp. 30-34. M. Elish and J. Offutt, "The Adherence of Open Source Java Programmers to Standard Coding Practices," in 6th IASTED International Conference on Software Engineering and Applications, 2002, pp. 193-198. A. Reddy, "Java Coding Style Guide," Technical Report, Sun Microsystems, Inc., 2000. A. Koru and H. Liu, "Identifying and characterizing change-prone classes in two large-scale open-source products," Journal of Systems and Software, vol. 80, pp. 63-73, 2007. S. Boslaugh and P. Walters, Statistics in a Nutshell: A Desktop Quick Reference: O'Reilly Media, 2008. G. Boetticher, T. Menzies, and T. Ostrand, "PROMISE Repository of empirical software engineering data, http://promisedata.org/repository," West Virginia University, Department of Computer Science, 2007. G. James, D. Witten, T. Hastie, and R. Tibshirani, An Introduction to Statistical Learning with Applications in R: Springer, Inc., 2013. G. Dunteman, Principal Component Analysis: SAGE, 1989.
158 | P a g e www.ijacsa.thesai.org