2015 IEEE International Conference on Systems, Man, and Cybernetics
Asynchronous Decoding of Error Potentials During the Monitoring of a Reaching Task Jason Omedes
I˜naki Iturrate, Ricardo Chavarriaga
Luis Montesano
University of Zaragoza I3A, DIIS Zaragoza, Spain
[email protected]
Ecole Polytechnique F´ed´erale de Lausanne Chair in Non-Invasive Brain-Machine Interface (CNBI) Switzerland inaki.iturrate@epfl.ch, ricardo.chavarriaga@epfl.ch
University of Zaragoza I3A, DIIS Zaragoza, Spain
[email protected]
These demonstrations rely on progressive improvements in the decoding performance of brain signals used to perform this type of reaching tasks. However, every system developed so far has to deal with a significant failure rate, due to diverse factors such as high variability of brain signals, the complexity of the task or user mistakes. These misclassifications can lead, expectedly, to erratic behaviors of the device under these reaching tasks in different forms: at the beginning of a movement [7] by not detecting the intended initial user intention; or during the execution of the movement provoking a deviation of the device from the intended path [9], [10] among others.
Abstract—Brain-machine interfaces (BMIs) have demonstrated how they can be used for reaching tasks with both invasive and non-invasive signal recording methods. Despite the constant improvements in this field, there still exist diverse factors to overcome before achieving a natural control. In particular, the high variability of the brain signals often leads to the incorrect decoding of the subject intentions, producing unreliable behaviors in the controlled device. A possible solution to this problem would be that of correcting this erroneous decoding using a feedback signal from the user. In this work, we evaluate the possibility of decoding neural signals associated to performance monitoring (EEG-recorded error-related potentials) during a reaching task. Compared to previous works where these error potentials were recorded under scenarios with discrete movements performed by the cursor, under real conditions the cursor is moving continuously and thus the system is required to asynchronously detect any possible error. To this end, we simulated two different erroneous events during the monitoring of a reaching task: errors at the beginning of the movement, and errors happening in the middle of the trajectory being executed. Through the analysis of the recorded EEG of three subjects, we demonstrate the existence of neural correlates for the two types of elicited error potentials, and we are able to asynchronously detect them with high accuracies. Index Terms—Error Potentials, Brain-Machine Interfaces.
We hypothesize that decoding of neural signals associated to performance monitoring (error-related potentials), can provide a mean to improve or correct the misbehaviors introduced during the operation of the device. Error potentials have been shown to be elicited when the user’s expected and actual outcome of an action differ [11] and have already been used to correct the commands executed by a device, to adapt the classifier or as feedback for different devices (see [12] for a review). Up to far, these signals have been studied under wellcontrolled discrete setups, therefore their usability for reaching tasks is yet to be assessed. In particular given the fact that, during these tasks it is necessary to continuously decode error potentials in an asynchronous manner.
I. I NTRODUCTION In the last years, brain-machine interfaces (BMIs) have emerged as promising assistive systems for impaired people, demonstrating how they can be used to control virtual cursors, or real devices. On one hand, invasive techniques have shown that monkeys can learn to control the movement of computer cursors [1] and arm prostheses to solve reaching tasks [2]. Similarly, experiments in humans using invasive recordings have shown how these systems can be used to control real robotic arms for reaching and grasping tasks in activities of daily life [3], [4]. Despite having lower performances, reaching tasks have also been tackled with semi-invasive recoding techniques such as electrocorticography [5], and noninvasively with electroencephalography using motor imagery of body limbs [6] or slow cortical potentials among others [7], [8].
978-1-4799-8697-2/15 $31.00 © 2015 IEEE DOI 10.1109/SMC.2015.541
We tested the feasibility of decoding of error-related activity during a reaching task similar to those used in both invasive and non-invasive approaches. Here the subject monitors the actions of a device performing self-paced movements to reach a designated goal. We studied EEG activity elicited by erroneous device actions both at the beginning and during the execution of the trajectories. The analysis of the EEG signals of the three subjects that carried out the experiment revealed neural correlates of performance monitoring during the reaching task. Furthermore, we show that it is possible to classify the EEG signal asynchronously (i.e., using a sliding window) in order to detect erroneous device behaviors. 3116
a) SE
b) SC and ND
Participants were asked to evaluate the performance of the device movements by assessing whether the trajectories were correct or erroneous. In the presence of an error, participants were asked to press a button as soon as they were aware of it. This leads to two additional conditions, denoted error deviation with button (DEB), and start error with button (SEB). To analyze any possible contamination on the EEG due to pressing the button, 3 minutes of EEG signal were recorded before the experiment, where the subjects pressed the button at their own will in absence of any other stimuli. Finally, participants were also instructed to fixate their gaze and to restrict eye movements or blinks to the resting periods between trials.
c) SC and DE
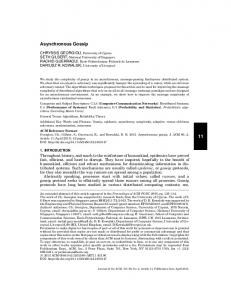
Fig. 1: Reaching task where a computer cursor (yellow) had to reach a designated goal (dark green) from one of the 8 possible targets (light green). The device could start each trial moving in the correct direction towards the goal or incorrectly towards one of the remaining targets (a). For those trials where the device started correctly, most of the time it would continue to the correct goal (b) but some others it could perform a sudden change in the trajectory towards an incorrect target (c).
B. Data Recording and Preprocessing Electroencephalographic (EEG) activity was recorded using a g.Tec g.USBamp system consisting of 60 electrodes placed according to the extended 10/20 international system, with the ground on FPz and the reference on the left earlobe; additionally, electrooculographic (EOG) activity was recorded using 3 monopolar electrodes (placed above the nasion, and below the outer canthi of the right and left eyes). EEG and EOG signals were digitized with a sampling frequency of 256 Hz and powerline notch filtered at 50 Hz. EEG data was spatially filtered using common-averagereference (CAR) and bandpass-pass filtered between 1 and 10 Hz using a zero-phase Butterworth filter of 4th order. Additionally, EOG contamination was removed from the EEG signal using a regression algorithm [13]. The resulting signal was visually inspected to detect and remove noisy channels. A z-score technique was used to automatically discard those trials with EEG values 3 times larger than the average.
II. M ETHODS A. Experimental Protocol Three healthy subjects (ages of 25, 23 and 23 years) participated in the study recorded in the University of Zaragoza after giving written consent. Volunteers were seated approximately one meter away from a computer screen where they visualized a 2D reaching task. The task consisted in a virtual device (ball) that moved to eight possible targets uniformly spaced around a 20 cm diameter circle, see Figure 1. We defined a trial as follows. First, one of the eight targets was highlighted representing the designated goal. Then, the ball moved from its current position following one of the next possible trajectories:: •
•
•
C. EEG Signal Analysis
Start error (SE): the ball moved in a straight line until it reached a different target from the designated goal, (Fig. 1a). Start correct (SC) and no deviation (ND): The ball began its movement in direction towards the designated goal until it reached its location (Fig. 1b). Start correct (SC) and deviation error (DE): The device started as in the previous case, but at a random point between the 40% and 60% of the trajectory, the device suddenly deviated towards one of the wrong targets (Fig. 1c).
Firstly, signal was analyzed by means of their grand averages. To this end, data was epoched using a time window from −200 to 1000 ms time-locked to the onset of the event. For SE and SC events, the onset corresponded to the instant when the device began the movement. For DE events, the onset was fixed at the deviation time. Onsets for ND events were chosen randomly throughout the trajectory to be used as a control condition. Additionally, we also analyze the EEG activity linked to the user response (DEB and SEB conditions). For this purpose, epochs with erroneous movements were also defined by aligning them to the button onset. This allowed to characterize the erroneous events according to their reaction time (i.e. elapsed time from the presentation of the visual stimuli and the subject pressing the button). EEG epochs were averaged for all participants at channel FCz [14] and compared pair-wise across conditions. Topographic interpolations of the signals as well as discriminability tests were also analyzed.
There was an equal probability (50%) for the device to perform a correct or an erroneous start (SC vs SE). For those movements were the device started correctly, there was a 30% of deviating from the current trajectory (DE). The duration of each movement lasted on average 4.32 ± 0.71 seconds with a resting period between trials of 3 seconds. The protocol was recorded in one session of about 2 hours including the set-up. The session was organized in 12 blocks of 40 trials, with a break of few minutes between blocks. A total of 240 start correct, 240 start error and 75 error deviation trials per participant were recorded. Trials were balanced pseudorandomly within each block.
D. Feature extraction and classification This work analyzes the possibility of classifying, at a single-trial level, the existence or not of erroneous movements
3117
SC
SE
Classifier output
EEG signal
ND
ND
(Pz, CPz, Cz, FCz)
ND
SE
DE
SC
0
1
2
3
0
1
2
3
0
1
3
2
0
1
2
3
time (seconds)
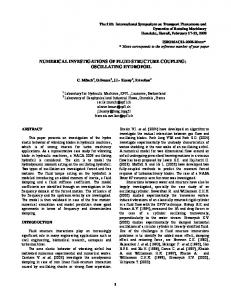
Fig. 2: Real example (channels Fcz, Cz, CPz and Pz) extracted from data of one of the subjects, depicting different possible outcomes of classification when using the sliding window. Blue lines represented the duration of each trial. From left to right: Trial starting with a SC event and no further deviations. Trial starting with SE event which is properly detected. Trial starting with SC and an DE which also is properly identified. Lastly, trial starting with SE event not detected by the classifier, and a misdetection of an error when the device was not performing any event.
performed by the device. Two different tests were performed: pairwise classification between different types of events; and a sliding window approach to detect the erroneous event asynchronously. We used a combination of temporal and frequency features extracted from the four most relevant common spatial patterns (CSPs) [15]. Temporal features were extracted as EEG voltages within a one-second window of the extracted epochs downsampled to 64 Hz, forming a vector of 256 features. For the frequency features, the power spectral density (PSD) was computed in the same time window using the Welch’s method with a Hamming window and a window overlap of 250 ms. Frequency features corresponded to the power values from the theta band ([4, 8] Hz) ± 1 Hz leading to a vector of 28 features. Finally, both sets of features were concatenated and normalized to the range [0, 1]. Features were used to train a support vector machine (SVM) classifier with a radial basis function (RBF) kernel [16]. All parameters (including EOG regression coefficients, CSPs and normalization values) were computed using only the training datasets. The minority class of the training set was oversampled to match the number of trials of the majority class to avoid SVM sensitivity to imbalanced datasets [17].
classifier, the test set was used to continuously evaluate the trained classifier with a sliding window of one second length, and steps of 62.50 ms. Performance is reported in terms of the number of correctly classified trials. We considered a trial was properly classified when error events were detected in a lapse of time of 1200 ms from the occurrence of the error, and no errors were detected during the rest of the movement. Any other possibility was considered as a misclassification (see Figure 2). III. R ESULTS A. EEG signal analysis Figure 3 shows the pairwise comparisons of the ERP grand averages. Regarding to the two possible situations at the starting of a movement (i.e., SE and SC), Fig. 3a shows that both elicit a potential characterized by a small positivity around 350 ms after the onset of the event, followed by a narrow deflection centered at 420 ms for the case of the SC event and a wider negativity extended from 400 to 600 ms for the SE events. These peak activities showed statistically significant differences (Bonferroni corrected unpaired t-test, p < 0.05). These differences are also reflected in the r2 value that reaches a maximum value at 550 ms. Figure 3b displays the grand averages ERP after DE events. They are characterized by a pronounced tri-phasic modulation, with a positive peak at 180 ms, followed by a negativity and another positive peak at 230ms and 300ms, respectively. A broader negative deflection then appears from 350ms to 600 ms. As expected, both the statistical test and the r2 metric highlight the ERP differences at these peaks. The right column of Figure 3 compares the two error conditions according to using the visual or button onset (i.e., SE/SEB and DE/DEB). First, when the epochs are aligned to the visual onset of the events (Fig 3c) clear differences are observed between the two type of errors, with ERPs after DE events having significantly larger amplitudes than
E. Classification evaluation The pairwise comparison in this protocol was performed in the time-locked epochs (i.e. in a synchronous manner). In this sense, for every pair of conditions defined in section II-C (SE vs SC, DE vs ND, SE vs DE, and SEB vs DEB) a 4-fold chronological cross-validation was computed, being each fold represented by 3 blocks of 40 trials each. Test of the asynchronous detection (i.e. sliding window) focused on decoding error (SE and DE) events from the background EEG (considered to be composed by SC and ND events). To this end, the data were split into a training set of 9 blocks and a test set of 3 blocks. After training the two-class
3118
SE
1
2
ED
1
2
FCz
1
2
1
15
SE SC
1 0 -1 -2
SE
2
FCz
1
DE SE
5 0 -5
2
-10
2
-3
2
1
10
Amplitud (μV)
Amplitud (μV)
3
SC
-15
-200
0
200 400 Time (ms)
600
800
-200
0
200 400 Time (ms)
(a) SC vs SE
600
800
(c) SE vs DE
DE
DEB
ND
5
SEB
0 1
15
FCz
1
2
1
9
DE ND
1
Amplitud (μV)
10
Amplitud (μV)
2
5 0 -5
2
-10
-200
1
2
FCz
-5 DEB SEB
6
1
3 0 -3 -6
-15
2
2
-9
0
200 400 Time (ms)
600
800
-500
(b) ND vs DE
0.1
-300
-100 100 Time (ms)
300
500
0
(d) SEB vs EDB
Fig. 3: Electrophysiology analysis for the different conditions. Time-locked grand averages on channel FCz. Black dotted markers at the bottom of each plot represent the time samples which amplitudes had a statistical difference between conditions (Bonferroni corrected unpaired t-test, p < 0.05). The bottom part of each plot shows the r2 discriminability test between conditions, where darker colors indicate larger differences. Scalp topographic maps at the most relevant peaks (higher r2 ) for both conditions are displayed on top.
pendent of the moment where the subject pressed the button. This peak could also be observed in the grand average (Fig 3a), probably related to the stimulus perception. A later negative and positive ERP components of the potentials appear to be correlated to the moment in which the subject pressed the button, most likely linked to the cognitive monitoring and decision making of the task. These results coincided to those obtained by Gerson et al. [18] in RSVP protocols where they found a shift in the ERP activity that correlates with the response time. In our case, the reaction time for each subject was 603.75±308.35 ms , 877.7±388.1 ms and 567.39±220.25 ms for subjects 1, 2 and 3 respectively.
the SE condition. However, the response-locked ERPs, i.e. when he/she pressed the button (Fig 3d), for both conditions show a negative modulation peaking at 100 ms after the button press. This effect is due to a higher variance on the latency in which the subjects perceive the SE events compared to DE. Since the onset related to the start of a movement is unknown, the subject may not be attentive. However, once the cursor is moving, the subject knows that she has to pay attention for possible deviations. Subjects took more time on average to perceive the errors at the beginning of the movement. Furthermore, their reaction times were more variable during the SE condition, reaching the extreme case of taking more than 1.5 seconds before pressing the button compared with the average of 300 ms for the DE events.
In a similar way, the potentials elicited by the DE events presented three stimulus-locked peaks (positive at 180 ms, negative at 230ms and positive at 300ms) before the button press, also seen in Fig 3b. The magnitude of these peaks was about three times larger than for the SE events and the subjects were aware of them more quickly, being the time responses of 344.66±116.2 ms, 425.94±113.4 ms and 404.43±93.6 ms. As before, ERP modulations after the button press, ranging
To further compare the two types of errors, Figure 4 shows single-trial activity for FCz electrode in both error conditions ordered according to the reaction time, and the randomly button press. SE events for the three subjects elicit a stimuluslocked positive modulation around 350 ms, seemingly inde-
3119
Subject 1
Subject 2
Subject 3
TABLE I: Pairwise time-locked classification accuracy
10
Trials
200 150 0
Class1: Class2: Class1: Class2: Class1: Class2: Class1: Class2:
100 50
-200
0
200 400 600 Time (ms)
800 1000 -200
0
200 400 600 800 1000 -200 Time (ms) (a) Start Error
0
200 400 600 Time (ms)
800 1000
-10
10
70
Trials
50 0 30
SE SC DE ND DE SE DEB SEB
Acc Class1
Acc Class2
Mean
81.52%
53.76%
67.55%
98.44%
87.03%
92.74%
98.08%
75.19%
86.64%
95.83%
57.41%
76.62%
10
-200
0
200 400 600 Time (ms)
800 1000 -200
0
200 400 600 800 1000 -200 Time (ms) (b) Deviation Error
0
200 400 600 Time (ms)
800 1000
-10
of the trajectories were properly decoded. Looking at the trials where the device started correctly but a deviation error was introduced, the 81.48% of the errors were successfully decoded, in a 12.96% of the cases the classifier identified a false positive before the error occurred, and only in a 5.56% of the trajectories the errors were not recognized. Lastly, for the movements in which the device started in the wrong direction, 66.66% of the times the classifier was able to detect the error, in a 27.5% of the cases there were no detections at all and in the remaining 5.84% there was at least a false positive. Notice the increased difficulty of the continuous decoding of the EEG signal, given its oscillatory behavior that often resemble the pursued temporal patterns. Studying in detail the error events that were not properly classified we found that the reaction time of the DE not identified by the sliding window was 515±187.62ms whereas the average reaction time for the events correctly detected was 357.42±64.72ms. In the same way, the SE not identified had a reaction time of 703.83±234 ms in contrast with the average of 620.16±232 ms of the detected events. As seen in section III-A there exist variations in the latency, specially for SE events that could affect the classification process. For example, assigning labels (e.g. label error) to a portion of signal that might not have the desired features. In particular, taking into account that features used for classifier training were extracted from stimulus-locked epochs.
10
Trials
30 20
0
10
-200
0
200 400 600 Time (ms)
800 1000 -200
0 200 400 600 800 1000 -200 Time (ms) (c) Random Button Press
0
200 400 600 Time (ms)
800 1000
-10
Fig. 4: Single-trial activity (FCz electrode) for SE events (a), DE events (b), and random press of the button (c), ordered from fastest to lowest reaction time for each subject. The vertical line (t=0) represents the time of the event onset, whereas the curved black line depicts the time of the users response (button press). EG signal is color coded from blue to red corresponding to the range [-10 10]μV , respectively.
from 400 to 600 ms, correlate to the time response, despite slight variations for each subject. Lastly, Fig 3c displays the activity generated after the button was pressed in absence of any stimuli. Here, even though the data seems to follow some kind of pattern it does not match with the modulations generated during error evaluation plus its magnitude is much inferior. B. Classification Table I depicts the pair-wise classification accuracy in single trial. On average, it was possible to correctly detect whether the device started a movement in the wrong direction the 67.6% of the times. In the same way, the results clearly show that is possible to detect DE events with a very high accuracy of 92.74%. Comparison between the two type of error events, shows that it is possible to discriminate between the two of them (SE vs DE). However, it was interesting to notice that aligning the potentials to the visual stimuli leaded to an average increase of 10% in the detection accuracy over aligning them to the button press (SEB vs DEB). All these results are in line with state of the art studies that deal with error potential classification [14]. Regarding to the asynchronous detection of error events through the usage of a sliding window, results are depicted in Table II. An average of 72.33% of the trajectories were correctly classified. In particular, for those trials in which the device started the movement towards the desired goal and it followed its path without any disruption, only in 31.16% of the cases the classifier would detect a false positive (identify an error when there is none) whereas the 68.84%
TABLE II: Trajectory characterization according to their asynchronous classification Type SC+ND SC+ED SE Total
Correct 68,84% 81,48% 66,66% 72,33%
False Positive Not Detected 31,16% – 12,96% 5,56% 5,84% 27,5% 27,67%
IV. C ONCLUSIONS AND FUTURE WORK This work studies the possibility of decoding neural signals associated to performance monitoring during a reaching task. For this purpose, we designed an experimental protocol where a device was executing self-paced movements to reach a designated goal. During the execution of the trajectories two types of error events were introduced. Errors at the beginning of the movement, representing the incorrect decoding of the desired action to execute; and errors in the middle of a trajectory that correspond to sudden deviations from the expected path.
3120
EEG analysis of three subjects have shown that both types of error events elicit discriminable potentials. Although these potentials share various similarities, the signal evoked by the errors introduced during the middle of a trajectory showed higher magnitude and a more consistent response by the users. Features from the temporal and frequency domain can be used asynchronously to distinguish error events from the background EEG signal with accuracies over 70%. These results support the possibility of incorporating the decoding of these error potentials as a complementary feature during the use of BMI-controlled devices for reaching tasks. Importantly, error-related signals are not only present in EEG, but several works have shown their existence also in semiinvasive [19] and invasive recording methods [20]. As future work, it is still pending to test the proposed results with a larger pool of subjects, and the feasibility of decoding this signal with closed-loop experiments. As a natural next step, the proposed system will be tested in a hybrid approach where a 2D cursor is controlled via a BMI and its behavior will be corrected via the feedback obtained from the decoding of these error potentials.
[12] R. Chavarriaga, A. Sobolewski, and J.d.R. Mill´an. Errare machinale est: the use of error-related potentials in brain-machine interfaces. Frontiers in neuroscience, 8, 2014. [13] A. Schl¨ogl, C. Keinrath, D. Zimmermann, R. Scherer, R. Leeb, and G. Pfurtscheller. A fully automated correction method of EOG artifacts in EEG recordings. Clinical neurophysiology, 118(1):98–104, January 2007. [14] R. Chavarriaga and J.d.R. Mill´an. Learning from EEG error-related potentials in noninvasive brain-computer interfaces. IEEE Trans Neural Syst Rehabil Eng, 18(4):381–388, 2010. [15] G. Dornhege. Speeding up classification of multi-channel braincomputer interfaces: Common spatial patterns for slow cortical potentials. IEEE EMBS Conference on Neural Engineering, pages 595–598, 2003. [16] F. Lotte, M. Congedo, A. L´ecuyer, F. Lamarche, and B. Arnaldi. A review of classification algorithms for EEG-based brain-computer interfaces. J Neural Eng, 4(2):R1–R13, June 2007. [17] R. Akbani, S. Kwek, and N. Japkowicz. Applying support vector machines to imbalanced datasets. In Proceedings of the 15th European Conference on Machine Learning (ECML), pages 39–50, 2004. [18] AD. Gerson, LC. Parra, and P. Sajda. Cortical origins of response time variability during rapid discrimination of visual objects. Neuroimage, 28(2):342–353, 2005. [19] T. Milekovic, T. Ball, A. Schulze-Bonhage, A. Aertsen, and C. Mehring. Error-related electrocorticographic activity in humans during continuous movements. Journal of neural engineering, 9(2):026007, 2012. [20] B. Mahmoudi and JC. Sanchez. A symbiotic brain-machine interface through value-based decision making. PloS one, 6(3):e14760, 2011.
V. ACKNOWLEDGMENTS This work has been supported by Spanish projects DPI20112589, DGA-FSE (grupo T04) and by Swiss NCCR ”Robotics”. R EFERENCES [1] MD. Serruya, NG. Hatsopoulos, L. Paninski, MR. Fellows, and JP. Donoghue. Brain-machine interface: Instant neural control of a movement signal. Nature, 416(6877):141–142, 2002. [2] JK. Chapin, KA. Moxon, RS. Markowitz, and MA. Nicolelis. Real-time control of a robot arm using simultaneously recorded neurons in the motor cortex. Nature neuroscience, 2(7):664–670, 1999. [3] LR. Hochberg, D. Bacher, B. Jarosiewicz, NY. Masse, JD. Simeral, J. Vogel, S. Haddadin, J. Liu, SS. Cash, P. van der Smagt, et al. Reach and grasp by people with tetraplegia using a neurally controlled robotic arm. Nature, 485(7398):372–375, 2012. [4] JL. Collinger, B. Wodlinger, JE. Downey, W. Wang, EC. Tyler-Kabara, DJ. Weber, A.JC. McMorland, M. Velliste, ML. Boninger, and AB. Schwartz. High-performance neuroprosthetic control by an individual with tetraplegia. The Lancet, 381(9866):557–564, 2013. [5] G. Schalk, KJ. Miller, NR. Anderson, JA. Wilson, MD. Smyth, JG. Ojemann, DW. Moran, JR. Wolpaw, and EC. Leuthardt. Two-dimensional movement control using electrocorticographic signals in humans. Journal of neural engineering, 5(1):75, 2008. [6] K. LaFleur, K. Cassady, A. Doud, K. Shades, E. Rogin, and B. He. Quadcopter control in three-dimensional space using a noninvasive motor imagery-based brain–computer interface. Journal of neural engineering, 10(4):046003, 2013. [7] S. Waldert, H. Preissl, E. Demandt, C. Braun, N. Birbaumer, A. Aertsen, and C. Mehring. Hand movement direction decoded from meg and eeg. The Journal of neuroscience, 28(4):1000–1008, 2008. [8] EYL. Lew, R. Chavarriaga, S. Silvoni, and J.d.R. Mill´an. Single trial prediction of self-paced reaching directions from eeg signals. Frontiers in neuroscience, 8, 2014. [9] AL. Orsborn, S. Dangi, HG. Moorman, and JM. Carmena. Closedloop decoder adaptation on intermediate time-scales facilitates rapid bmi performance improvements independent of decoder initialization conditions. Neural Systems and Rehabilitation Engineering, IEEE Transactions on, 20(4):468–477, 2012. [10] MM. Shanechi, ZM. Williams, GW. Wornell, RC. Hu, M. Powers, and EN. Brown. A real-time brain-machine interface combining motor target and trajectory intent using an optimal feedback control design. PloS one, 8(4):e59049, 2013. [11] M. Falkenstein, J. Hoormann, S. Christ, and J. Hohnsbein. ERP components on reaction errors and their functional significance: A tutorial. Biological Psychology, 51:87–107, 2000.
3121