The authors have been involved in ATM Forum Test working groups since ... performance of ATM equipment as well as the quality of service provided to the ...
ATM Performance Testing and QoS Management 1 Gojko Babic, Raj Jain, Arjan Durresi, The Ohio State University
Introduction ATM technology is now being deployed in operational networks. Most of the specifications required for operation have been developed. This includes signaling (UNI 4.0), routing (PNNI 1.0), traffic management (TM 4.0), numerous physical layer, network management, and testing specifications. As the technology moves from the laboratories to the field, the users have a need to benchmark and compare various ATM switches and other devices. The Devil's DP dictionary [4] defines performance benchmarking as follows: Benchmark v. trans. To subject (a system) to a series of tests in order to obtain prearranged results not available on competitive systems. This definition is not very far from truth. In the absence of a performance testing standard, each vendor is free to use whatever metric the vendor chooses and to measure those in an arbitrary manner. This can lead to confusion among buyers and users of the technology and can hurt the technology. The authors have been involved in ATM Forum Test working groups since 1996 and this chapter is summary of their contributions to the Forum. These contributions have helped development of a set of standard ATM performance metrics and their measurement procedures.
Cell-level vs. Frame-level QoS One of the key distinguishing features of our effort is its emphasis on frame-level quality of service. In the past, the performance of ATM equipment as well as the quality of service provided to the users were defined in terms of celllevel metrics. Cell loss ratio (CLR), cell delay variation (CDV), and cell transfer delay (CTD) are examples of celllevel metrics. Unfortunately, cell-level metrics do not reflect the performance as experienced (or desired) by the end users. Most users have frames to send and for the same cell loss ratio, the user perceived performance can be very different depending upon whether the cells dropped belong to a few frames or whether they belong to many frames. The user is more interested in frame loss ratio. Here, the term “frame” refers to AAL or higher layer protocol data unit (PDU). A similar argument can be made against other cell-level metrics. For example, a video user sending 30 frames/second would like to receive complete frames every 33 milliseconds. It does not matter whether the cells belonging to a frame arrive together or arrive regularly spaced. Thus, it is the frame delay variation that matters and not the cell delay variation. Frame-level metrics are also helpful in allowing ATM technology to be compared with non-ATM technology. For example, given a traffic pattern, a user could compare the performance of several network design alternatives - some of which may be ATM based and others may be non-ATM based.
Purpose of ATM Performance Metrics The main objective of ATM performance metrics is to provide means to compare various ATM equipment in terms of performance. The metrics should be independent of switch architecture. For example, “percentage of frames cutthrough without delay” applies only to switches with cut-through feature and is not meaningfully applied to other (store and forward) switches. Such architecture-dependent metrics should not be defined. It is also important to note that it is inappropriate to set any thresholds of required performance. What frame loss ratio or frame delay variation is acceptable is left to the user and the supplier. Generally, there is a tradeoff between cost 1
This chapter is a revised version of [5]
and acceptable performance. The users may accept equipment that is slow if it is cheap, while they may expect faster performance from expensive equipment. Different vendors will try to provide different cost-performance tradeoff points and such differentiation is generally good for a technology.
Metrics Most of the metrics discussed here apply to a single switch as well as a network of switches. Therefore, we use “system under test” or just “system” to refer to the device(s) being tested. A partial list of the metrics includes: throughput, frame latency, throughput fairness, frame loss ratio, maximum frame burst size, and call establishment. A brief overview of these metrics follows.
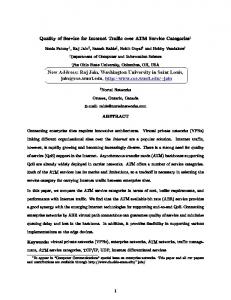
Throughput Three different frame-level throughput metrics are defined. Lossless throughput is the maximum rate at which none of the offered frames is dropped by the system. Thus, the lossless throughput is the highest load at which the count of the output frames equals the count of the input frames. Peak throughput is the maximum rate at which the system operates regardless of frames dropped. Thus, the peak throughput is the maximum throughput that can be achieved in spite of the losses. The maximum rate can actually occur when the loss is not zero. Also, note that the peak throughput may equal the lossless throughput in some cases. Full-load throughput is the rate at which the system operates when the input links are loaded at 100% of their capacity. In all cases, only frames that are received completely without errors are included in frame-level throughput.
A model graph of throughput vs. input rate is shown in Figure 1. Level x defines the lossless throughput, level y defines the peak throughput and level z defines the full-load throughput. Throughput (Output)
Peak y Lossless x Full-load z
x
b Load (Input)
c
Figure 1: Peak, lossless and full-load throughput
Throughput is expressed in effective bits/sec, counting only bits from AAL payloads excluding the overhead introduced by the ATM technology and transmission systems. This is preferred over specifying it in frames/sec or cells/sec. Frames/sec requires specifying the frame size. The throughput values in frames/sec at various frame sizes cannot be compared without first being converted into bits/sec. Cells/sec is not a good unit for frame-level performance since the cells are not seen by the user. Before starting measurements, a number of VCCs (or VPCs), called foreground VCs, are established through the system. Foreground VCs are used to transfer only the traffic whose performance is being measured. That traffic is referred as the foreground traffic. Foreground traffic is specified by the type of foreground VC, connection configuration, service class, arrival patterns, frame length, and input rate.
2
Foreground VCs can be permanent or switched, virtual path or virtual channel connections, established between ports on the same network module on the switch, or between ports on different network modules, or between ports on different switching fabrics. A system with n ports is tested for the following connection configurations: •
n-to-n straight: Input from one port exits to another port. This represents almost no path interference among VCs. There are n VCs.
•
n-to-(n–1) full cross: Input from each port is divided equally to exit on each of other (n–1) ports. This represents intense competition for the switching fabric by VCs. There are n×(n–1) VCs.
•
n-to-m partial cross: Input from each port is divided equally to exit on other m ports (1