For doing so, the trade-off between exploration and exploitation needs to be taken into account. The adoption of F-Race. At each iteration l, F-Race terminates (i) ...
MIC 2009: The VIII Metaheuristics International Conference
id-1
Automated Algorithm Tuning using F-races: Recent Developments Mauro Birattari∗
Zhi Yuan∗
Prasanna Balaprakash∗
Thomas St¨ utzle∗
∗ IRIDIA,
1
Introduction
20 09
Universit´e Libre de Bruxelles (ULB) CP 194/6, Av. F. Roosevelt 50, 1050, Brussels, Belgium {mbiro,zyuan,pbalapra,stuetzle}@ulb.ac.de
IC
Many state-of-the-art algorithms for tackling computationally hard problems have a number of parameters that influence their search behavior. Such algorithms include exact algorithms like branch-and-bound algorithms, algorithm packages like CPLEX for integer programming, and also approximate algorithms such as virtually all metaheuristics. Examples of parameters are numerical parameters such as the tabu list length in tabu search algorithms or the pheromone evaporation rate in ant colony optimization. Many algorithms can also be seen as being composed of a set of specific components that are often interchangeable. Examples here are branching strategies in branch-and-bound algorithms or different types of cross-over operators in evolutionary algorithms; hence, these components are possible levels of categorical algorithm parameters.
M
The performance of such parameterized algorithms depends strongly on the particular values of the numerical and categorical parameters and the appropriate setting of these parameters is itself a difficult optimization problems. In our research, we have developed techniques for the automated configuration of algorithms, the main one being F-Race [3, 2, 1]. In recent publications on F-Race, we have introduced an iterated version of it, called iterated F-Race (I/F-Race) [1]. It consists in iteratively applying F-Race to a set of candidate algorithm configurations that are generated according to an underlying probabilistic model in a model-based search fashion [8]. The idea is to shift at each iteration the probability distribution according to which the candidate algorithm configurations are generated towards the configurations that were found to perform best. Unfortunately, in [1] I/F-Race was only defined for continuous or quasicontinuous parameters. (We call quasi-continuous those parameters that have a “large” integer domain; examples are the population size in genetic algorithms or the tabu list length.) In this extended abstract, we discuss design issues for I/F-Race and present a new variant that handles categorical parameters. We also present results of experimental studies that illustrate the good behavior of this new variant. Hamburg, Germany, July 13–16, 2009
id-2
2
MIC 2009: The VIII Metaheuristics International Conference
F-Race for tuning stochastic local search algorithms
20 09
A formal definition of the problem of tuning stochastic algorithms is given by Birattari et al. [3]: the problem is defined as a 7 tuple hΘ, I, PI , Pc , t, C, T i, where Θ is the possibly infinite set of candidate configurations, I is the typically infinite set of problem instances, PI is a probability measure over I, t is a function and t(i) gives for every instance i ∈ I the computation time allocated to it, T gives the total amount of time available for the whole tuning process, PC is a probability measure over the set C of possible cost values of the best solution found when running a configuration θ ∈ Θ on instance i, C(θ) is the criterion to be optimized. The solution of the tuning problem consists in finding a configuration θ∗ that minimizes the cost criterion. Typically, C(θ) is an expected value where the expectation is considered with respect to both PI and PC . Here, we minimize the expected value of the solution cost, that is, the criterion we minimize is: h i Z Z C(θ) = EI,C c(θ, i) = c(θ, i) dPC (ct |θ, i) dPI (i), (1) I
C
where c(θ, i) is a random variable given by the cost value of the best solution found when running configuration θ on instance i in a given computation time t(i). The measures PI and PC is usually unknown, however, the integral in Eq. 1 can be estimated in a Monte Carlo fashion, on the basis of a tuning set of instances, which is assumed to be generated identically as the target instances.
3
IC
To estimate the integral in Eq. 1 on a given set of candidate configurations, F-Race adaptively allocates computational resources for evaluation. F-Race is inspired by a class of racing algorithms proposed in the machine learning community for the model selection problem [6, 7]. In F-Race, as in other racing algorithms, a set of candidate configurations is evaluated incrementally on a number of tuning instances. Poor performing candidate configurations are discarded from the race as soon as sufficient statistical evidence is gathered against them. The race terminates when either one single candidate configuration is left, or the available computational budget for the tuning process is finished. The peculiarity of F-Race compared to other racing algorithms is the adoption of the Friedman two-way analysis of variance by ranks [4], a non-parametric statistical test with blocking design that appears particularly suitable in the context of racing algorithms for the tuning problem.
The sampling strategy for F-Race
M
An important question is how to generate the initial set of candidates from Θ. When F-Race was first proposed [3], the initial candidates were collected by a full factorial design (FFD) on the parameter space. This is done by determining manually for each parameter a number of levels. Then, each combination of these levels represents a unique configuration, and the set of all possible combinations forms the initial set of configurations for F-Race. The reason of adopting a full factorial design in [3] was to focus more on the assessment of F-Race and its comparison to other ways of defining races, therefore full factorial design became a convenient choice. The main drawback of full factorial design is that the number of configurations grows exponentially with the number of parameters and that it requires expertise in the selection of the levels of the parameters. These drawbacks were also described in Balaprakash et al. [1] and they showed that F-Race with initial candidate configurations generated by a random sampling design significantly outperforms the full factorial design for a number of applications. In the random sampling design, the initial candidate
Hamburg, Germany, July 13–16, 2009
MIC 2009: The VIII Metaheuristics International Conference
id-3
configurations are sampled according to some probability model PX defined over the parameter space X. If no a priori information is available, the default way of doing this is to define PX as a uniform distribution over X. This random sampling version of F-Race we denote in the following F-Race(RSD). In the effort of improving the sampling strategy of F-Race, I/F-Race for tuning continuous parameters was introduced in [1]. In I/F-Race, the whole tuning process is done in a number of iterations. In each iteration, the candidate configurations are first sampled and then evaluated by F-Race. Once the best configurations are identified, the candidate configurations of the next iteration are sampled around the best configurations, in this way biasing the sampling towards the more promising regions identified in the previous iterations. In this sense, I/F-Race follows directly the framework of model-based search [8].
20 09
Before discussing design options for I/F-Race in more detail, we define several terms. In the problem of automated algorithm tuning, each trial is the execution of the tuning process together with a subsequent testing procedure. In the testing procedure, a certain number of test instances are given, on which the final configuration is tested. In the tuning process of I/F-Race, there are a number of iterations. In each iteration, first a set of candidates, i.e. parameter configurations, is sampled; this is followed by one run of F-Race applied to the sampled candidate configurations. F-Race evaluates the set of candidate configurations in a number of steps; in each step each of the surviving candidate configurations is evaluated once on one instance; in other words, each candidate will do one function evaluation on one instance at each step. The instances for tuning are usually drawn randomly from PI . After each step of F-Race, a Friedman two-way analysis of variance by ranks is applied and candidate configurations are eliminated once there is enough statistical evidence against them. The F-Race is terminated when the termination condition is met.
IC
Here, we assume that the total computational budget B for the tuning process, which is usually measured by the number of function evaluations, is given a priori. For the particular implementation of I/F-Race, a number of issues need to be considered; we discuss these in the following.
M
Experimental setup. I/F-Race is an iterative process and, hence, one issue is how many iterations should be used to execute the tuning process. For a given computational budget, using few iterations will allow to sample at each iteration more candidate configurations and, hence, lead to more exploration at the cost of less possibilities of refining the model. In the extreme case, of using only one iteration, this amounts to an execution of F-Race(RSD). If many iterations are allowed, the model may be much refined at the cost of possibly limiting the exploration of the parameter space. Intuitively, it makes sense to increase the number of iterations with the number of dimensions of the parameter space to guide the sampling process towards the most promising parameter region. Another issue concerns the distribution of the computational budget B among the iterations. The simplest idea is to divide the computational budgets equally among all iterations, although other possibilities may be also reasonable.
Generating candidate configurations. As said, candidate configurations are randomly sampled in the parameter space according to some probability distribution. For continuous and quasicontinuous parameters, continuous probability distributions are appropriate; for categorical parameters, however, discrete probability distributions will be more useful. A first question related to the probability distributions is of which exact type they should be. In [1], normal distributions were Hamburg, Germany, July 13–16, 2009
id-4
MIC 2009: The VIII Metaheuristics International Conference
chosen as models, but this choice need not be optimal. Other questions to be addressed concern the update of the probability distributions and, in particular, how strong the bias towards the surviving configurations of the current iteration should be. For doing so, the trade-off between exploration and exploitation needs to be taken into account.
4
20 09
The adoption of F-Race. At each iteration l, F-Race terminates (i) if the computational budget for the l-th iteration, Bl , is spent or (ii) when a minimum number Nmin of candidate configurations remains. For the setup of F-Race, one needs to define the number of candidate configurations to be used. A good idea is to make the number of configurations dependent on the status of the race, in other words, the iteration counter. In the first iteration(s), the sampled candidate configurations are very different from each other and, as a side effect, poor candidate configurations can be quickly eliminated. In later iterations, the sampled configurations become more similar and it becomes more difficult to determine the winner. Hence, for a same budget, it makes sense to sample in early iterations more configurations, while in later iterations less candidate configurations should be generated. Another question concerns the value of Nmin . F-Race terminates if a unique survivor is identified. However, to increase the exploration of the parameter space, it may be better to keep in I/F-Race a number of survivors at each iteration.
Experimental analysis
In this section we experimentally evaluate a particular variant of I/F-Race and compare it to F-Race(FFD), F-Race where the initial candidate configurations are generated by a full factorial design, and F-Race(RSD).
M
IC
We use three case studies for tuning ant colony optimization (ACO) algorithms for the traveling salesman problem (TSP). They include tuning MAX–MIN Ant System (MMAS) using four nominal parameters, tuning MMAS with seven nominal parameters, and tuning the whole ACOTSP software packed with 12 mixed parameters. The software that is used for the ACO algorithms is the ACOTSP package, which implements several Ant Colony Optimization (ACO) algorithms for the TSP. (The ACOTSP package is available at http://www.aco-metaheuristic. org/aco-code/). We use Euclidean TSP instances with 750 nodes uniformly distributed in a square of side length 10 000. We use 1000 instances for tuning and 300 for evaluating the winning configurations using the DIMACS instance generator [5]. For each tuning task, two experiments are run, one using a maximum computation time of 5 and another using a maximum of 20 CPU seconds. The experiments were carried out on cluster computing nodes, each equipped with two quad-core XEON E5410 CPUs running at 2.33 GHz and 8 GB RAM. Due to the sequential implementation of the ACOTSP software, each evaluation of a candidate configuration uses only a single core.
4.1
An example I/F-Race
As discussed before, there are many ways how I/F-Race can be implemented. In the following, we define the version of I/F-Race that we used for the experiments here. Experimental setup. We increase the number of iterations L of I/F-Race with the dimension d, using a setting of L = 2 + round(log2 d). The computational budget is distributed as equally as Hamburg, Germany, July 13–16, 2009
MIC 2009: The VIII Metaheuristics International Conference
id-5
possible across the iterations. Bl , the computational budget in iteration l, where l = 1, ..., L, is set to Bl = (B − Bused )/(L − l + 1); Bused denotes the total computational budget used in the previous iterations. Candidate–evaluation trade-off. We let a candidate-evaluation trade-off factor µl increase with l the number of iterations, using a setting of µl = 5 + l. Using µl , we then define Nl = b B µl c to be the number of candidate configurations sampled at iteration l. As a setting of Nmin we use Nmin = 2+round(log2 d), that is, the number of survivors of each F-Race increases with the number of parameters.
20 09
Update of the probability model. In the first iteration, all candidate configurations are sampled uniformly. Once F-Race terminates, the best Ns candidate configurations are selected for the update of the probability distribution for the candidate configuration sampling of the next iteration, where Ns = min(Nsurvive , Nmin ) and Nsurvive denotes the number of candidates that survive the race. These Ns elite configurations are then ranked according to their expected solution costs, and the influence of an elite configuration with rank rz (z = 1, . . . , Ns ) on the probability model update is weighted by: N s − rz + 1 wz = . (2) Ns · (Ns + 1)/2 In other words, the update influence of an elite configuration is inversely proportional to its rank in the elite set. Since the instances for tuning are sampled randomly, the Ns elite configurations of the lth iteration will be re-evaluated in the (l+1)-th iteration, together with the Nl+1 −Ns candidate configurations to be sampled anew. Each of the new candidate configuration will be iteratively sampled around one of the elite configurations, which are denoted by E z (z ∈ {1, . . . , Ns }). The probability of choosing an elite configuration E z is wz .
M
IC
Denote X the parameter space, which can be decomposed into a disjoint union of the set of continuous and quasi-continuous parameters X cont and the set of nominal and pseudo-nominal parameters X nom , X = X cont ∪ X nom . Denote Xi the ith dimension of X. Suppose that Xi is a continuous or quasi-continuous parameter with boundary Xi ∈ [Xi , Xi ]. Denote vi = Xi − Xi the range of the parameter Xi . Then the sampling of Xi is around the ith dimension of E z , denoted as xzi , by a normal distribution N (xzi , σil ), where xzi is the mean value of the normal distribution, and the standard deviation σil of Xi for the sampling at the lth iteration is reduced in a geometric fashion from iteration to iteration. It is defined as follows:
σil+1
�
= vi ·
1 Nl+1
�l
d
for l = 1, . . . , L − 1
(3)
This means, the higher the dimension of the parameter space, the smaller the update factor will become, thus the stronger the bias of the elite configuration will be on the sampling. Furthermore, the higher the number of candidate configurations to be sampled, the stronger the bias of the sampling distribution. If Xi ∈ X nom with ni levels i = f1 , . . . , fni , then a discrete distribution on Xi is defined by a PF ni function P : Fi → (0, 1) with j=1 P (fj ) = 1. After the l-th iterations, suppose the ith dimension of the selected elite configuration E z takes the level fiz , the discrete distribution of parameter Xi is updated as: Hamburg, Germany, July 13–16, 2009
id-6
MIC 2009: The VIII Metaheuristics International Conference
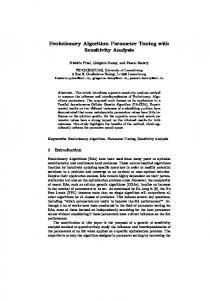
Table 1: Range and number of levels of each discretized parameter considered for tuning ACOTSPcat4. As can be computed, the number of possible parameter settings is 12 100. parameter α β ρ m
l l ) + Ij=fiz · L L
where I is an indicator function.
4.2
num.levels 11 11 10 10
20 09
Pl+1 (fj ) = Pl (fj ) · (1 −
range [0.01, 5.00] [0.01, 10.00] [0.00, 1.00] [5, 100]
for l = 1, . . . , L − 1 and j = 1, . . . , ni
(4)
Case Study 1: MMAS for TSP with four discretized parameters
IC
In this experiment we are tuning the following four parameters of MMAS: (i) the relative influence of pheromone trails, α; (ii) the relative influence of heuristic information, β; (iii) the pheromone evaporation rate, ρ; and (iv) the number of ants, m. We discretize these numerical parameters to have a basic benchmark for tuning categorical parameters, where each parameter has a relatively large number of values; in fact, each parameter is treated as if it were a categorical parameter. The four parameters were discretized based on a grid having equal intervals and the ranges and number of levels as listed in Table 1. For the other parameters, we use default values and we opted for an ACO version that does not use local search.
M
Three levels of the computational budget are chosen, 486, 1536 and 3750; we have 486 = 6 · 34 , 1536 = 6 · 44 and 3750 = 6 · 54 . The reason for this choice is that, firstly the candidate evaluation trade-off factor µ = 6 for F-Race(FFD) and F-Race(RSD), and that the computational budget is designed in such a way that the candidate generation of F-Race(FFD) can be done by selecting the same number of levels for each parameter, in our case 3, 4, and 5. Without a priori knowledge, the levels of each parameter is selected randomly in F-Race(FFD). The experimental results are given in Table 2. The three algorithms F-Race(FFD), F-Race(RSD), I/F-Race are compared using the non-parametric pairwise Wilcoxon test with Holm adjustment, and the test is conducted using paired blocking; the α level chosen is 0.05. The unique significant winner in each experiment is marked in bold face. The results can be summarized as follows. In all experiments I/F-Race and F-Race(RSD) significantly outperform F-Race(FFD), as indicated by the Wilcoxon test. The result shows that I/F-Race is behaving better than F-Race(RSD), since in 3 out of 6 experiments I/F-Race significantly outperforms F-Race(RSD), and F-Race(RSD) is significantly better in only one experiment. The trend appears to be that with larger total budgets, the advantage of I/F-Race over F-Race(RSD) increases.
Hamburg, Germany, July 13–16, 2009
MIC 2009: The VIII Metaheuristics International Conference
id-7
Table 2: Computational results for tuning MMAS for TSP with 4 discretized parameters in 5 and 20 seconds, respectively. The column entries with the label per.dev shows the percentage deviation of each algorithms’ expected solution cost from the reference cost. The reference cost is taken as: +x means that the expected solution cost of the algorithm is x% more than the reference cost and −x means that the expected solution cost of the algorithm is x% less than the reference cost. The column entries with the label with max.bud shows the maximum number of evaluations given to each algorithm. 5 seconds per.dev +0.85 −0.58 −0.26 +0.51 −0.08 −0.42 +0.40 −0.12 −0.28
20 seconds per.dev +0.79 −0.44 −0.34 +1.27 −0.66 −0.61 +0.71 −0.27 −0.45
max.bud 486 486 486 1536 1536 1536 3750 3750 3750
20 09
algo F-Race(FFD) F-Race(RSD) I/F-Race F-Race(FFD) F-Race(RSD) I/F-Race F-Race(FFD) F-Race(RSD) I/F-Race
Table 3: Range and number of levels of the each discretized parameter considered for tuning ACOTSP-cat7. The number of possible parameter settings is 259200. range [0.01, 5.00] [0.01, 10.00] [0.00, 1.00] [0.01, 5.00] [5, 100] [5, 50] [0.0, 1.0]
num.levels 5 6 8 6 5 4 9
Case study 2: MMAS for TSP with 7 discretized parameters
M
4.3
IC
parameter α β ρ γ m nn q0
In this experiment we have chosen the following 7 parameters: (i) the relative influence of pheromone trails, α; (ii) the relative influence of heuristic information, β; (iii) the pheromone evaporation rate, ρ; (iv) the parameter used in computing the minimum pheromone trail value τmin , γ, which is given by τmax /(γ · instance size); (v) the number of ants, m; (vi) the number of neighbors used in the solution construction phase, nn; (vii) the probability of selecting the best neighbor deterministically, q0 . The parameters are discretized with the range and number of levels given in Table 3. Note that in comparison to the previous experiment, the parameter space is more than one order of magnitude larger. Besides, there is smaller number of levels for each parameter, usually between four to nine. We use the same experimental setup as in the previous section, except that for the computational budget, we choose 768 = 6 · 27 and 3888 = 6 · 23 · 34 , such that in F-Race(FFD), three parameters will have two levels, and the other four parameters have three levels. Hamburg, Germany, July 13–16, 2009
id-8
MIC 2009: The VIII Metaheuristics International Conference
Table 4: Computational results for tuning MMAS for TSP with 7 categorical parameters in 5 and 20 CPU seconds. For an explanation of the table entries see the caption of Table 2. 5 seconds per.dev +9.33 −4.49 −4.84 +0.90 −0.27 −0.63
20 seconds per.dev +4.61 −1.35 −3.25 +2.38 −0.33 −2.05
max.bud 768 768 768 3888 3888 3888
20 09
algo F-Race(FFD) F-Race(RSD) I/F-Race F-Race(FFD) F-Race(RSD) I/F-Race
The experimental results are listed in Table 4. The three algorithms F-Race(FFD), F-Race(RSD), I/F-Race are compared using non-parametric pairwise Wilcoxon test with Holm adjustment, using α = 0.05. The results clearly show that I/F-Race significantly outperforms F-Race(FFD) and F-Race(RSD) in each experiment. As expected, also F-Race(RSD) outperforms F-Race(FFD) significantly.
4.4
Case study 3: ACOTSP with all possible parameters
M
IC
In a final experiment 12 parameters of ACOTSP are tuned. This includes the following four continuous parameters (i) relative influence of pheromone trails, α; (ii) relative influence of heuristic information, β; (iii) pheromone evaporation rate, ρ; (iv) the probability of selecting the best neighbor deterministically, q0 . We also tune five quasi-continuous parameters, which are (i) number of ants, m; (ii) number of neighbors used in the solution construction phase, nn; (iii) number of neighbors used in the local search, nnls; (iv) number of ranks in rank-based Ant System, rasrank; (v) number of elitist ants, eants. Finally, these three categorical parameters are considered for the configuration task: (i) which ACO variant is to be chosen (this includes levels MMAS, ant colony system (ACS), rank-based ant system (RAS), elitist ant system (EAS), ant system (AS)); (ii) the local search type l (this includes four levels no local search, 2-opt, 2.5-opt, and 3-opt); (iii) the usage of don’t look bits, dlb (binary parameter, on and off). Furthermore the following subsidiary parameters (parameters that depend on whether some other parameter levels are used or not) are handled: (i) dlb and nnls are used only when local search is on; (ii) q0 is used only when ACS is selected; (iii) rasrank is used only when RAS is selected; (iv) eants is used only when EAS is selected. In this experiment, continuous and quasi-continuous as well as true categorical parameters are tuned. Due to the large number of parameters, the full factorial design is infeasible. Besides, the other experiments have already showed the poor quality of F-Race(FFD). Therefore in this set of experiments, only F-Race(RSD) and I/F-Race will be applied.
For computational budgets we adopted 1500, 3000 and 6000 and, as usual the two computation times 5 and 20 seconds. The experimental results are given in Table 5. The two algorithms F-Race(RSD) and I/F-Race are compared using non-parametric pairwise Wilcoxon test (α = 0.05). The statistical comparisons show that I/F-Race is again dominating. It is significantly better Hamburg, Germany, July 13–16, 2009
MIC 2009: The VIII Metaheuristics International Conference
id-9
Table 5: Computational results for tuning MMAS for TSP with 12 parameters in 5 and 20 CPU seconds. For an explanation of the table entries see the caption of Table 2. 5 seconds per.dev +0.06 −0.06 +0.04 −0.04 +0.07 −0.07
20 seconds per.dev +0.005 −0.005 +0.009 −0.009 −0.001 +0.001
max.bud 1500 1500 3000 3000 6000 6000
20 09
algo F-Race(RSD) I/F-Race F-Race(RSD) I/F-Race F-Race(RSD) I/F-Race
performing in five out of six experiments; only in the 20 second case with 6000 computational budget, there is no significance can be identified. However, the quality differences in this set of experiments are quite small, usually below 0.1% in the 5 second case, while in the 20 second case the difference is below 0.01%. This shows that the solution quality is not very sensitive to the parameter settings. This is usually the case when a strong local search, e.g. 3-opt, is used.
References
IC
[1] P. Balaprakash, M. Birattari, T. St¨ utzle, and M. Dorigo. Improvement strategies for the frace algorithm: Sampling design and iterative refinement. In T. Bartz-Beielstein, M. Blesa, C. Blum, B. Naujoks, A. Roli, G. Rudolph, and M. Sampels, editors, 4th International Workshop on Hybrid Metaheuristics, Proceedings, HM 2007, volume 4771 of Lecture Notes in Computer Science, pages 108–122. Springer Verlag, Berlin, Germany, 2007. [2] M. Birattari. The Problem of Tuning Metaheuristics as Seen from a Machine Learning Perspective. PhD thesis, Universit´e Libre de Bruxelles, Brussels, Belgium, 2004.
M
[3] M. Birattari, T. St¨ utzle, L. Paquete, and K. Varrentrapp. A racing algorithm for configuring metaheuristics. In W. B. Langdon et al., editors, Proceedings of the Genetic and Evolutionary Computation Conference, pages 11–18. Morgan Kaufmann Publishers, San Francisco, CA, USA, 2002. [4] W. J. Conover. Practical Nonparametric Statistics. John Wiley & Sons, New York, NY, USA, third edition, 1999. [5] D. S. Johnson, L. A. McGeoch, C. Rego, and F. Glover. 8th DIMACS implementation challenge. http://www.research.att.com/ ~dsj/chtsp/, 2001. [6] O. Maron and A. W. Moore. Hoeffding races: Accelerating model selection search for classification and function approximation. In J. D. Cowan, G. Tesauro, and J. Alspector, editors, Advances in Neural Information Processing Systems, volume 6, pages 59–66, San Francisco, CA, USA, 1994. Morgan Kaufmann Publishers. Hamburg, Germany, July 13–16, 2009
id-10
MIC 2009: The VIII Metaheuristics International Conference
[7] A. W. Moore and M. S. Lee. Efficient algorithms for minimizing cross validation error. In Proceedings of the Eleventh International Conference on Machine Learning, pages 190–198, San Francisco, CA, USA, 1994. Morgan Kaufmann Publishers.
M
IC
20 09
[8] M. Zlochin, M. Birattari, N. Meuleau, and M. Dorigo. Model-based search for combinatorial optimization: A critical survey. Annals of Operations Research, 131(1–4):373–395, 2004.
Hamburg, Germany, July 13–16, 2009