Automatic Chord Recognition from Audio Using Enhanced Pitch Class Profile Kyogu Lee Center for Computer Research in Music and Acoustics Department of Music, Stanford University
[email protected] Abstract In this paper, a feature vector called the Enhanced Pitch Class Profile (EPCP) is introduced for automatic chord recognition from the raw audio. To this end, the Harmonic Product Spectrum is first obtained from the DFT of the input signal, and then an algorithm for computing a 12-dimensional pitch class profile is applied to it to give the EPCP feature vector. The EPCP vector is correlated with the pre-defined templates for 24 major/minor triads, and the template yielding maximum correlation is identified as the chord of the input signal. The experimental results show the EPCP yields less errors than the conventional PCP in frame-rate chord recognition.
1 Introduction A musical chord can be defined as a set of simultaneous tones, and succession of chords over time, or chord progression, forms a core of harmony in a piece of music. Hence analyzing the overall harmonic structure of a musical piece often starts with labeling every chord in it. This is a difficult and tedious task even for experienced listeners with the scores at hand. Automation of chord labeling thus can be very useful for those who want to do harmonic analysis of music. Once the harmonic content of a piece is known, it can be further used for higher-level structural analysis. It also can be a good mid-level representation of musical signals for such applications as music segmentation, music similarity identification, and audio thumbnailing. For these reasons and others, automatic chord recognition has recently attracted a number of researchers in a Music Information Retrieval community. A chromagram or a Pitch Class Profile has been the choice of the feature set in automatic chord recognition or key extraction since Fujishima introduced it (Fujishima 1999). Perception of musical pitch has two dimensions - height and chroma. Pitch height moves vertically in octaves telling which
octave a note belongs to. On the other hand, chroma tells where it stands in relation to others within an octave. A chromagram or a pitch class profile is a 12-dimensional vector representation of a chroma, which represents the relative intensity in each of twelve semitones in a chromatic scale. Since a chord is composed of a set of tones, and its label is only determined by the position of those tones in a chroma, regardless of their heights, chromagram seems to be an ideal feature to represent a musical chord. There are some variations to obtain a 12-bin chromagram, but it usually follows the following steps. First, the DFT of the input signal X(k) is computed, and the constant Q transform XCQ is calculated from X(k), which uses a logarithmically spaced frequencies to reflect the frequency resolution of the human ear (Brown 1990). The frequency resolution of the constant Q transform follows that of the equal-tempered scale, and thus the kth spectral component is defined as fk = (21/B )k fmin ,
(1)
where fk varies from fmin to an upper frequency, both of which are set by the user, and B is the number of bins in an octave in the constant Q transform. Once XCQ (k) is computed, a chromagram vector CH can be easily obtained as:
CH(b) =
M−1 X m=0
XCQ (b + mB) ,
(2)
where b = 1, 2, · · · , B is the chromagram bin index, and M is the number of octaves spanned in the constant Q spectrum. For chord recognition, only B = 12 is needed, but B = 24 or B = 36 is also used for pre-processing like fine tuning. The remainder of this paper is organized as follows: Section 2 reviews related work on this field; Section 3 starts by stating the problems in the previous work caused by choosing
the chromagram as the feature set, and provides a solution by suggesting a different feature vector called the Enhanced Pitch Class Profile (EPCP). In Section 4, the comparison of the two methods with real recording examples is presented, followed by discussions. In section 5, we draw conclusions and directions for future work are suggested.
2 Related Work A chromagram or a pitch class profile (PCP) based features have been almost exclusively used as a front end to the chord recognition or key extraction systems from the audio recordings. Fujishima developed a realtime chord recognition system, where he derived a 12-dimensional pitch class profile from the DFT of the audio signal, and performed pattern matching using the binary chord type templates (Fujishima 1999). Gomez and Herrera proposed a system that automatically extracts from audio recordings tonal metadata such as chord, key, scale and cadence information (Gomez and Herrera 2004). They used as the feature vector, a Harmonic Pitch Class Profile (HPCP), which is based on Fujishima’s PCP, and correlated it with a chord or key model adapted from Krumhansl’s cognitive study (Krumhansl 1990). Similarly, Pauws used the maximum-key profile correlation algorithm to extract key from the raw audio data, where he averaged the chromagram features over variable-length fragments at various locations, and correlate them with the 24 major/minor key profile vectors derived by Krumhansl and Kessler (Pauws 2004). Harte and Sandler used a 36-bin chromagram to find the tuning value of the input audio using the distribution of peak positions, and then derived a 12-bin, semitone-quantized chromagram to be correlated with the binary chord templates (Harte and Sandler 2005). Sheh and Ellis proposed a statistical learning method for chord segmentation and recognition, where they used the hidden Markov models (HMMs) trained by the Expectation Maximization (EM) algorithm, and treated the chord labels as hidden values within the EM framework (Sheh and Ellis 2003). Bello and Pickens also used the HMMs with the EM algorithm, but they incorporated musical knowledge into the models by defining a state transition matrix based on the key distance in a circle of fifths, and by avoiding random initialization of a mean vector and a covariance matrix of observation distribution, which was modeled by a single Gaussian (Bello and Pickens 2005). In addition, in training the model for parameter estimation, they selectively update the parameters of interest on the assumption that a chord template or distribution is almost universal, thus disallowing adjustment of distribution parameters. In the following section, we state the problems with the chromagram-based approaches in a chord identification ap-
plication, and propose a novel method which uses the enhanced chromagram in place of the conventional chromagram.
3 Enhanced Pitch Class Profile (EPCP) All of the aforementioned work on chord recognition or key extraction, while the details of the algorithms may vary, have one thing in common - they all use a chromagram as the feature vector. To identify a chord, some use a template matching algorithm (Fujishima 1999; Gomez and Herrera 2004; Pauws 2004; Harte and Sandler 2005), whereas others use a probabilistic model such as HMMs (Sheh and Ellis 2003; Bello and Pickens 2005). Although the HMMs have long been accepted by a speech recognition society for their excellent performance, their performance in a chord recognition task is poorer or just comparable to that of simple pattern matching algorithms. Furthermore, it is a very time consuming and tedious job to manually label all the chord boundaries in recordings with corresponding chord names to generate the training data. But the conventional 12-dimensional pitch class profile may cause some problems, particularly when used with the template matching algorithm.
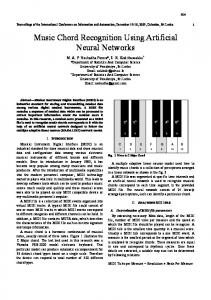
3.1 Problems with Chroma-based Approach In chord recognition systems with a template matching algorithm, templates of chord profiles are first defined. These templates are 12-dimensional, and each bin corresponds to a pitch class in a chromatic scale. They are usually binary or all-or-none type; i.e., each bin is either 0 or 1. For example, since a C major triad comprises three notes at C (root), E (third), and G (fifth), the template for a C major triad is [1,0,0,0,1,0,0,1,0,0,0,0], and [0,0,1,0,1,0,0,0,1,0,0,1] for a G major triad, where the template labeling is [C,C#,D,D#,E,F,F#,G,G#,A,A#,B]. As can be seen in these examples, every template in 12 major triads will be just a shifted version of the other, and for the minor triad, it will be the same as the major triad with its third shifted by one to the left; e.g., [1,0,0,1,0,0,0,1,0,0,0,0] is a C minor triad template. Templates for augmented, diminished, or 7th chords can be defined in a similar way. The chroma vector from real world recordings can never be binary, however, because acoustic instruments produce overtones as well as fundamental notes. Figure 1 shows the chroma vector from C major triad played by a piano. As can be seen in Figure1, even if the strongest peaks are found at C, E, and G, the chroma vector has nonzero intensity at all 12 pitch classes because of the overtones generated by the chord tones. This noisy chroma vector may cause confusion to the recognition systems with binary type templates. The problem can be more serious between the chords that
Pitch Class Profile
Pitch Class Profile of A minor triad
1
1
0.9
0.8
0.8
0.6 0.4
0.7
0.2
0.6 0 C
0.5
C#
D
D#
E
F
F#
G
G#
A
A#
B
Correlation with 24 major/minor triad templates
0.4
1
0.3 0.5
0.2 0.1 0 C
0
C#
D
D#
E
F
F#
G
G#
A
A#
B −0.5 C C# D
D# E
F
F# G G# A
A# B
c
c# d
d# e
f
f#
g
g# a
a# b
Figure 1: Chroma vector of a C major triad played by piano.
share one or more notes such as a major triad and its parallel minor or its relative minor; e.g., a C major triad and a C minor triad share two chord notes C and G, and a C major triad and a A minor triad have notes C and E in common. Figure 2 illustrates a conventional chroma vector of an A minor triad from a real world example and its correlation with 24 major/minor triad templates. Similar to the previous example in Figure 1, the chroma vector has most energy at the chord tones, i.e., at A, C, and E, but the pitch class G, which is not a chord tone, has more energy than the pitch class A. This may be caused by non-chord tones and/or by overtones of other tones. The high energy in G thus gives the maximum correlation with a C major triad, which is a relative major of an A minor triad, as denoted by an arrow in the lower figure, and thus the system identifies the chord as a C major triad. Similar errors are made between the parallel major and minor triads.
3.2 Enhancing the Chroma Vector The problems exemplified in the above section can be solved by enhancing the conventional chroma vectors so that they can become more of a binary type, just like their templates used for pattern matching. To this end, the Harmonic Product Spectrum (HPS) was first obtained from the DFT of the input signal, and the Enhanced Pitch Class Profile was then computed from the HPS, instead of the original DFT. The Harmonic Product Spectrum has been used for detecting fundamental frequency in a periodic signal or for determining pitch in human speech (Schroeder 1968; Noll 1969). The algorithm for computing the HPS is very simple and is based on the harmonicity of the signal. Since most acoustic
Figure 2: Chroma vector of an A minor triad, and its correlation with 24 major/minor triad templates. Arrow in the lower figure denotes where the maximum correlation occurs.
instruments and human voice produce a sound that has harmonics at the integer multiples of its fundamental frequency, decimating the original magnitude spectrum by an integer number will also yield a peak at its fundamental frequency. The final HPS is obtained by multiplying the spectra, and the peak in the HPS is determined as the fundamental frequency. The algorithm is summarized in the following equations:
HP S(ω) =
M Y X(mω)
(3)
m=1
F0
= arg max{HP S(ω)},
(4)
ω
where HP S(ω) is the Harmonic Product Spectrum, X(ω) is the DFT of the signal, M is the number of harmonics to be considered, and F0 is the estimated fundamental frequency. This algorithm was proved to work well in monophonic signals, but it turns out that it also works for estimating multiple pitches in polyphonic signals. In the case of chord recognition application, however, decimating the original spectrum by the powers of 2 turned out to work better than decimating by integer numbers. This is because harmonics not at the power of 2 or at the octave equivalents of the fundamental frequency may contribute to generating some energy at other pitch classes than those who comprise chord tones, thus preventing enhancing the spectrum. For example, the fifth harmonic of A3 is C6#, which is not a chord tone in an A minor triad. Therefore, Equation 3 is modified as follows to reflect this:
1
HP S(ω) =
M Y X(2m ω)
(5)
m=0
EPCP PCP
0.8 0.6
Figure 3 shows the DFT of the same example as in Figure 2, and the corresponding HPS obtained using M = 3.
0.4 0.2 0 C
FFT magnitude of A minor triad
C#
D
D#
E
F
F#
G
G#
A
A#
B
1 0.8 1 0.6
EPCP PCP
0.4 0.5 0.2 0
0
500
1000
1500
2000
2500
3000
0
HPS of A minor triad 1 −0.5 C C# D D# E
0.8
F F# G G# A A# B
c
c# d
d# e
f
f# g
g# a
a# b
0.6 0.4 0.2 0
0
500
1000
1500 frequency (Hz)
2000
2500
3000
Figure 3: DFT of A minor triad example (above) and its Harmonic Product Spectrum (below) Once the HPS is computed from the DFT, the EPCP vector is obtained simply by computing the chroma vector from the HPS instead of the DFT. In Figure 4 are shown the EPCP vector from the same example, and its correlation with the 24 major/minor triad templates. Overlaid are the conventional PCP vector and its correlation in dotted lines for comparison. We can clearly see from the figure that non-chord tones are suppressed enough to emphasize the chord tones only, which are A, C, and E in this example. This removes the ambiguity between its relative major triad, and the resulting correlation has a maximum value at the A minor triad. For clarification, Table 1 shows correlation results between the PCP vector and the EPCP vector and the triad templates.
4 Experimental Results and Discussion We compared the EPCP feature vectors against the conventional pitch class profile using real recording examples. The audio files are downsampled to 11025 Hz, and 36 binsper-octave constant Q transform was performed between
Figure 4: EPCP vector of an A minor triad, and its correlation with 24 major/minor triad templates. Arrow in the lower figure represents the maximum correlation.
fmin = 96 Hz and fmax = 5250 Hz. The PCP/EPCP vector of 36 dimensions gives resolution fine enough to distinguish adjacent semitone frequencies regardless of tuning. A window length of 8192 samples was used with the hopsize of 1024 samples, which correspond to 743 ms and 92.3 ms, respectively. A relatively long window is necessary for capturing harmonic information observed in a melodic passage such as arpeggios. A 36-dimensional PCP/EPCP vector is then computed from the constant-Q transform as described in Equation 2. Finally, a tuning algorithm proposed by Harte and Sandler is applied to a 36-bin PCP/EPCP vector to compensate mistuning that may be present in recordings, yielding a 12-dimensional PCP/EPCP vector. The details on the tuning algorithm can be found in (Harte and Sandler 2005). Figure 5 shows frame-level recognition of first 20 seconds of Bach’s Prelude in C major performed by Glenn Gould. The solid line with X’s represents frame-level chord recognition using the EPCP vector, and the dashed line with circles using the conventional PCP vector. It is clear from the figure that the EPCP vector makes less errors than the PCP vector. Particularly, there are quite a few errors with the PCP vectors in identifying a D minor chord, most of which are caused by a confusion between its parallel major, or D major. Similar errors are shown in recognizing a A minor triad, confused by its relative major, or C major triad. On the other hand, the EPCP vector makes no error between the desired chord and
Table 1: Correlation results of PCP/EPCP vectors used in Figure 2 and 4 with 24 major/minor triad templates. Capital letters represent major triads, and small letters minor triads. Maximum correlation values are in boldface. Template PCP Template PCP Template EPCP Template EPCP
C 0.8528 c 0.2489 C 0.7574 c 0.3142
C# -0.2861 c# 0.3167 C# -0.2348 c# 0.1859
D -0.2786 d -0.2041 D -0.2481 d -0.2217
D# -0.1379 d# -0.3607 D# -0.2761 d# -0.2825
E 0.3144 e 0.4757 E 0.1652 e 0.1702
F 0.2061 f 0.0886 F 0.3732 f 0.3316
chords that are harmonically closely related to. Also shown in Figure 6 are recognition results for smoothed PCP/EPCP vectors across 11 frames. This smoothing process reduces errors due to sudden changes in signals caused by transient and noise-like sounds, which can obscure harmonic components. Most errors are corrected in case of the EPCP vectors whereas there are still quite a few errors with the PCP vectors. Another example is shown in Figure 7. As shown in the previous example, using the PCP vector, several frames of a D major triad were misidentified as a B minor triad in the middle of the excerpt because of their relative major-minor relationship. Also noticeable is a total misidentification of a B minor triad as an E major triad, which have no close harmonic relationship with each other. The EPCP vector again makes no error in both cases, and far less errors occur in general. Figure 8 shows recognition results after a smoothing process over 11 frames. Some instantaneous errors are corrected in both cases, but the errors found in the middle and at the end of the excerpt were not corrected by a simple smoothing process in case of the PCP vector.
5 Conclusions We have presented a new feature vector for automatic chord recognition from the raw audio which is more appropriate than the conventional chroma vector when used with pattern matching algorithms with the binary-type chord templates. The new feature vector, the Enhanced Pitch Class Profile, or the EPCP vector was computed from the harmonic product spectrum of an input signal instead of the DFT in order to subdue the intensities at pitch classes occupied by overtones of the chord tones. Experimental results with real recording examples show the EPCP vector outperforms the conventional PCP vector in identifying chords both at the frame rate and in smoothed representation. The difference in performance between the two feature vectors becomes more obvious when there is a greater degree of confusion between
F# -0.3592 f# -0.2432 F# -0.2577 f# -0.2196
G -0.1621 g -0.1719 G -0.2766 g -0.2797
G# 0.0877 g# -0.2895 G# 0.3092 g# -0.2780
A 0.4342 a 0.8090 A 0.2275 a 0.7939
A# -0.3202 a# -0.2847 A# -0.2598 a# -0.2313
B -0.3510 b -0.3849 B -0.2794 b -0.2831
harmonically closely related chords such as relative or parallel major/minor chords. The results show that the EPCP vector is much less sensitive to such confusions. In the future, we plan to use the EPCP vector as a front end to the machine learning models such as hidden Markov models (HMMs) or Support Vector Machines (SVMs), which have been recently used in a chord recognition application. In addition, more sophisticated algorithms for enhancing the chroma vector are also being considered as further work.
6 Acknowledgment The author would like to thank Craig Sapp for fruitful discussions and suggestions regarding this research.
References Bello, J. P. and J. Pickens (2005). A robust mid-level representation for harmonic content in music signals. In Proceedings of the International Symposium on Music Information Retrieval, London, UK. Brown, J. C. (1990). Calculation of a constant q spectral transform. Journal of the Acoustical Society of America 89(1), 425–434. Fujishima, T. (1999). Realtime chord recognition of musical sound: A system using Common Lisp Music. In Proceedings of the International Computer Music Conference, Beijing. International Computer Music Association. Gomez, E. and P. Herrera (2004). Automatic extraction of tonal metadata from polyphonic audio recordings. In Proceedings of the Audio Engineering Society, London. Audio Engineering Society. Harte, C. A. and M. B. Sandler (2005). Automatic chord identification using a quantised chromagram. In Proceedings of the Audio Engineering Society, Spain. Audio Engineering Society. Krumhansl, C. L. (1990). Cognitive Foundations of Musical Pitch. Oxford University Press.
Noll, A. M. (1969). Pitch determination of human speech by the harmonic product spectrum, the harmonic sum spectrum, and a maximum likelihood estimate. In Proceedings of the Symposium on Computer Processing ing Communications, New York, pp. 779–797. Pauws, S. (2004). Musical key extraction from audio. In Proceedings of the International Symposium on Music Information Retrieval, Barcelona, Spain. Schroeder, M. R. (1968). Period histogram and product spectrum: New methods for fundamental-frequency measurement. Journal of the Acoustical Society of America 43(4), 829–834. Sheh, A. and D. P. Ellis (2003). Chord segmentation and recognition using em-trained hidden Markov models. In Proceedings of the International Symposium on Music Information Retrieval, Baltimore, MD.
Frame−level recognition b a# a g# g f# f e d# d c# c B A# A G# G F# F E D# D C# C
HPCP EHPCP
C 0
2
Dm7/C 4
6
G7/B 8
10
C 12
14
Am/C 16
D7/C 18
20
Figure 5: Frame-level chord recognition results of an excerpt from Bach’s Prelude in C Major. Vertical lines denote manually annotated chord boundaries with chord names.
Chord Name
Smoothed over 11 frames b a# a g# g f# f e d# d c# c B A# A G# G F# F E D# D C# C
HPCP EHPCP
C 0
2
Dm7/C 4
6
G7/B 8
10 Time (s)
C 12
14
Am/C 16
D7/C 18
20
Figure 6: Chord recognition results after a smoothing process across 11 frames of an excerpt from Bach’s Prelude in C Major. Vertical lines denote manually annotated chord boundaries with chord names.
Chord Name
Frame−level recognition b a# a g# g f# f e d# d c# c B A# A G# G F# F E D# D C# C
HPCP EHPCP
E
16
G 17
D 18
19
Bm 21
20
G 22
23
Bm 24
25
Time (s)
Figure 7: Frame-level chord recognition results of an excerpt from The Beatles Eight Days a Week. Vertical lines denote manually annotated chord boundaries with chord names.
Chord Name
Smoothed over 11 frames b a# a g# g f# f e d# d c# c B A# A G# G F# F E D# D C# C 16
HPCP EHPCP
E
G 17
D 18
19
Bm 21
20
G 22
23
Bm 24
25
Time (s)
Figure 8: Chord recognition results after a smoothing process across 11 frames of an excerpt from The Beatles Eight Days a Week. Vertical lines denote manually annotated chord boundaries with chord names.