International Review of
Automatic Control (IREACO) Theory and Applications
Contents Chattering-Free Included Sliding Mode Control for an IM by A. Ltifi, M. Ghariani, M. Ayadi, R. Neji
673
Integrated CAD/CAE/CAM and RP for Scorbot-ER Vu Plus Industrial Robot Manipulator by N. Prabhu, M. Dev Anand, P. Classic Alex
681
A Neural Network Controller for a Temperature Control Electrical Furnace by A. El Kebir, A. Chaker, K. Negadi
689
A High Precision Angle Compensation Controller for Dish Solar Tracker Installed on a Moving Large Ship by Budhy Setiawan, Mauridhi Hery Purnomo, Mochamad Ashari
695
Optimal Placement and Sizing of Multiple Capacitors in Radial Distribution Systems Using Modified TLBO Algorithm by Manas Ranjan Nayak, Kumari Kasturi, Pravat Kumar Rout
701
A Backstepping Approach for Airship Autonomous Robust Control by Y. Meddahi, K. Zemalache Meguenni, M. Tahar, M. A. Larbi
714
Advanced Interactive Tools for Analysis and Design of Nonlinear Robust Control Systems by Kamen M. Yanev
720
Analysis of an Improved Single Input Fuzzy Logic Controller Designed for Depth Control Using Microbox 2000/2000c Interfacing by Aras M. S. M., S. S. Abdullah, Aziz M. A. A., A. F. N. A. Rahman
728
Design of Hybrid PWM Algorithm for the Reduction of Common Mode Voltage in Direct Torque Controlled Induction Motor Drives by V. Anantha Lakshmi, V. C. Veera Reddy, M. Surya Kalavathi
734
LMI Design of a Direct Yaw Moment Robust Controller Based on Adaptive Body Slip Angle Observer for Electric Vehicles by L. Mostefai, M. Denai, Khatir Tabti, K. Zemalache Meguenni, M. Tahar
745
Intelligent Control of a Small Climbing Robot by A. Jebelli, M. C. E. Yagoub, N. Lotfi, B. S. Dhillon
751
Design and Comparison of a PI and PID Controller for Effective Active and Reactive Power Control in a Grid Connected Two Level VSC by Rajiv Singh, Asheesh Kumar Singh
759
Introduction to the Discrete LSDP Controller and the Performance by Exploiting the Gap Metric Theory by Ali Ameur Haj Salah, Tarek Garna, Hassani Messaoud
767
Copyright © 2013 Praise Worthy Prize S.r.l. - All rights reserved
International Review of Automatic Control (I.RE.A.CO.), Vol. 6, N. 6 ISSN 1974-6059 November 2013
Chattering-Free Included Sliding Mode Control for an IM A. Ltifi, M. Ghariani, M. Ayadi, R. Neji Abstract – In this paper, a chattering-free Sliding Mode Controller based on Integrated Control (SMIC) is proposed to stabilize an IM torque. The proposed approach is designed for improving the system stability, behaviour and performance. The SMIC yield more accuracy and reduces the chattering resulting from the high frequency control switching. The controller performance is demonstrated via result of simulation in which the proposed controller effectiveness is compared to conventional SMC. Copyright © 2013 Praise Worthy Prize S.r.l. - All rights reserved.
Keywords: Linearization Input/Output, Sliding Mode Integrated Control, IM Torque Control, Chattering-Free SMC
Consequently, there is a need for robust control strategies. Various control approaches for the IM were proposed, in particular the adaptative control [1], the control by neuro-fuzzy network [2] and the control with variable structure [3]. An auto-adaptive solution, which by regulators parameters readjustment, makes it possible to preserve performances fixed in advance in the presence of disturbances and parameters variations. The variable-structure and associated sliding mode control is the subject of studies detailed during these thirty last years [4]-[5]-[6]. This theory is a robust control with respect to uncertainties on the model, of the disturbances and the radial forces handled. The sliding mode was largely used to control the nonlinear systems [7]-[8]. The idea is to make so that the dynamic equivalent system behaviour (when the condition of sliding is checked) becomes insensitive to the modelling errors and other disturbances [9]. Whereas, the principal disadvantage associated to SMC is the chattering (oscillation or disturbance on the level of the evolution of the parameters controlled). This phenomenon appears because the variable structure supposes that the control can be commutated infinitely quickly [10]-[11]. To avoid chattering different approaches have been proposed, such as higher-order sliding mode control (HOSMC) [12]–[13] and dynamic sliding mode control (DSMC) [14]–[15]. The higher-order sliding mode control (HOSMC) generalize the basic sliding mode idea acting directly on the higher order time derivatives of the sliding variable instead of influencing its first time derivative like it happens in standard sliding modes. The main problem in implementation of higher order sliding modes is the increasing information demand. Generally speaking, any r_th order sliding controller requires the knowledge of the time derivatives of the sliding variable up to the (r - 1)-th order. The dynamic sliding mode control (DSMC) is an augmented system
Nomenclature dr , qr
Rotor flux components
Vsd , Vsq
Stator voltage components
I sd , I sq
Stator current components Leakage factor Stator and rotor resistances
RS , Rr LS , Lr M sr Cem Cr J m S r SMC SMIC e1 , e2 ei1 , ei 2 n1 , n2 v1 , v2 w1 , w2 S , S 1
2
Si1 , Si 2
Stator and rotor inductances Mutual inductance The electromagnetic torque Load torque Moment of inertia of the IM Mechanical speed Stator pulsation Rotor time constant Sliding mode control Sliding mode integrated control Torque and flow errors (for SMC) Torque and flow errors (for SMIC) Order of system Torque and flow vectors control (for SMC) Torque and flow vectors control (for SMIC) Torque and flow sliding surfaces (for SMC) Torque and flow sliding surfaces (for SMIC)
I.
Introduction
The theories of traditional and modern control make it possible to control with precision the non disturbed linear processes with known parameters. Whereas, when the controlled part is subjected to disturbances or a great parametric variation such as IM torque control, it is very difficult to obtain an exact dynamic model. Manuscript received and revised October 2013, accepted November 2013
673
Copyright © 2013 Praise Worthy Prize S.r.l. - All rights reserved
A. Ltifi, M. Ghariani, M. Ayadi, R. Neji
which is a higher-order system compared with the original system. The main problem is the main idea of the approach was to change the dynamics in small vicinity of the discontinuity surface in the presence of several conditions for reached the trajectory to adapt of the sliding surface. However, the ultimate accuracy and robustness of the sliding mode are partially lost. In this contest, we propose a new variable structure control law based on a sliding mode integrated control system (SMIC). The SMIC allows oscillation elimination from the parameters controlled while basing on the sliding mode control law. It is a question of defining an integrated sliding surface according to the system states so that it is gravitational. The idea is to make so that the dynamic behaviour of the system reduces equivalent (when the condition of sliding is checked) becomes insensitive to modelling errors and other disturbances. The objective of this work is the study and establishment the control law to variable structure by an integrated sliding mode. We start with defining the MAS model fed in tension in the reference mark of Park [16], and then we develop an algorithm variable structure control with sliding mode integrated to controlled flow and electromagnetic torque. The controller performance is demonstrated via result of simulation in which the proposed controller effectiveness is compared to conventional SMC.
II.
v1 y réf
e
+
Surface
v2
-
Fig. 2. General principle diagram of the sliding mode control
A. Sliding mode control structure The sliding mode control consists in bringing the considered system state trajectory towards a sliding surface. The existence of the equivalent control is a necessary condition to ensure the existence of a sliding mode on the commutation surface S=0 [17]-[18]-[19][20]. The components v1 and v2 of the equivalent control linear system vector Vd [20]-[21]-[22], are defined by: v1 K1 K 3 K 2 e1 q1 sgn S1 l1 S1
(1)
K 5 e2 q2 sgn S 2 v2 K1 K3 l2 S2 K 4 .yd 3
(2)
B. Input/Output Linearization The technique of input/output linearization is a transformation into open loop of a nonlinear dynamic system to a linear system uncoupled to m entered (in our case m=2) having all its poles in the beginning. The fundamental idea of this approach makes it possible to express the system variables according to the entry sizes thanks to a nonlinear state return:
Sliding Mode Integrated Control SMIC
X ' f X D X u; y h X
The principal disadvantage associated to the sliding mode control is the "chattering" appearance. To reduce such negative effect, we propose the use the variable structure control by sliding mode integrated. The SMIC is a second integrated control in the sliding mode control. It consists in bringing each system point " N j " towards a
(3)
with: -
second sliding integrated surface ( Sij 0 ) so that it is
f and h are applications respectively of R n in R n and Rm :
f X f1 X
gravitational. The point " N j " is brought towards the intersection of
f1 X
two surfaces S and Sij . The oscillation on both sides of S=0 surface is eliminated until convergence towards the point from balance located on this S=0 surface.
f2 X
f3 X
f 4 X
T
Rr R dr M Sr r idS Lr Lr
f 2 X wS P m dr M Sr
SMIC
e’
y
E/S
S
Rr iqS Lr
SMC
SMIC
S=0
S=0 SMC N2
f3 X
Si2=0
e
N
M Sr Rr
1 2 dr LS LS Lr
2 M Sr Rr RS 2 Lr
idS wS iqS
N N2
Zoom
N3
f4 X
N3
Si3=0
N1
ei
N1
M Sr P mdr wS idS LS Lr
Si1=0
Fig. 1. General diagram of the sliding mode control SMC and sliding mode integrated control SMIC
Copyright © 2013 Praise Worthy Prize S.r.l. - All rights reserved
1 LS
2 M Sr Rr RS 2 L r
iqS
International Review of Automatic Control, Vol. 6, N. 6
674
A. Ltifi, M. Ghariani, M. Ayadi, R. Neji
-
X is the vector of state of dimension n=4:
X dr -
qr
iqS
idS
I/O system
T
u is the vector of entry of dimension m=2:
u VdS
VqS
'' C em
w1
' v1 C em
1/s
dr"
w2 v 2
dr'
1/s
1/s
C em
1/s
dr
y1 y d 1
y2 yd 2
T
Fig. 3. System obtained after linearization
-
D(x) is a matrix of dimension n×m whose columns are fields of vectors di x :
D d1
Ld 1 L f h2 X
d2
1 d1 0 0 LS
0
Ld 2 L f h2 X 0
T
1 d 2 0 0 0 LS
M Sr r LS
The state representation of the resulting system is written by: y'i Ai yi BiWi Ci (4)
T
where: -
y h X is the vector of exit of the system of
yi yi1
dimension m=2. The elements of the vector of exit h X are respectively the derivative electromagnetic h11 X and the derivative rotor flux h21 X : T
' h X h11 X h12 X Cem
r'
T
'' Cem y'i1 w1
' dr yi 2 ;
" dr y'i 2 w2
yi5 _ réf yi1 dt S1 Cem dt
yi 4
'
yi6 _ réf yi1 dt S2 r dt '
0 0 0 0 1 0 0 0 0 0 Ai Bi 1 0 0 0 0 0 1 0 0 0 0 0 w Ci Wi 1 S1 w2 S2
-
Ld 2 h1 X C4 C5 I Sd r C1 C6r
0 1 0 0
That is to say: ei1 and ei 2 are respectively the errors of torque and flow: ' (5) ei1 S1 Cem ' ei 2 S2 dr
The Lie derivative calculation for the derivative of flux leads also to:
L2f h2 X
T
yi 4
' Cem yi1 ;
yi 3
1 L VSq f1 X wS I Sq f1 X S 2R C3 P m f1 X C1 I Sq f1 X 3 M Sr P C6 I Sq f1 X r wS f3 X L f h1 X 2 Lr C5 I Sq f3 X C5 I Sd f 4 X r C1 f 4 X C6r f 4 X
yi 3
torque
To obtain the system linearization input/output, it is necessary to derive as many time as necessary the exit variables by the Lie derivative and the relative degree [23]-[24]. The Lie derivative calculation for the electromagnetic torque derivative leads then to:
Ld 1h1 X C4 r wS C5 I Sq
yi 2
(6)
C. SMIC, operation principle The control commutation must be at an infinite frequency and a null amplitude. The vector control generation wd is carried out by using the following rallying law:
1 M Sr f3 x f1 x r
Copyright © 2013 Praise Worthy Prize S.r.l. - All rights reserved
International Review of Automatic Control, Vol. 6, N. 6
675
A. Ltifi, M. Ghariani, M. Ayadi, R. Neji
Si' Qi sgn Si Li Si 0
E. Equivalent control calculation The equivalent control existence condition is defined by the Lyapunov equation [28]-[29]:
(7)
with:
Qi diag qi1 , qi 2 , ... ,qim , qij 0
Si Si' 0
Li diag li1 , li 2 , ... ,lim , lij 0
Si 1 Si1 , 2 Si 2 , ... , m Sim
By defining the function Si Si , the relation (3), (7) and (11) makes it possible to deduce the equivalent control from it wi [30]-[31].
T
The components w1 and w2 of the vector control wi linear system, are defined by:
Sij j Sij 0, j 0 0 D. Hyper surface commutation The general form suggested in [25]-[26]-[27] to determine the additional sliding surface is: d Si X dt
w1 Ki1 Ki 3 Ki 2 ei1 qi1 sgn Si1 li1 Si1 (13) w2 K i1 K i 3 K i 4 ei 2 qi 2 sgn Si 2 li 2 Si 2 (14)
n
e
(8)
i
Figs. 4 illustrate respectively the general control diagram based SMIC and the specific torque and flux control diagram for IM.
The two components of the hyper surface of commutation are defined as follows:
w1
y i réf
d Si1 dt
n1
e e i
i1
' Ki1 Si1 Cem Ki 2
ei
S
Surface
n2
(a) General control diagram based SMIC
Si1 Cem '
e e i
i2
C em _ réf
e1
+
Surface
S1
Surface
S i1
F(S1)
w1
C em 1/s
1/s
-
ei1
+
e i2
Ki 3 yi 6 _ réf yi 2 K i 4 yi 4 Ki 3 Si 2 r' Ki 4
yi
E/S
w2
(9)
-
d Si 2 dt
Surface
Si
-
e i1
Ki1 yi 5 _ réf yi1 Ki 2 yi 3
e
+
(12)
S
i2
r'
(b) Specific SMIC Control Diagram of torque IM
(10) r _ réf
e2
+ -
Surface
S2
ei 2
+
Surface
Si2
F(S1)
w2
r 1/s
1/s
-
with:
n1 n2 1
(c) Specific SMIC Control Diagram of flux IM Figs. 4. SMIC Control Diagram
To study the asymptotic state variables behaviour, we put the preceding equations in the following matrix form:
III. Simulation Results Si K i yi _ réf yi
(11)
To confirm the theoretical results, we have used the Matlab/Simulink software to simulate in real time the applied control. The control performance is defined by Stability in steady operation, answer Speed and the static error. The IM is started initially in neutral at t=60s the rotation direction is reversed and at t=100s is coupled with a load of Cr=20Nm.
with:
Ki1 0 Ki 2 0 Ki 0 Ki 3 0 Ki 4
yi _ réf
' Si1 Cem Si 2 r' yi ' Si1 Cem Si1 r'
A. SMIC simulation Fig. 5, illustrate respectively the general control diagram based SMIC and the specific torque control Diagram for IM.
Copyright © 2013 Praise Worthy Prize S.r.l. - All rights reserved
International Review of Automatic Control, Vol. 6, N. 6
676
A. Ltifi, M. Ghariani, M. Ayadi, R. Neji
40 reference
SMC
estimated
Electromagnetic Torque (Nm)
Electromagnetic Torque (Nm)
SMIC
30
motor 30
resistance torque 20
10
Zoom
0
-10
20
Zoom 10
0
-10
-20
-20 0
50
100
150
0
50
time (s)
100
150
time (s) 20.03 SMIC SMC 20.02
20.0002
E lec trom agnetic Torque (Nm )
20.01
20.0002 20
20.0002 19.99
20.0001 19.98
20.0001 19.97
20.0001
125
130
135
140
(a) Electromagnetic torque evolution
20.0001 141.95
142
142.05
142.1 time (s)
142.15
142.2
142.25 SMIC axe (d)
Fig. 5. Electromagnetic torque evolution by SMIC
SMIC axe (q) 1.2 SMC axe (d)
It is noted that the electromagnetic torque does not admit oscillations and reaches steady operation with a response time runs 0.09s. The machine rotation inversion answers is successful, it follows the trajectory without going beyond. The average of the error between the real electromagnetic torque and reference is almost null (0.015%). The “chattering” problem is negligible (less then 0.01%). B. Performance Comparison between SMC and SMIC Figs. 6 illustrate the performance comparison between SMC and SMIC, we represent the electromagnetic torque the rotor flux and speed evolution for IM. The Figure 6(a) is a comparative representation of electromagnetic torque defined by sliding mode integrated SMIC and the sliding mode SMC. The SMI is faster (shorter response time) than SM:
SMC axe (q)
Rotor Flow (Wb)
1
0.8
0.6
0.4
0.2
0
-0.2
0
50
100
150
time (s)
(b) Response of rotor flux 1500 SMCI SMC 1000
Velocity (rad/s)
tr _ SMIC 0.094s ; tr _ SMC 1.57s The "chattering" oscillation amplitude level for the SMI is negligible in front of SM ( ASMC 0.04Nm ; ASMIC 0.0001Nm ).
500
0
-500
-1000
A rotor flux comparative study is the subject of the Fig. 6(b) The flux response according to the axis (d) defined by the SMI is less sensitive to the direction inversion and to the load introduction that the SMC. The flux vector following the axis (q) is always equal to zero for the two sliding mode. The driving flux evolution, which exactly follows the wished instruction without going beyond, and the week static error, even at the load torque impact or at the direction inversion, show the sliding mode control robustness.
-1500 0
50
100
150
time (s)
(c) Evolution of the IM speed Figs. 6. Performance comparison between SMC and SMIC
Fig. 6(c) is a representation of the evolution IM speed for the two studied modes. The IM answer speed is similar to that of a first control system without going beyond, with a fast response time of about 1.16
Copyright © 2013 Praise Worthy Prize S.r.l. - All rights reserved
International Review of Automatic Control, Vol. 6, N. 6
677
A. Ltifi, M. Ghariani, M. Ayadi, R. Neji
seconds for the SMIC and 3.17 seconds for the SMC. Stability in steady operation confirms the good choice of the nonlinear controller. The SMIC is less sensitive (S) than SMC after the load introduction ( S SMIC 16% S SMC ).
"chattering" amplitude oscillation level of surfaces Si1 and Si2 is negligible in front of that of surfaces S1 and S2. The Figs. 9(a) and 9(b) represent the evolution of torque derived error (respectively flux) according to torque error (respectively flux). The influence of SMC or SMIC on the control is shown by two phases of control. The first phase represents the system response speed to join the sliding surface.
Figs. 7 illustrate the error comparison between SMC and SMIC, we represent the electromagnetic torque error the rotor flux error for IM. 1 SMIC 0.8
1500
SMC
SMIC SMC
1000
Surface S1-Si1
Error e2-ei2
0.6
0.4
0.2
0
500
0
-500
Zoom -1000
-0.2
-0.4
-1500
0
50
100
150
0
time (s)
50
100
150
time (s)
(a) Characteristic of the error between reference flux and reference flux SMIC
0.1
SMC
250 SMIC 200
0.05
SMC 150
Error e1-ei1
100
0
50 0
-0.05
-50 -100
-0.1
-150
134
-200 -250
136
138
140
142
144
(a) S1 sliding surface Evolution according to time 0
50
100
150 1
time (s)
(b) Characteristic of the error between the real torque and the torque reference
SMIC
0.8
SMC 0.6 0.4
Surface S2-Si2
Figs. 7. Error comparison between SMC and SMIC
The Figs. 7(a) and 7(b) represent the errors e1/ei1 and e2/ei2 between the real IM torques (respectively the IM flux) and torque it reference (respectively reference flux). The error time response determined by the SMIC is faster than the response time determined by SMC. - the response time of the ei1 error is equal to 1.43 seconds on the other hand the response time of the e1 error is equal to 5.22 seconds, so there is an amelioration of 72.61%. - the response time of the ei2 error is equal to 0.13 seconds on the other hand the response time of the e2 error is equal to 4.41 seconds , so there is an amelioration of 97.06%. Figs. 8 illustrate a comparison of the sliding surface evolution between SMC and SMIC. The Figs. 8(a) and 8(b) show the sliding surface evolution according to time. The surfaces evolution S1/Si1 and S2/Si2 passes to zero quickly. The
0.2 0
Zoom
-0.2 -0.4 -0.6 -0.8
-1 0.015 0
50
100
150
time (s)
SMIC SMC
0.01
0.005
0
-0.005
-0.01
-0.015 138.8
139
139.2
139.4
139.6
139.8
140
(b) S2 sliding surface Evolution according to time Figs. 8. Comparison of the sliding surface evolution between SMC and SMIC
Copyright © 2013 Praise Worthy Prize S.r.l. - All rights reserved
International Review of Automatic Control, Vol. 6, N. 6
678
A. Ltifi, M. Ghariani, M. Ayadi, R. Neji
The technique input/output linearization which has for principal interest of completion uncoupled the system to be controlled and thus to facilitate the design of its control. Its principal disadvantage remains the parametric sensitivity. To ensure a good control of the system obtained after input/output linearization, we applied the variable structure control by sliding mode and the conditions necessary to obtaining of a sliding mode to a surface of commutation to control the parameters of the asynchronous motor. The disadvantage of this mode control is the phenomenon of "chattering". To eliminate this phenomenon we developed a technique of variable structure control by sliding mode integrated and the conditions necessary to obtaining of a sliding mode on a surface of commutation without the phenomenon of "chattering". SMIC is a technique for improving and achieving the system stability to a desired behaviour, by adding a second integrated Sliding Mode Controller. This paper has presented the methodology definition of the integrated sliding surfaces. The prediction of the behaviour of different sliding mode dynamics is important for designing a sliding mode control and for achieving the sliding mode stability and furthermore, the system stability. Results obtained in simulation for IM SMI control show the robustness of this technique with respect to the load disturbances. In addition, convergence towards reference is ensured with complete “chattering” phenomenon elimination.
(a) Variation of derived torque error according to torque error 15
SMIC SMC TorqueDerivedError
10
References
5
[1]
Belai, I., Zalman, M., An effective predictive controller design for asynchronous motor, (2012) International Review of Automatic Control (IREACO), 5 (4), pp. 476-480. [2] Paulusova, J., Dubravska, M., Neuro-fuzzy predictive control, (2012) International Review of Automatic Control (IREACO), 5 (5), pp. 667-672. [3] U. Itkis, “Control System of Variable Structure” Edition Wiley, New York, 1976. [4] J.J.E. Slotine, and W. Li, “Applied Nonlinear Control”. Prentice – Hall. Inc., 1991. [5] Kumar, T.A., Ramana, N.V., Design of optimal sliding mode functional observer for load frequency control in multi-area deregulated thermal system, (2012) International Review on Modelling and Simulations (IREMOS), 5 (6), pp. 2532-2545. [6] X. Wang, J. Yang, X. Zhang, and J. Wu, “Sliding Mode Control of Active and Reactive Power forBrushlessDoubly-fed Machine”, ISECS Int. Colloquium On Computing, 2008. [7] Moutchou, M., Abbou, A., Mahmoudi, H., Induction machine speed and flux control, using vector-sliding mode control, with rotor resistance adaptation, (2012) International Review of Automatic Control (IREACO), 5 (6), pp. 804-814. [8] Ch. H. Fang, S. K. Lin, and Ch. M. Huang, “Sliding Mode Torque Control of Permanent Magnet Sytnchronous Motor” IEEE trans. Ind. Appl. pp. 578-583, 2001. [9] F. Plestan, Y. Shtessel, V. Brégeault, and A. Poznyak, “New methodologies for adaptive sliding mode control” Int. Journal of Control vol. 83, no. 9, pp.1907-1919, 2010. [10] A. Levant, “Chattering analysis”, IEEE Trans. On Automatic Control, vol. 55, no. 6, June 2010. [11] L. Fridman, “Chattering analysis in sliding mode systems with inertial sensors”, International Journal of Control, vol. 76, no. 9, pp. 906_912, 2003.
0
-5
-10
-15 -0.4
-0.2
0
0.2
0.4
0.6
0.8
1
Error of Torque
(b) Variation of flux derived error according to the flux error Figs. 9. Derived error according to error
This phase shows that the system evolution controlled by the SMIC is faster than that controlled by SMC:
te1 5.22s ; te 2 4.41s ; tei1 1.43s ; tei 2 0.13s The second phase ensures along this surface, the sliding and the maintenance trapped in the decision border, to reach the phase plan origin. The SMIC effectiveness is shown in the second phase by the oscillation amplitude level "chattering" which is negligible in front of that of SMC.
IV.
Conclusion
A chattering-free Sliding Mode Controller based on Integrated Control has been studied in this paper.
Copyright © 2013 Praise Worthy Prize S.r.l. - All rights reserved
International Review of Automatic Control, Vol. 6, N. 6
679
A. Ltifi, M. Ghariani, M. Ayadi, R. Neji
[12] G. Bartolini, A. Pisano, E. Punta, and E. Usai, ‘‘A survey of applications of second-order sliding mode control to mechanical systems’’, International Journal of Control, vol.76, pp. 875–892, 2003. [13] A. Levant, ‘‘Sliding order and sliding accuracy in sliding mode control’’, Int. J. Control, 58, pp. 1247–1263, 1993. [14] A.J. Koshkouei, and A.S.I. Zinober, ‘‘Robust frequency shaping sliding mode control’’, IEE Proc. Control Theory Appl., 147, pp. 312–320, 2000. [15] K.D. Young, and O. zguner, ‘‘Frequency shaping compensator design for sliding mode’’, Int. J. Control, 1993, 57, pp. 1005– 1019. [16] A. Elfadili, F. Giri, L. Dugard, and A. Elmagri, “Régulation de vitesse d’une machine asynchrone avec opimisation de la référence de flux” 6éme Conférence Int. Francophone d’Automatique CIFA, Nancy, 2010. [17] W. B. Gao and M. Cheng, “Quality of variable structure control systems,” Cont. Decision, vol. 4, no. 4, pp. 1-7, 1989. [18] I. Vadim Utkin, “Variable Structure Systems with Sliding Modes” IEEE Transactions On Automatic Control vol AC.22, N°2 , April 1977. [19] K. David Young, I. Vadim Utkin and U. Ozguner, “A Control Engineer’s Guide to Sliding Mode Control”, IEEE Transactions On Control Systems Technology, vol. 7, no. 3, MAY 1999. [20] Benharir, N., Zerikat, M., Chekroun, S., Mechernene, A., Design and analysis of a new fuzzy sliding mode observer for speed sensorless control of induction motor drive, (2012) International Review of Electrical Engineering (IREE), 7 (5), pp. 5557-5565. [21] W. S. Lin and C. S. Chen, “Robust adaptive sliding mode control using fuzzy modelling for a class of uncertain MIMO nonlinear systems” LEE Proc.-Control Theory Appl., vol. 149, no. 3, May 2002. [22] G. Jean-Marc, and R. Bruno, “Variété Invariante Intégrale de Systèmes Dynamiques”, rencontre du non-linéaire 2007. [23] J. Matas, L. García, J. Miret, M. Josep and M. Castilla, “Feedback Linearization of a Single-Phase Active Power Filter via Sliding Mode Control”, IEEE Transactions On Power Electronics, vol. 23, nO. 1, January 2008. [24] J.J. sotine, “sliding controller design for nonlinear systems”, Int. J. Control; vol.. 40, n°2, pp. 421-434,1984. [25] J.J. sotine, “Adaptie sliding controller synthesis for no-linear systems” IJC; vol.. 43, pp. 1631-1651, 1986. [26] C. H. Fang, C.M. Huang and S.K. Lin, “Adaptive sliding mode torque control of a PM synchronous motor” /LE Proc-Eccin t'mo Apld I'd 149. Ab 3, d4, 2002 [27] I. V. Utkin, “Sliding Mode Control Design Principles and Applications to Electric Drives”, IEEE Transactions On Industrial Electronics, vol. 40, no. 1, February 1993. [28] H. F. Ho, Y. K. Wong and A. B. Rad, “Adaptive Fuzzy Sliding Mode Control Design : Lyapunov Approach” Control Conférence 5th Asian, 2004. [29] J. E. Meyer, S. E. Burke and Jr. Hubbard, “Fwzy Sliding Mode Control for Vibration Damping of Flexible Structures”, Proc. of the Society of Photooptical Instrumentation Engineering, SPZE, vol. 1919, ch. 34, pp. 182-183, 1993. [30] E. W. McGookin, “'Sliding Mode Control of a Submarine”, MEng. Thesis, E.E. & E. Dept., University of Glasgow, 1993. [31] M. Zribi, H. Sira-ramirez and A. Ngai, “'Static and Dynamic Sliding Mode Control for a permanent magnet stepper motor”, Int. J. Control, vol.74, no. 2, pp. 103-117, 2001.
Authors’ information Electric Vehicle and Power Electronics Group (VEEP), Laboratory of Electronics and Information Technology (LETI), University of Sfax, Sfax,Tunisia, National School of Engineers of Sfax, B.P. 1173 3038 Sfax Tunisia. Arafet Ltifi was born in Gabes, Tunisia, in 1977. He received his Engineering Diploma and the Master in electric engineering from the Ecole Nationale d’Ingénieurs de Sfax - Tunisia at 2004 and 2007 respectively. He is a member of Laboratory of Electronic and Information Technology Sfax (LETI). He is currently reading for a Ph D degree in the induction machine order and performance improvement of electric vehicle. E-mail:
[email protected] Moez Ghariani was born in Sfax, Tunisia, in 1971. He received the B.Sc. degree in electrical engineering from the National School of Engineers of Sfax, in 1996, the M.Sc. degree in electrical engineering from the National School of Engineers of Sfax, in 1997, and the Ph.D. degree in electrical engineering from National School of Engineers of Sfax, in 2003. After receiving the Ph.D. degree, he joined the Department of Electrical Engineering in International School of Electronic and Communication of Sfax (ISECS), University of Sfax, , Tunisia, where he is an Associate Professor. He joined the Laboratory of Electronics and Information Technology (LETI), Electric Vehicle and Power Electronics Group (VEEP). His main research interests include analysis, design, and control of electric machines for EV applications E-mail:
[email protected] Rafik Neji was born in Sfax (Tunisia) in 1958. He received his Maîtrise and the Diplôme d’Etudes Aprofondies in electrical engineering from the Ecole Normale Supérieure de l’Enseignement Technique de Tunis-Tunisia in 1983 and 1985 respectively, the Doctorat and the Habilitation Universitaire in electrical engineering from the Ecole Nationale d’Ingénieurs de Sfax-Tunisia in 1994 and 2006 respectively. He is currently a Professor in the Department of Electrical Engineering of National School of Engineers of Sfax-Tunisia. He is a member of Laboratory of Electronic and Information Technology (LETI-Sfax). His current research interests include field of electrical machines and power system design, identification, and optimisation. He is author and coauthor of more than 20 papers in international journals and of more than 50 papers published in national and international conferences. In addition, he is also a reviewer for many renomed journals in the already mentioned field. E-mail:
[email protected]
Copyright © 2013 Praise Worthy Prize S.r.l. - All rights reserved
International Review of Automatic Control, Vol. 6, N. 6
680
International Review of Automatic Control (I.RE.A.CO.), Vol. 6, N. 6 ISSN 1974-6059 November 2013
Integrated CAD/CAE/CAM and RP for Scorbot-ER Vu Plus Industrial Robot Manipulator N. Prabhu1, M. Dev Anand2, P. Classic Alex3 Abstract – Robots are required to operate at different environmental conditions facing varieties of end-effector to workspace interactions. This paper deals with integrated CAD/CAE/CAM and RP for SCORBOT-ER Vu plus Industrial robot manipulator. It is a 5-DOF of vertical articulated robot and all the joints are revolute. Most parts of robot were three-dimensionally designed with 3D CAD, which enables effective connection with CAE analyses, the basis of which lays in kinematic simulation and structural analysis. CATIA was used to implement the cutting simulation of the robot master parts. To reduce the lead time and investment cost of developing parts, RP and CAM are selectively used to manufacture master parts for the robot body. Finally, a CAD/CAE/CAM and RP integrated system for a robot manipulator was developed. This integrated system not only promotes automation capabilities for robot manipulator production, but also simplifies the CAD/CAE/CAM and RP process for a robot manipulator. This integrated system is useful for developing automated computer-aided mechanism design and manufacturing scenario. Copyright © 2013 Praise Worthy Prize S.r.l. - All rights reserved.
Keywords: CAD/CAE/CAM, RP, Robot Manipulator, CNC Milling, Pro/E, CATIA, Simulation
dull, dirty or dangerous. Robotics constitutes the study of a finite number of rigid mechanical chains representing a multi-variable non-linear coupled system. Manipulative robots are highly non-linear with expressive couplings between subsystems. A number of studies have dealt with the principles of CAD/CAE/CAM integrated systems. Lee and Chen [1] described the development of an automatic wheelchairlifting device fixed inside a full-size van. The development process included the mechanism’s conceptual design, motion simulation, engineering analysis, prototype development and testing. Lai [2] used interactive and menu driven methods to development computer-aided instruction software for the kinematics and inverse kinematics of a manipulator to learn how to make the transformation matrix manipulator friendly. Based on features modeling, Pro/E is a parametric modeling tool, which is produced by PTC.
Nomenclature 2D 3D CAD CAE CAM CAPP CATIA CE CNC DOF IGES MCAE PD PTC Pro/E RFWC RP RP&M Z Corp.’s UG
2Dimensional 3Dimensional Computer Aided Design Computer Aided Engineering Computer Aided Manufacturing Computer Aided Process Planning Computer Aided Three Dimensional Interactive Applications Concurrent Engineering Computerized Numerical Control Degrees of Freedom Initial Graphics Exchangeable Specifications Mechanical Computer Aided Engineering Proportional Derivative Parametric Technical Corporation Pro Engineer Robotic Filament Winding Complex Rapid Prototype Rapid Prototyping and Manufacturing Z Corporation Unigraphics
I.
II.
Past Studies and Investigation
Different researchers did the various investigations about CAD/CAE/CAM integration. The results were Summarizes as follows. The Muhammad Ikhwan Jambak et al., [3] parametric modeling method means that the designer could set the parameter to drive the geometry size of the part and could remodel the part easily by changing the parameter. Lubomir Markov et al., [4] described the analysis of some notable existing RFWC. It features a specialized CAD/CAM software package for winding pattern
Introduction
Robots are traditionally used in industrial automation. The definition of a robot in its simplest term is a computer whose primary purpose is to produce motion patterned after human functions. A robot takes over work done by humans that demands a high degree of precision,
Manuscript received and revised October 2013, accepted November 2013
681
Copyright © 2013 Praise Worthy Prize S.r.l. - All rights reserved
N. Prabhu, M. Dev Anand, P. Classic Alex
generation and analysis of the part to be produced, a mechanical assemblage of winding and handling subsystems with the corresponding control. Radostina Petrova and Sotir Chernev [5] developed an integrated technology of CAD modeling and CAE analysis of a basic hydraulic cylinder is a part of the long-lasting strategy of company “HES” PLC, Jambol for increase of quality and production control, for bettering of the working environment, etc. They used CAD modeling and flow simulation analysis of a hydraulic cylinder in Solid Work environment. Javier Andres, Luis Gracia and Josep Tornero [6] described the implementation of a post processor to adapt the tool path generated by a CAM system to a complex work cell of eight joints (namely, a Kukakr15/2 manipulator mounted on a linear track and synchronized with a rotary table), devoted to the rapid proto typing of 3D CAD- defined products. Previously, it evaluates several Redundancy Resolution Schemes at the joint-rate level for the configuration of the post processor, dealing not only with the additional joints but also with the redundancy due to the symmetry on the milling tool. The use of these redundancies is optimized by adjusting two performance criterion vectors related to both singularity avoidance and maintenance of a preferred reference posture, as secondary tasks to be done during the path tracking. In addition, two proper fuzzy inference engines actively adjust the weight of each joint in these tasks. Zhenyu Liu, Wanghui Bu and Jianrong Tan [7] proposed the integration of CAD/CAPP/CAM and feature mapping algorithm, which converts the design features of the work pieces to the machining features of the seams. Then a motion navigation method based on feature mapping in a simulation environment is proposed. This method comprises initial position guiding and seam tracking. For initial position guiding, a motion path with the least energy consumption is generated based on the weighted optimal control; then the path is revised for avoiding obstacles by setting the path tags dynamically. For seam tracking, the seam is dispersed into discrete welding points; then the welding gun moves through each point according to the welding sequence. The method is implemented in the development of an off-line programming simulation system. Simulation is the process of designing a model of an actual or theoretical physical system, executing the model, and analyzing the execution output. The robotic simulation package is a tool which is used to create embedded applications for a specific robot without depending “physically” on the actual robot, thus saving cost and time. Most robotic simulation packages have their own unique features, but the main features for 3D modeling are robot rendering and environment [8] and [9]. Naoki Uchiyama et al., [10] presented a model reference control approach for a human-operated robotic system. This approach incorporates commands given by
a human operator and compensates for mistakes made by the operator in real-time, and is applied to achieve collision avoidance of the robotic manipulator. This method employs inexpensive distance sensors to achieve real-time collision avoidance. The effectiveness of this method is also confirmed by an experiment in which an unskilled operator uses the manipulator in a narrow space. Samer Yahya et al., [11] focused on the methods used to optimize singularity avoidance of manipulators. Most of these methods based on the manipulator Jacobian Pseudo inverse, but in the case of hyper redundant manipulators with a high number of degrees of freedom, the computational burden of pseudo inverse Jacobian becomes prohibitive, despite proposed improvements. And also all the well-know methods that deal with inverse kinematics of redundant manipulators and using to optimize the singularity avoidance and no matter whether this method is based on Jacobian Pseudo inverse or not. Amran Mohd Zaid and M. Atif Yaqub [12] described a new robotic hand system with master slave configuration. Bluetooth is being used as the communication channel between the master and slave for the tele-operation. The master is a glove that a human operator can wear. The glove has been embedded with many sensors to detect the movement of every joint present in the hand. This joint movement is transferred to the slave robotic hand that will mimic the movement of human operator. The UTHM robotic hand is a multi fingered dexterous anthropomorphic hand. The hand comprises of five fingers (four fingers and one thumb) each having four degrees of freedom (DOF) which can perform flexion, extension, abduction, adduction and also circumduction. For the actuation purpose, pneumatic muscles and springs are used. Lee and Chang [13] proposed a CAD/CAE/CAM integrated system for robotic prototyping. The system uses Matlab to solve for the position of the manipulator based on the Denavit-Hartenburg coordinate transformations. Pro/E was used to construct the robot manipulator parametric solid models, Pro/Mechanica was used to simulate the dynamic simulation and working space, MasterCAM was used to implement the cutting simulation, and the prototype was manufactured using a CNC milling machine. Finally, a CAD/CAE/CAM integrated system for a robot manipulator was developed. Jou [14] using a parametric CAD system to express design concepts into solid models. Press moulds were developed, followed by mould manufacturing using a CAM system. Mould testing; powder formation, sintering and post-sintering procedures were conducted in professional powder metallurgy factories through cooperation with industry, to produce the final powder metallurgy products. Xu et al., [15] built an injection mould CAD/CAE/CAM system by integrating the injection mould CAD/CAM software, based on the UG-II universal CAD/CAM system, with the injection mould CAE software. A number of studies have dealt with the principles of robot and internet control.
Copyright © 2013 Praise Worthy Prize S.r.l. - All rights reserved
International Review of Automatic Control, Vol. 6, N. 6
682
N. Prabhu, M. Dev Anand, P. Classic Alex
Xue Yan and P Gu [16] derived the RP systems offer the opportunities to make products faster and usually at lower costs than using conventional methods. Since Rapid Prototyping and Manufacturing can substantially reduce the product development cycle time, more and more businesses are taking advantage of the speed at which product design generated by computers can be converted into accurate models that can be held, viewed, studied, tested, and compared. Several new and promising RP&M techniques were discussed. They are all based on material deposition layer by layer. Each of them has particular features in terms of accuracy, material variety and the cost of the machine. Some present problems and research issues were also discussed. This is a rapid development area. Capacities and the potential of rapid prototyping technologies have attracted a wide range of industries to invest in these technologies. It is expected that greater effort is needed for research and development of those technologies so that they will be widely used in product-oriented manufacturing industries. Keun Park, Y.S. Kim, C.S. Kim and H.J. Park [17] presented the hardware development of a mid-size humanoid robot, Bonobo, focusing on the use of an integrated application of CAD/CAM/CAE and RP for the rapid development of the robot’s outer body parts. Most parts were three-dimensionally designed with 3D CAD, which enables effective connection with CAE analyses, the basis of which lays in kinematic simulation and structural analysis. To reduce the lead time and investment cost of developing parts, RP and CAM are selectively used to manufacture master parts for the body. These master parts are then replicated by using a vacuum casting process, from which we can repeatedly obtain plastic parts. Ying-Chien Tsai and Wern-Kueir Jehng [18] proposed a systematic method to design and synthesize spherical gear sets in space. Based on the kinematics of spherical mechanisms, a parametric mathematical model for spherical gear sets with skew axes is presented and a computer solid-model for spherical gears is designed and formed. Using the gear solid-model database, non-ambiguous data set descriptions of RP and RP&M machines have been generated. A design example is presented to demonstrate RP&M procedures for the surface generating of a complex spherical gear set with skew axes. The result of this work can be of crucial benefit in research in new gear types and industrial development. This work, important detail techniques are also proposed for the solid-models of CAD/CAM systems, describing how they can be converted successfully into the RP&M system, and built up gear set models. Yuchun Sun, Peijun Lü and Yong Wang [19] explored a method for fabricating removable complete denture aided by CAD&RP technology. 3D crossing section scanner and laser scanner were respectively applied to obtain the surface data of artificial teeth, edentulous models and rims made in clinic. The
vertical and horizontal relations of models were recorded before scanning with a special device. A 3D graphic database of artificial teeth, which can be aligned with parameters, was established. Special CAD software developed by ourselves was applied to the 3D integrated design process including automatic setting up artificial teeth, semiautomatic designing aesthetic and individualized artificial gingival and base plate, automatic constructing individualized virtual flasks according to the finished CAD digital models of removable complete denture. At last, 3DP technology was used to make the individualized physical flasks. Bor-Tsuen Lin, ChunChih Kuo [20] introduced an integrated RE/RP/CAD/CAE /CAM system for constructing a magnesium-alloy AZ31 shell for the mobile phone and developing related progressive dies using CE. This integrated system uses an optical scanning system, a rapid prototyping machine (SOUP600), a CAD/CAE/CAM software (CATIA), a sheet metal forming simulation software (DYNAFORM), a CAM software (POWERMILL), and a die design knowledgebased system as the operating platform. The die design knowledge-based system includes die design procedures, die design standards, design criteria, and empirical formulae. The system has been used successfully in constructing a magnesium-alloy AZ31 shell for the mobile phone and developing related progressive die. Since the entire development process shares the same 3D geometric model, the various process of developing dies can be performed in parallel. This system can greatly reduce the development time and cost, improve the product quality, and push products into the market in a relatively short time.
III. Scorbot- ER Vu Plus Industrial Robot The SCORBOT-ER Vu plus is a 5-DOF of vertical articulated robot and all the joints are revolute. This design permits the end-effector to be positioned and oriented arbitrarily within a large work space. Each joint is restricted by the mechanical rotation its limits are shown below. Joint Limits: Axis 1: Base Rotation: 310º Axis 2: Shoulder Rotation: +130º / -35º Axis 3: Elbow Rotation: ±130º Axis 4: Wrist Pitch: ±130º Axis 5: Wrist Roll: Unlimited (Mechanically): ±570° (Electrically) The mechanical rotations of arm links and joints of the ER-Vu plus are illustrated [21] in Fig. 1 to Fig. 5. The work volume is developed for an existing robot called SCORBOT-ER Vu plus using Pro/E as shown in the Fig. 6 and Fig. 7.
IV.
System Structure
The procedures of the presented system are as follows:
Copyright © 2013 Praise Worthy Prize S.r.l. - All rights reserved
International Review of Automatic Control, Vol. 6, N. 6
683
N. Prabhu, M. Dev Anand, P. Classic Alex
A. Computer-Aided Drawing Pro/Engineer’s basic package provides a module for creating orthographic drawings. Within drawing mode, detailed multi-view drawings can be created from existing models. Dimensions used to create a part (referred to as parametric dimensions) can be revealed in drawing mode to document a design. Parametric dimension values can be modified in drawing mode with the changes reflected in other modules of Pro/E. With the concepts of parametric design and unitary database, Pro/E was used to draw the 3D part and assemble the robot solid models.
Pro-Mechanica provides an open flexible MCAE environment for multi disciplinary design analysis and simulates product performance and manufacturing processes. Material properties, constraints and drivers are applied on the model to simulate the working space.
Fig. 3. Shoulder Rotation
Fig. 1. Base Rotation
Fig. 4. Elbow Rotation
Fig. 2. Shoulder Rotation
B. Computer-Aided Analysis In order to evaluate robot design in the real world by creating virtual prototypes, the robot assembly solid model was transferred to Pro/Mechanica (which is integrated with the Pro/E System).
Fig. 5. Wrist Pitch
Copyright © 2013 Praise Worthy Prize S.r.l. - All rights reserved
International Review of Automatic Control, Vol. 6, N. 6
684
N. Prabhu, M. Dev Anand, P. Classic Alex
products. In order to implement virtual prototyping for the special robot manipulator, we used three modes of Pro/E file to draw and assemble each part of the robot manipulator parametric solid model. In Part Mode, we created part files (.prt), the separate components that are joined together in an assembly file (.asm). Part mode lets we create and edit the features–the extrusions, cuts, blends, and rounds–that comprise each part being modeled. After creation of the parts, we created an empty assembly file for the model, then assemble the individual parts within it, assigning the positions the parts will occupy in the final product. We can also define exploded views to better examine or display part relationships. Drawing mode lets we create finished, precise mechanical drawings of the design, based directly on the dimensions recorded in the 3D part and assembly files. In fact, it is not necessary to add dimensions to objects as we may have done in other programs. Instead, in Pro/E we selectively show and hide dimensions that have been passed from the 3D models. In designing the body parts, we also considered their assemble ability with other parts such as motors and gears. Figure 8 shows an exploded view of all parts assembly, and Figure 9 shows the totally assembled model of SCORBOT-ER Vu plus robot manipulator.
Fig. 6. Work volume (Top View)
B. Kinematic Analysis Pro/MECHANICA offers dramatic improvements in modeling assemblies and simulation. In the past, assemblies were painstaking to model partly because, once compressed, the components were often no longer in contact. We then needed to modify part locations (artificially interpenetrate parts by half the material thickness), define connections such as welds, or modify the shell pair placement. With these assembly modeling enhancements, Pro/MECHANICA detects where components are in contact. The software automatically ties the displacements and rotations of the contacting surfaces or edges together in the compressed model. Pro/E Foundation alone represents a comprehensive kinematic simulation tool for mechanism design without requiring any additional modules. First, create measures for the velocity and acceleration of a point or joint. Then create and run a kinematic analysis.
Fig. 7. Work Volume (Side View)
C. Computer-Aided Manufacture The CATIA Version 5 Part Design application makes it possible to design precise 3D mechanical parts with an intuitive and flexible user interface, from sketching in an assembly context to iterative detailed design. In order to implement cutting simulation with CATIA, the Pro-E file is converted into IGES and then imported into CATIA and verified further. Finally, Pro-E file is imported to RP machine, and then the robot prototype manufactured.
V.
Methodology
A. Solid Model Design Solid modeling technology can not only greatly reduce the development period, but also effectively increase the design quality and manufacturing of the industrial
Fig. 8. Shows an exploded view of all parts assembly
Copyright © 2013 Praise Worthy Prize S.r.l. - All rights reserved
International Review of Automatic Control, Vol. 6, N. 6
685
N. Prabhu, M. Dev Anand, P. Classic Alex
Fig. 12. Collision
In order to complete cutting simulation with CATIA, we defined cutting parameters (such as contour depth, tool diameter, spindle speed, feed rate, depth cut, diameter offset), tool path generation. Fig. 13 and Fig. 14 show the oscillating arm cutting simulation (Milling, Facing & Drilling).
Fig. 9. Shows the totally assembled model of SCORBOT-ER Vu plus robot manipulator
The velocity and acceleration measure data can be graphed or displayed as animated vector arrows during playback of the analysis. In order to predict kinematic analysis results of the robot before manufacture, Pro/MECHANICA to define robot assembly model, in order to complete the robot manipulator kinematic constraint model. Define items include: coordinate system, material properties, drivers, constraint, then completed the robot manipulator kinematic constraint model, dynamic simulation and working space. Fig. 10 shows the kinematic constraint model of SCORBOT-ER Vu plus Robot. Pro/Mechanica software also allows viewing and detecting collisions between the graphic objects of the current animation model during simulations. Fig. 11 shows the safe working limit of the robot gripper. Red color in Fig. 12 indicates the collision.
Fig. 13. Oscillating Arm Cutting
C. Manufacture Process i. Simulation of robot part In order to perform the planning process of robot manipulator manufacturing. The Pro-E file is converted into IGES and then imported into CATIA.
Fig. 14. Oscillating Arm Cutting Simulation (Milling) Simulation (Facing & Drilling)
Fig. 10. SCORBOT-ER Vu plus Robot kinematic constraint model
D. Prototype of Robot Part Rapid Prototyping Technologies has taken enormous strides in the production of robot manipulator. It is used to fabricate physical objects directly from CAD data sources. Z Corp.’s 3D printer technology is used to manufacture the robot arm prototype through 3D source data, which often takes the form of CAD models. Mechanical CAD software packages, the first applications to create 3D data, have quickly become the
Fig. 11. Safe limit of gripper
Copyright © 2013 Praise Worthy Prize S.r.l. - All rights reserved
International Review of Automatic Control, Vol. 6, N. 6
686
N. Prabhu, M. Dev Anand, P. Classic Alex
standard for nearly all product development processes. Due to the widespread adoption of 3D-based design technologies, most industries today have already created 3D design data and are capable of producing physical models with 3D printers from Z Corp. The software that drives Z Corp.’s 3D printers accepts all major 3D file formats, including .stl, .wrl, .ply, and .sfx files, which leading 3D software packages can export. After exporting a solid file from a 3D modeling package, users can open the file in ZPrint, the desktop interface for Z Corp.’s 3D printers. When a user decides to print the job, ZPrint software sends 2D images of the cross sections to the 3D Printer via a standard network, just as other software sends images or documents to a standard 2D printer. These printers use standard inkjet printing technology to create parts layer-by-layer by depositing a liquid binder onto thin layers of powder. The Z Corp. system requires powder to be distributed accurately and evenly across the build platform. 3D Printers accomplish this task by using a feed piston and platform, which rises incrementally for each layer. A roller mechanism spreads powder fed from the feed piston onto the build platform; intentionally spreading approximately 30 percent of extra powder per layer to ensure a full layer of densely packed powder on the build platform. The excess powder falls down as an overflow chute, into a container for reuse in the next build. Once the layer of powder spreads, the inkjet print heads print the cross-sectional area for the first, or bottom slice of the part onto the smooth layer of powder, binding the powder together. A piston then lowers the build platform and a new layer of powder is spread on top. The print heads apply the data for the next cross section onto the new layer, which binds itself to the previous layer. ZPrint repeats this process for all of the layers of the part. The 3D printing process creates an exact physical model of the geometry represented by 3D data. Process time depends on the height of the part or parts being built. Typically, Z Corp.’s 3D printers build at a vertical rate of 25mm – 50mm per hour. Z Corp. technology does not require the use of solid or attached supports during the printing process, and all unused material is reusable. Figs. 15 (a) and (b) show RP model for the upper arm right side plate (width and thickness wise).
Fig. 15(b). RP model for the upper arm right side plate (Thickness wise)
VI.
Conclusion
Considering all the factors in this scenario, integrated CAD/CAE/CAM and RP system for SCORBOT-ER Vu plus industrial robot manipulator was developed. This integrated application of CAD/CAE/CAM and RP was then systematically performed from the feasibility study of the design of the robot parts to manufacture and to assemble all the robot parts. Through this integrated approach, we successfully developed a simulation using CATIA and prototype model of oscillating arm of robot part using 3D printer. These simulation and prototype enhanced visualization of the robot motion for different input motions, finding the work volume, overall system performance. This system not only promotes automation capabilities for robot manipulator production, but also simplifies the CAD/CAE/CAM and RP process, product development procedure.
Acknowledgements This work was supported by Noorul Islam Centre for Higher Education. The first author would like to acknowledge the lab facilities provided by the Department of Mechanical Engineering. Special Thanks go to Dr. M. Dev Anand, Professor of Mechanical Engineering Department, for his strong assistance and guidance.
References [1]
[2]
[3] [4]
[5]
[6] Fig. 15(a). RP model for the upper arm right side plate (Width wise)
Copyright © 2013 Praise Worthy Prize S.r.l. - All rights reserved
M.Y. Lee, S.H. Chen, Design and development of an automated wheelchair lifting device, Journal of Technology, Vol. 16 n. 1 (2001), pp.45–50. Y.S. Lai, Development of computer-aided instruction software for the manipulator kinematic and reverse kinematic, in: Proceedings of the Sixth Conference on Technology and Vocational Education, 22–23 March 1991, Taipei, pp. 20234–20239. Muhammad Ikhwan Jambak, Habibollah Haron, Helmee Ibrahim and Norhazlan Abd Hamid, Robotic Modelling and Simulation. Lubomir markov and Richard M. H. Cheng, Conceptual Design of Robotic Filament Winding Complexes, Pergamon, Mechatronics, Vo. 6, n. 8, 1996, pp.881-896. Radostina Petrova and Sotir Chernev. Integrated Technology for CAD Modeling and CAE Analysis of a Basic Hydraulic Cylinder, Finite Volume Method – Powerful Means of Engineering Design, 2007. Javier Andres, Luis Gracia and Josep Tornero, Implementation and Testing of a CAM Postprocessor for an Industrial Redundant Workcell with Evaluation of Several Fuzzified Redundancy
International Review of Automatic Control, Vol. 6, N. 6
687
N. Prabhu, M. Dev Anand, P. Classic Alex
[7]
[8]
[9] [10]
[11]
[12]
[13]
[14]
[15]
[16]
[17]
[18]
[19]
[20]
[21]
Resolution Schemes, Journal of Robotics and ComputerIntegrated Manufacturing, Vol.28, 2012, pp. 265–274. Zhenyu Liu, Wanghui Bu and Jianrong Tan, Motion Navigation for Arc Welding Robots Based on Feature Mapping in a Simulation Environment, Journal of Robotics and ComputerIntegrated Manufacturing, Vol. 26, 2010, pp. 137–144. Muhammad Ikhwan Jambak, Habibollah Haron, Dewi Nasien. Development of Robot Simulation Software for Five Joints Mitsubishi RV-2AJ Robot using MATLAB/Simulink and VRealm Builder, Fifth International Conference on Computer Graphics, Imaging and Visualization, IEEE, 2008. R K Mittal, J Nagrath, "Robotics and Control", Tata McGrawHill, 2005, pp. 76-81. Naoki Uchiyama, Yuichi Osugi, Yuichiro Kajita, Shigenori Sano, Shoji Takagi, Model Reference Control for Collision Avoidance of a Human-Operated Robotic Manipulator, (2010) International Review of Automatic Control (IREACO), 3. (2), pp. 219-225. Samer Yahya, M. Moghavvemi, Haider A. F. Mohamed, A Review of Singularity Avoidance in the Inverse Kinematics of Redundant Robot Manipulators, (2011) International Review of Automatic Control (IREACO), 4 (5), pp. 807-814. Amran Mohd Zaid, M. Atif Yaqub, UTHM HAND: Design of Dexterous Anthropomorphic Robotic Hand, (2011) International Review of Automatic Control (IREACO), 4 (6), pp. 969-976. Lee, H.S. and S.L. Chang,. Development of a CAD/CAE/CAM System for a Robot Manipulator, Journal of Materials Processing Technology, Vol. 140, 2003, pp. 100-104. M. Jou, A Study of Automatic Design and Manufacturing of Metal and Ceramic Powder Processed Products, Journal of Technology, Vol. 15, n. 3, 2000, pp. 463–468 (in Chinese). Y. Xu, Z.Y. Wang, R.Q. Huang, Y.Q. Zhang, System integration of injection mould CAD/CAE/CAM, J. Shanghai Jiaotong University, Vol. 32, n. 1, 1998, pp. 26–29 (in Chinese). Xue Yan and P Gu. A Review of Rapid Prototyping Technologies and Systems, Journal of Computer Aided Design, Elsevier. Vol. 28, n. 4, 1996, pp. 307-318. Keun Park, Y.S. Kim, C.S. Kim and H.J. Park. Integrated Application of CAD/CAM/CAE and RP for Rapid Development of a Humanoid Biped Robot, Journal of Materials Processing Technology, Vol.187–188, 2007, pp. 609–613. Ying-Chien Tsai and Wern-Kueir Jehng. Rapid Prototyping and Manufacturing Technology Applied to the Forming of Spherical Gear Sets with Skew Axes, Journal of Materials Processing Technology, Vol. 95, 1999, 169-179. Yuchun Sun, Peijun Lü and Yong Wang., Study on CAD&RP for Removable Complete Denture, Journal of Computer Methods and Programs in Biomedicine, Vol. 93, 2009, pp. 266–272. Bor-Tsuen Lin, Chun-Chih Kuo, Application of an Integrated RE/RP/CAD/CAE/CAM System for Magnesium Alloy Shell of Mobile Phone, Journal of Materials Processing Technology, 2009, pp. 2818–2830. SCORBOT-ER Vu Plus User's Manual, 3rd Edition, Intelitek Inc., Catalog # 100016 Rev. C, February 1996
Authors’ information 1
Assistant Professor/Research Scholar, PSN College of Engineering and Technology/Department of Mechanical Engineering, Noorul Islam Centre for Higher Education, Tirunelveli – 627152. Phone: +91 9789449362. 2
Professor and Deputy Director Academic Affairs, Department of Mechanical Engineering, Noorul Islam Centre for Higher Education, Kumaracoil - 629 180, India. 3
PG Student, Lord Jegannath College of Engineering and Technology, Ramanachithan Puthoor, Nagercoil, Kanyakumari District - 629 402, Tamilnadu, India. N. Prabhu is an Assistant Professor in the Department of Mechanical Engineering, PSN College of Engineering and Technology, Tirunelveli, India. He is also a Research Scholar in the Department of Mechanical Engineering, Noorul Islam Centre for Higher Education, Kumaracoil, India. He completed his BE (Mechanical) from Government College of Engineering, Tirunelveli in the year 2000, ME (Engineering Design) from Government College of Engineering, Tirunelveli in the year 2005. His profession is teaching in Various Engineering Colleges. He is a member of the IE and Life Member of ISTE. E-mail:
[email protected] Dr. M. Dev Anand is a Professor and Deputy Director Academic Affairs in the Department of Mechanical Engineering, NICHE, Kumaracoil, India. He completed his BE (Mechanical) from NEC, Kovilpatti in the year 1998 affiliated to Manonmaniam Sundaranar University, Tirunelveli, ME (Production) from Annamalai University, Chidambaram in the year 2000, his PhD under MHRD-TEQIP scheme from NIT, Tiruchirapalli in the year 2008. He worked as R&D Engineer in Biomedical Instrumentation Company, Karnataka and served as Faculty & Administrator in various Engineering Colleges. He has published more than 60 papers in national and international conferences, 20 papers in international journals and nine in national journals. He is a member of the IE (India) and Life Member of ISTE, IIPE and IAM&M. His research interests are Advances in Manufacturing Technology, Optimization, Automation and Robotics. E-mail:
[email protected] P. Classic Alex is doing M.E (Manufacturing Engineering) in Lord Jegannath College of Engineering and Technology. He completed his B.E (Mechanical) from SUN College of Engineering and Technology, Nagercoil in the year 2009. E-mail:
[email protected]
Copyright © 2013 Praise Worthy Prize S.r.l. - All rights reserved
International Review of Automatic Control, Vol. 6, N. 6
688
International Review of Automatic Control (I.RE.A.CO.), Vol. 6, N. 6 ISSN 1974-6059 November 2013
A Neural Network Controller for a Temperature Control Electrical Furnace A. El Kebir1, A. Chaker1, K. Negadi2 Abstract – The efficiency of a furnace depends on control a strategy The temperature controller of furnace must be complemented by a safety of heating resistances thus the necessity of robust control in order to emprove the control and maintain this temperature The neural networks have known an increasing success in various domains ,especially in process Engineering. The inverse modal neural control is the seaked method in this present paper It is noticed that this method is better for response time regulation of furnace temperature. Copyright © 2013 Praise Worthy Prize S.r.l. - All rights reserved.
Keywords: Electric Furnace, Integral Control with Compensation Poles and Zeros, Online Learning, Inverse Neural Model Control
Nomenclature Q
Ra Rm
Rf Ca Ce
a m e Vm p Ve k1 k2 Qmax
Quantity of heat produced Thermal resistance hindering the movement of heat led to the oven Thermal resistance hindering the movement of heat from the oven inside the cavity of measurement Resistance leak slowing the flow of heat outwards from the oven Calorific capacity of the cavity extent Calorific capacity outside the oven regarded as infinite Temperature of the cooking chamber Temperature measuring cavity
Watt/volt
Wij
Is the synaptic weight from neuron j
J
Criterion
ˆy t
u t
The estimated output The output actually provided by the neuron Command
H z
ARMA model
y k
u k u t , y t ,
The sequence is control inputs Different signals
u t and y t n N and DN N r t
Number of examples Normalization and demoralization Neutral The reference signal resistance.
Introduction
The electric resistance furnace is probably the best known of electrothermal devices. Industrial use back in effect in the early 1920 and his technique has continued to improve since. There are some contributions regarding the temperature control of different kinds of furnace, for example [1] [2] [3] [4] [5] [6]. The ideas and results presented in those papers denote the creativity, engineering and the rigorous mathematical background necessary to address some of issues involved in the temperature control of furnace, as illustrated in Fig. 1. The heat inside the oven ventilated model, is produced by resistance heating, controlled by a voltage Vc power amplifier measuring the temperature measurement is made from a thermocouple placed in a cavity measurement and instrumentation amplifier producing a voltage Vm image of the m . Overall +sensor instrumentation amplifier are supposed linear in the range of temperature oven power. We pose:
Voltage measurement Lap lace operator Control voltage
Te
Weights Bias The Matrix Weight Bias vectors
I.
Temperatures outside the furnace
Volt/degrees Maximum amount of heat produced coefficient Sampling period
W b W and Z w0 and z0
Manuscript received and revised October 2013, accepted November 2013
689
Copyright © 2013 Praise Worthy Prize S.r.l. - All rights reserved
A. El Kebir, A. Chaker, K. Negadi
Q k1vc : Quantity of heat produced
m : Temperature measured his image is tension Vm ( Vm k2 m ).
Fig. 2. Electric Furnace [1]
III. Control of Furnace Equations III.1. Control with Integral Compensation Poles and Zeros Using the Laplace transforms of Eq. (1) and (2) we obtain the following equations:
Fig. 1. Process of electric furnace-ventilated [1]
In this paper, reinforcement learning is necessary because these networks are interacting with the environment. The inverse neural control was carried by [1]. Our goal was to improve it by making a program C in Matlab for the control algorithm based on the learning rule by the method of Windrow-Hoff [7]. The use of intelligent control for the control of the temperature of the electrical furnace is no research to condemn the classical determination of the latter methods, but the application of the approach presented, as will be shown, will certainly enrich the family control 0methods.
II.
a Q e R f (3) R f 1 Rm Cm p 1 Rm Cm R f Cm R f Ca p R f Rm Cm Ca p 2
m 1 a 1 Rm Cm p
(4)
Mathematical Modeling of Electrical Furnace
The Fig. 2 shows the circuit diagram of a electrical oven. This is resistive-capacitive: By identification between the parameters of the furnace and the electrical diagram and considering the amount of heat Q as the current, the following equations are: d d (1) Q Ca a C m a e dt dt Rf
Fig. 3. Block diagram of the electric furnace
Given the Eqs. (3) and (4), the simulation scheme of the whole process can be described as follows:
T1 p
d as the current crossing capacity. The temperature dt is expressed by (2) as follows: C
d m a Rm Cm m dt
R f 1 Rm Cm p
T2 p
(2)
1 Rm Cm R f Cm R f Ca p R R C C p 2 f m m a 1 1 Rm Cm p
(5)
(6)
The model parameters of the furnace [1] are prepared in Table I. The simulation was performed in the MATLAB 7 / SIMILINK 6.
The parameters a , m and e were chosen as the voltages (images temperatures) of capacity Ca , Cm and
Ce .
Copyright © 2013 Praise Worthy Prize S.r.l. - All rights reserved
International Review of Automatic Control, Vol. 6, N. 6
690
A. El Kebir, A. Chaker, K. Negadi
TABLE I PARAMETER OF THE FURNACE 0.01 °C / W 5000 J / °C C
Ra
IV.
a
Rm
0.1 °C / W
Cm
10 J / °C
Rf
0.1 °C / W
Ce
∞
Qmax
5000 W
k1
100 W / V
e
20 °C
k2
0.1 V / °C
The equation of different physical phenomena involved in the process leading to non-linear equations that does translate imperfectly system behaviour. It was decided therefore, to seek a pattern of behaviour process based on the exploitation of experimental measurements characteristics of its dynamic operation is the subject of identification [8][9]. This model is expressed as a transfer function discreet [10][11][12]. The latter uses the inverse of the furnace systems (Fig. 7) as a controller, hence the term "inverse model neural control."(IMNC) .This neural inverse model of a process given is a neural network to calculate the input (or control signal) from the previous values of the input- output. Learning is an online procedure-related control reference model, so it is an adaptive control. The idea is to minimize the criterion:
Figs. 4 and 5 show the responses Vm and m the levels of the reference voltage Vc
and the oven
temperature a respectively. The Analog control shows that the measured voltage Vm is the image of the oven temperature m (Figs. 4 and 5). Temperature furnace 120 100 a
Temperature ( °C)
Control using Neural Network Control for Electrical Furnace
m
80 60
N
40
J
20
y t ˆy t
2
(7)
t 1 0 0
500
1000
1500 Time (s)
2000
2500
3000
It was considered that in this article the case of identification of an ARMA model of a process of the type: b b z 1 (8) H z z 1 1 2 1 1 a1 z
Fig. 4. Response from the electric furnace to a temperature step
We also note that the response is quite slow oven (Fig. 4) and the system response is damped to a value other than the excitation (Fig. 5). The corrector synthesized by the control integral with compensation poles and zeros allows both to cancel the static error and obtain stable process with satisfactory dynamic. From Fig. 6 it can seen that the control system has a fast dynamical response It is clear that the response time has been improved but there is a fairly significant overshoot in the transitional regime.
ˆy t a1 y t 1 b1u t 1 b2u t 2
(9)
May be in the form:
y t 1 ˆy t a1 b1 b2 u t 1 u t 2
Set point Vc and measurement Vm 12
(10)
Voltage (V)
10 8 6 4 2 0 0
500
1000
1500 Time (s)
2000
2500
3000
Fig. 5. Response from the electric furnace to a voltage step performance
Fig. 7. Inverse model neural control of electrical furnace model block-diagram
Mesuraing voltageVm and reference voltage Vc 14
According to the law of Widrow-Hoff [7], the sampling instant t = k Te, the estimated output ˆy t can
12
Voltage (V)
10 8
be considered as the target of a linear neuron. It is written according to the weights W and bias b as:
6 4 2 0 0
500
1000
1500 Time (s)
2000
2500
3000
yˆ k W k Pk bk
(11)
Fig. 6. Response of the electric furnace with improved response time
Copyright © 2013 Praise Worthy Prize S.r.l. - All rights reserved
International Review of Automatic Control, Vol. 6, N. 6
691
A. El Kebir, A. Chaker, K. Negadi
W k a1 b1 b2
Evolution bias of the hidden layer
(12)
1 0.8 0.6
P k y t 1 u t 1 u t 2
T
0.4
(13)
0.2 0
bk 0
(14)
-0.2 -0.4 -0.6 0
The learning network is to change, at every step, the weights and biases to minimize the sum of squared errors in output using the law of Widrow-Hoff. The error minimized is then written as:
10
20
30
40
50 Time (s)
60
70
80
90
100
90
100
Fig. 9. Evolution bias of the hidden layer Output evolution of the bias -0.3 -0.35
er k y k ˆy k
(15)
-0.4 -0.45 -0.5
The control law is then written as:
-0.55 -0.6
u t
-0.65
1 H z
r t
(16)
-0.7 0
10
20
30
40
50 Time (s)
60
70
80
Fig. 10. Output evolution of the bias
The equation of recurrence between the command u (t) and reference r (t):
1 u t b1
a1 b1
The evolution of weight and bias to each iteration of learning is given in Fig. 10. After the 45th iteration, we get a good convergence of weight and bias. That the network provides the change control [13], [14] static error is zero. The response time is much better with a remarkable decrease overshoot. Exceeded in the regime transitional. There are just oscillations in the steady state as shown in Fig. 11. Playing on the setting with a gain k introduced at the exit of the network we are able to eliminate these oscillations Fig. 12 and achieve an almost perfect steady since the static error is so small that it can be considered zero.
b2 T r t r t 1 u t 1 (17) b1
u k W k P k b k
(18)
1 W k b1
(19)
where:
a1 b1
b2 b1
p k r t r t 1 u t 1
T
(20)
The output of the system with gain k =0.2 12 10
bk 0
(21) voltage (v)
8
V.
Simulation Results and Discussions
y : Output r : Reference u : Command
6 4 2
The software used is the MATLAB 7. The schematic diagram of the four was made from SIMULINK6. Two S-functions were used for the incorporation of programmers of identification and control coded language C.
0 0
100
200
300
400
500 Time (s)
600
700
800
900
1000
900
1000
Fig. 11. The output of the system with a gain k= 0.2 The output of the system with gain k=0.1 12
Evolution of weight W1K
10
2.5 Votage (V)
2 1.5 1
6
y:Output r:Reference u:Command
4
0.5
2
0 -0.5
0 0
-1 -1.5 0
8
10
20
30
40
50 Time (s)
60
70
80
90
100
100
200
300
400
500 Time (s)
600
700
800
Fig. 12. The output of the system with a gain k=0.1
Fig. 8. Evolution of the weight W1K
Copyright © 2013 Praise Worthy Prize S.r.l. - All rights reserved
International Review of Automatic Control, Vol. 6, N. 6
692
A. El Kebir, A. Chaker, K. Negadi
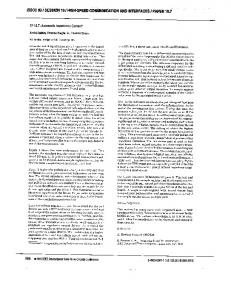
The response curves of electric furnace for model parameters Decrease 20%
To verify the anti-disturbance characteristic of the Inverse model neural control method, when system reaches the steady-state we add constant disturbance value of 10% to the output of plant [16], [17]. Fig. 13 shows the simulation results that the system can rapidly and smoothly return to the set point which is a further explanation of its strong anti-disturbance capability. Meanwhile, this characteristic possesses high value in the practical application. When the model parameter have change decreasing 10%, example opening the door. That corresponding to significant modification of the physical process and it transfer function. Thus obtained system disturbance. We see at t=1000s. The controller rejected the external perturbation [5], [15], [17] quite rapidly Fig. 14. When the model parameters have a change, increasing or decreasing 20%, the temperature response curves of electric furnace are depicted in Fig. 15 and Fig. 16 respectively. They are shown [15], [17] that the system has small overshoot and almost no steady-state error. That means system has good robustness and effectively compensates the influences of parameter variations.
12 10
voltage(v)
6 4 2 0 0
200
400
600 Time(s)
800
1000
1200
Fig. 16. The response curves of electric furnace for model parameters decrease 20% 12
voltage(v)
10
y : Output for model parametre increase de 20%
8 6
y : Output for model parametre decrease de 20%
4 2 0 0
200
400
600 Time(s)
800
1000
1200
Fig. 17. The response curves of electric furnace for model parameters decrease 20% and increase20%
The simulation results are plotted in Figs. 12, 13, 14, 15, 16 and 17. It is clear that applying the Inverse model neural control, basically realize the performance requirements of little overshoot, high accuracy and strong robustness. That suggests the designed Inverse model neural control scheme has a nice control effect to keep the electric furnace temperature in desired value.
Distrubance at time t=800 s 12 10 8 Voltage (v)
8
6 y : Output of the oven r : Réference
4
VI.
2 0 0
200
400
600 Time (s)
800
1000
The analog controller and the integral control with compensation poles and zeros could be ideal controls for the electrical furnace if the nonlinear system factors did not affect performance. The implementation of control algorithms, compared to a purely analog implementation provides many advantages. A decisive advantage lies in its exceptional versatility. It is very easy to change the encoding software control algorithms and identification so that the non-linearities of the system do not affect its performance. In addition, the approach based on neural networks has a large number of methods to overcome problems where it is impossible to obtain accurate models of processes and disturbances such as in the case of electric furnaces. With online learning, identification and control in the case of the inverse model neural control algorithms can detect any external disturbance to the system, in addition, the regulator is simply the inverse of the model is very easy to determine.
1200
Fig. 13. System response in the presence of external disturbance Distrurbance at time t=1000s 12
Voltage (V)
10 8 6
y:ouat the oven r:réference
4 2 0 0
200
400
600 Time (s)
800
1000
1200
Fig. 14. System response in the presence of external disturbance The response curves of electric furnace for model parameters Increase 20% 12 10 Voltage (v)
Conclusion
8 6
References
4 2 0 0
[1] 200
400
600 Time (s)
800
1000
1200
Fig. 15. The response curves of electric furnace for model parameters Increase 20%
[2]
Copyright © 2013 Praise Worthy Prize S.r.l. - All rights reserved
M. Mokhtari, M. Marie, Application de Matlab 5 et Simulink 2 : Contrôle de Procédés, Logique Floue, Réseaux de Neurones, Traitement du Signal Ed, Springer, 1998, pp.347-371. ISBN 2287-59651-8. A. Kanssab, F. Belouazani, B. Belmadani, Neural Networks Control of High Frequency Inverter for Induction–Heating
International Review of Automatic Control, Vol. 6, N. 6
693
A. El Kebir, A. Chaker, K. Negadi
[3]
[4]
[5]
[6]
[7]
[8]
[9]
[10]
[11]
[12]
[13]
[14]
[15]
[16]
[17]
Cooking, (2009) International Review of Automatic Control (IREACO), 2. (2), pp. 183-188. L. HongXing, W. Xuetao, Z. Yinong, Internal Model Control Using Neural Network-Genetic Algorithm for Vertical Electric Furnace. Proceeding of the 2009 IEEE. International Conference on Mechtronics and Automation. August 9-12, Changchun, China pp. 1368 – 1373. L. HongXing, L. Binzhang, Adaptive Control Using Compensatory Fuzzy Neural Network for Vertical Electric Furnace. Proceeding of the 2009 IEEE. International Conference on Information and Automation. June20 -23, Harbin, China pp. 1630 – 16335. O. Dubois, J. Nicolas, A.Billat, Adaptive Neural Network Control of the Temperature in an Oven. Advance in Neural Networks for Control and Systems, IEEE publication date 25-27 may 1994, pp. 81 – 83. H. Lijun, W. Zhihong, W. Xiaolei, Application of Variable Structure Neural Network Adaptive Control in Temperature Control of Carburizing Furnace. Proceeding of the 2010 IEEE. Natural Computation (ICNC 2010), vol3. Aug10 -12, pp. 1569 – 1572. B. Widrow, M .Lehr, 30 Years of Adaptive Neural Networks: Perception, Madeline, and back propagation, Proceedings of IEEE, vol. 78, n. 9, publication year1990, pp. 1415 – 1442. A. Errachdi, I. Saad, M. Benrejeb, On-line Identification Method Based on Dynamic Neural Network, (2010) International Review of Automatic Control (IREACO), 3. (5), pp. 474-479. Marco Araújo, Nonlinear System Identification and Behavior Modeling, (2009) International Review of Automatic Control (IREACO), 2. (4), pp. 372-375. J. Henrique, .A. Dourado. A Multivariable Adaptive Control Using a Recurrent Neural Network Proceedings of Eann98 Engineering Applications of Neural Networks, Gibraltar, 9-12 June 1991, pp. 118 – 121. A. Atig, F. Druaux, D. Lefebvre, K. Abderrahim, R. Ben Abdennour, A New Neural Adaptive Control Based on Neural Emulation of Complex Square MIMO Systems, (2010) International Review of Automatic Control (IREACO), 3 (6), pp. 612-623. K. Hunt, D. Sbarbaro, Neural Networks for Nonlinear Internal Model Control – IEEE Proc D, vol. 138, n.5, publication year1991, pp. 431 – 438. K. Hunt, D. Sbarbaro, R. Zbikowski, and G. Gawthrop, Neural Networks for Control Systems: A Survey Automatica, vol 28, nº 6, 1083-1112, novembre. 1992. M. Norgaard, Neural Network Based Control System Design Toolkit, version 2, Dept of Aut, Technical University of Denmark, January 23, 2000. M. Barrat, Y. Lécluse, J. Barrat, Exemple d’Application de la Logique Floue : Commande de la Température d’un Four, Dossier Technique de L’ingénieur L’expertise Technique de référence R7428 Date de Publication 10/07/1993. Teng. Fei, Li. Hongxing .Adaptive Fuzzy Control for Electric Furnace. Publish in: Intelligent Computing Systems. ICIC2009. IEEE. vol. 2, 20-22 Nov.2009, pp. 439 – 443. M. Khalid, S. Omatu, A Neural Controller for Temperature Control system- IEEE, vol. 12, issue. 3, publication year 1992, pp. 58 – 64.
Authors’ information 1
Laboratory SCAMRE. Department of Electrical E.N.S.E.T. Oran BP 1523 El’ M’naouer, Oran, Algeria.
Engineering,
2
Laboratoire de l'Énergie et des Systèmes Intelligents, University of Khemis Miliana, Route de Theniet El-had, 44225 Khemis Miliana, Algeria. Abdelkader El Kebir was born in SidiBelabbes (Algeria) in1964. He obtained a diploma of engineer in Electrotechnic in 1991 from the University of ENSET Oran (Algeria). He received his master at University of ENSET Oran (Algeria) from 2006 at 2008. He is now an associate professor at University of Mascara. His main research interests are in the field of the analysis and intelligent control of electrical machines, multimachines multiconverters systems, modelling and simulation of Fuzzy controllers Neural Networks Genetic Algorithm. Tel: 00 213 41 41 64 20 Fax: 00 213 41 41 98 06, E-mail:
[email protected] Abdelkader Chaker is a Professor in the Department of Electrical Engineering at the ENSET, in Oran Algeria. He received a Ph.D. degree in Engineering Systems from the university of Saint-Petersburg. Director of SCAMRE laboratory. His research activities include the control of large power systems, multimachine multiconverter systems, and the unified power flow controller. His teaching includes neural process control and real time simulation of power system. Tel: 00 213 41 41 64 20 Fax: 00 213 41 41 98 06 E-mail:
[email protected] Karim Negadi was born in Tiaret in Algeria, in 1976. He received his BS degree in Electronics Engineering from University of Tiaret (Algeria) in 2001, the MS degree in Engineering Control from University of Tiaret (Algeria) in 2008, Ph.D degree in Electrical Engineering from ENSET Oran University in 2012. His research interests are non linear control and observers applied in induction motor. Tel: 00213778148306 Fax: 0021346450435 E-mail:
[email protected]
Copyright © 2013 Praise Worthy Prize S.r.l. - All rights reserved
International Review of Automatic Control, Vol. 6, N. 6
694
International Review of Automatic Control (I.RE.A.CO.), Vol. 6, N. 6 ISSN 1974-6059 November 2013
A High Precision Angle Compensation Controller for Dish Solar Tracker Installed on a Moving Large Ship Budhy Setiawan1,2, Mauridhi Hery Purnomo2, Mochamad Ashari2 Abstract – The tracker has two axes, X-Y Cartesian mechanical system to compensate the roll and pitch of the ship movement. The system uses four light sensors in obtaining the highest intensity to adjust the dish for pointing the sun position. A system simulator prototype was built to verify the proposed system. Gyrometers are placed on the ship simulator and dish to monitor the focus of the angle system. Result for the prototype shows that the control system is capable to track the sun under ship movement. The error of focus angle is under 3.707 percent error of roll and pitch disturbances. Copyright © 2013 Praise Worthy Prize S.r.l. - All rights reserved.
Keywords: On Ship Solar Tracker, Disk Photovoltaic, X-Y Cartesian, Ship Movement Simulator
Most of them apply on/off method [6]-[11]. There are two major tracking method, closed loop and open loop [12]. In this research using the searching, closed loop. In 2009, an analytical and simulation approach for mobile base solar tracker had been investigated for its focus maximization using geometric 3D vector object method. The tracker simulation is controlled by on/off control method and based on application of 6 light sensors [13]. In the same year, an analytical investigation on involved parameter of the sun tracking from a ship results on two axes Cartesian solar tracker formulas, Eq. (7) and (8) [1]. The Cartesian axes are affected directly by sun tracking inputs and disturbed by ship rotational motions, such as pitch and roll [1]. Following the research, an investigation on conventional control for onship solar tracker shows simplicity in design and fast response [2]. An ANFIS (Artificial Neuro Fuzzy Inference System) method in software simulation has been done for the onship solar tracker. The method has shown its capability in focusing the sun light in 0.0025 percent error [3]. However, an empirical research for the tracker needs to be done. This paper proposes a high precision controller for dish solar tracker. Due to perform roll and pitch angles, a mechanical ship simulator is constructed. Meanwhile, the controller is under computer base. The research is conducted to investigate the sun angle response of the tracker under non linear disturbance, roll and pitch.
Nomenclature Z H X Y V y y’ x x’ ey ex Ly L-y Lx L-x y x
Zenit Horizontal X axis Y axis Ship vertical Desired y sun angle (Z – Sun, Z – y side) Reached y sun angle (Z – Sun, Z – y side) Desired x sun angle (Z – Sun, Z – x side) Reached x sun angle (Z – Sun, Z – x side) Y sun angle error X sun angle error Starboard sun light (photodiode) Port sun light (photodiode) Bow sun light (photodiode) Stern sun light (photodiode) Panel roll angle (gyrometer) Panel pitch angle (gyrometer) Panel roll angle (gyrometer) Panel pitch angle (gyrometer)
I.
Introduction
On-ship solar tracker is disturbed mainly by ship's movement, roll and pitch [1]-[3]. For future application, the tracker is loaded by High Concentrated Photovoltaic (HCPV) panel, which has conversion efficiency up to 41 percent [4]-[5]. The panel composes of some rows and columns of dish HCPVs [1]-[3]. Consequently, the HCPVs require a solar tracker with an accurate control, so that the dish can always focus on maximum energy. Otherwise, the energy may reduce significantly [4]-[5]. Some previous researches on solar tracker used two axes Cartesian, stand on fixed base applications (on the ground).
II.
Proposed Method
A dish solar tracker is a mechanism that consists of a HCPV panel, solar tracker and moving platform, as shown on Fig. 1. The dish is put on the X-Y Cartesian solar tracker, and the tracker is mounted on the top of a ship simulator.
Manuscript received and revised October 2013, accepted November 2013
695
Copyright © 2013 Praise Worthy Prize S.r.l. - All rights reserved
Budhy Setiawan, Mauridhi Hery Purnomo, Mochamad Ashari
In order to reach the sun position, an X axis rotational movement of the solar tracker has to be in line with the ship's longitudinal X axis. And a Y axis is parallel to ship's transversal Y axis [1]. The proposed control system for the tracker consists of two PID (Proportional Integral Differential) controllers for X and Y axis respectively, as shown in Fig. 2. The X axis compensates roll movement, and Y axis balances pitch degree.
The second path is the altitude path that travels from 23.45o (north) to -23.45o (south) and back in a period of a year [1]. In calculation, the elevation degree, hs, is expressed as:
hs 15 hsn
(1)
where hsn is sidereal hour of a local site. A sidereal hour is a time scale that is based on the earth's rate of rotation measured relatively to the sun. The altitude angle, s is expressed as: o 280 n s 23.45 sin 360 365
(2)
where n is a day number within a year, starting on the January 1st. To get the sun's altitude angle () from a ship coordinate, an equation can be expressed as:
sin sin L sin s cos L cos s cos hs (3)
Fig. 1. On Ship Cartesian Solar Tracker [3]
and azimuth angle, as, from equation:
sin cos s
cos
(4)
Finally, the ship at a certain latitude (L), on day (n) and sidereal time (hsn) will give a form of angles altitude ( and azimuth (s) [9]. Those given angles will directly affect the two pair of sun light sensors of the tracker to form sun angles, y andx.
Fig. 2. Proposed Method
The inputs of the controller are y which represents the position of light sensors in X axis relative to the sun and ship angle. The input is processed by PID and PWM resulting in now dish position, and so does for the other input, x for Y axis. Since the light sensors are located on the dish, then any change position will affect the light intensity received by both detectors, as shown on Fig. 3. These provide electric signal Ly – L-y, that are converted by an A function. The difference of the function value is used as feedback signal of the controller. Y axis is also controlled in the same method as the X axis.
III.2. Moving Base Moving base is a traveling ship and its rotational movements. While facing the sun and traveling, the tracker mostly has to deal with the ship's rotational movements, 3 degree of freedom (3 DoF). The 3 DoF is the main parameters to be significantly considered in mobile base control, as shown in Fig. 1. Those three rotational movements are roll, pitch and sometimes small yaw. The roll movement is affected by ship kinematics parameter bellow:
III. Modeling of the System Moving target and moving base are foundations on the dish solar tracker model [1].
sin hs
GM t 2 D o2 1 0 bias GM 0
defined
III.1. Moving Target
(5)
where is roll (in degree), is roll damping, o is roll natural frequency, GM0 is initial metacentric height, GM(t) is GM variation in wave and bias is keel bias angle [14]. Ship's pitch parameter is a rotational movement along the transversal axes of a ship, the Y axis.
The moving target is the sun angles from a traveling ship. There are two major sun paths. The first path is the elevation trajectory, which moves from east to west in a day with 15o/hour angular speed.
Copyright © 2013 Praise Worthy Prize S.r.l. - All rights reserved
International Review of Automatic Control, Vol. 6, N. 6
696
Budhy Setiawan, Mauridhi Hery Purnomo, Mochamad Ashari
The pitch movement (in degree) is affected by some ship kinematics parameters bellow:
2
1 s / 0 s 2 cos sea 2 1 s / 0 s s2 1 2 J 0 02
t e x t 1 (12) 'x t K e x t e x Td Ti t
(6) in which K=0.6, Ti=0.5Tu, Td=0.125Tu, and Tu= Ultimate period.
where is pitch angle, 2 is constant, J is 0.707, is elevation wave, 0 is artificial frequency and sea is sea wave angle [15]. All of the ship's 3 DoF parameters are non linear, oscillated, time variant, uncertain, abrupt change and unpredictable. However, their maximum rates are 8 seconds in period [14] – [17]. The sun pointing and ship's movement are more significant variables to be considered, rather than the sun trajectory and the ship traveling path [1] – [3].
V.
Simulator Set Up
A simulator of ship movement was built. It consists of two legs to represent the roll and pitch movement, as shown on Fig. 4. On Fig. 5, the disk solar tracker is mounted on the top of the simulator. The tracker consists of a photo sensor unit and two axes. The axes are actuated by two DC geared motors, Mx and My, in which each one has 24 kg cm torque, 70 rpm speed and 24 Volt supply.
III.3. Axes' Kinematics Properties In this research, a Cartesian solar tracker is constructed by two axes, known as X and Y, as shown in Fig. 3. The X axis' sun angle y works on two dimensional areas, y-z side. The X axis is composed mainly by the y panel angle y and ship's roll degree . While the Y axis' sun angle x rotates on x-z plane. The Y axis is composed primarily by the x panel position x and ship's pitch degree . Each axis equation is presented as follows:
X axis y y ,
y , y ,
90o y , y , 90o
(7)
(8)
Yaxis x x ,
x , x ,
IV.
90o x , x , 90o
Fig. 3. Axes Property [3]
Control Design
PID gain calculation used in the research is designed under Zieger Nichols method. Error angle input of the control ey is the y value and the different rate in between the pair of the sun light sensors Ly and L-y. The error of each axis can be expressed by Eq. (9) and (10):
e y y eLy ;eLy Ly L y
(9)
e y x eLx ;eLx Lx L x
(10)
So that, each PID output will has formula such as Eq. (11) for X axis and equation (12) for Y axis: t e y t 1 (11) 'y t K e y t e y Td Ti t
Fig. 4. Tracker on Ship Movement Simulator
Copyright © 2013 Praise Worthy Prize S.r.l. - All rights reserved
International Review of Automatic Control, Vol. 6, N. 6
697
Budhy Setiawan, Mauridhi Hery Purnomo, Mochamad Ashari
The laptop is a central control, where program in soft PID is performed. The data acquisition (DAQ), DT 9813A, is an interface between the laptop and solar tracker through electronics hardware. The laptop is as a controller for compensating the tracker and also as monitor for angles. As a controller, program reads two pair of photo diodes of X and Y axes on the disk. Those are Ly and L-y for X axis and Lx and Lx for Y axis control. By reading intensity and polarity of each sensor pair, PID sends out two pair of compensated PWM signals to X and Y DC bridge MOSFET drivers. The drivers empower the signals to rotate X and Y motors to reach the same intensity value for each pair of the photodiodes, the sun position. The drivers are capable to rotate the axis motors clock wise, contra clock wise and electric breaking for the purpose. A long with the control, there are some angle monitoring process using gyro meter, MMA 7860 QT for taking data of and angles of ship. And also, a dish gyro meter for reading data of y and x.
VI.
VI.1.
Sun Angle Performance under Ship's Roll
Fig. 6(a) shows the sun angle (y) response of roll movement. The platform of ship roll (was varied from - 20 degrees to 37 degrees. The dish position (y) showed to move in opposite direction compared to the ship roll. The experiments were conducted for duration of 5.5 to 5.7 seconds in period, which is a standard maximum roll for aframax tanker ship. The summation of both angles result in the sun angle position. The average value of the sun angle, which is also the accuracy of the system, is obtained as 3.707 percent. VI.2.
Sun Angle Performance under Ship's Pitch
Fig. 6(b) displays the sun angle (x) response of pitch movement. The ship pitch range was - 20 degrees to 37 degrees. The dish degree (x) demonstrates to move in contrary angle compared to the ship pitch. The trials were carried out for duration of 5.5 to 6.0 seconds in period, which is above standard maximum pitch for aframax tanker. The summing up of those angles outcome is in the sun degree position. The average rate of the sun angle, which is also the precision of the system, can be achieved as 3.327 percent.
Experimental Result and Discussion
The research is conducted to demonstrate the response of the control system under several disturbance including roll and pitch movement of the ship.
(a)
(b) Figs. 6. X and Y Axes Angle Respond
VI.3.
Axes Starting and Settling Phase Performance
Figs. 7(a) and 7(b) show sun angles on X and Y axes in starting process to reach settling point for 780 ms. The tracker resting angles are y = -15.425 degrees and x = 14.206 degrees. After the starting movement, the tracker points the sun on the settling angles at y = 23.084 degrees and x = 28.467 degrees. Fig. 8(a) displays tracker degrees behavior in obtaining the settling point in speed of 20.588 deg/second.
Fig. 5. DAQ and Controller Unit
Copyright © 2013 Praise Worthy Prize S.r.l. - All rights reserved
International Review of Automatic Control, Vol. 6, N. 6
698
Budhy Setiawan, Mauridhi Hery Purnomo, Mochamad Ashari
Fig. 8(b) illustrates the tracker's sun angles on pointing the sun position at y = 28.556 degree and x = 22.667 degree on settling moment.
VII.
Conclusion
The proposed method is capable to point the sun trajectory with 3.707 percent angle error by applying XY Cartesian system. Its starting speed can reach 20.588 deg/second. And, the system response is 150 ms.
Acknowledgements (a)
This research has been partially carried out under the support of Higher Education, Ministry of Education and Culture of Indonesia on 2013 Dissertation Research Fund.
References [1]
Budhy Setiawan , Mauridhy Hery Purnomo , Mochamad Ashari . Artificial Intelligent based Modeling of Mobile Solar Tracker for a Large Ship, ICAST Proceeding (International Student Conference on Advanced Science and Technology), pp 271-272, December 11th-12th, 2009, Ewha Womans University, Seoul, South Korea. [2] Budhy Setiawan , Mauridhy Hery Purnomo , Mochamad Ashari , PID based modeling performance for two axes mobile solar tracker on a large ship, ICAST Proceeding (International Student Conference on Advanced Science and Technology), pp 339-340, 25-26 May 2010, Edge University, Izmir, Turki. [3] Budhy Setiawan, Mauridhy Hery Purnomo, Mochamad Ashari, Takashi Hiyama, Advance Control of On-ship Solar Tracker Using Adaptive Wide Range ANFIS, International Journal of Innovative Computing, Information and Control, ISSN 13494198, Volume 9, Number 6, June 2013. pp. 2585 – 2896. [4] Eugene A. Katz, Jeffrey M. Gordon, Wondesen Tassew, and Daniel Feuermann, Photovoltaic characterization of concentrator solar cells by localized irradiation, Journal of applied physic, Vol. 100, issue 4, 2006, pp 044514-1 - 044514-8. [5] C. Algora, M. Baudrit, I. Rey-Stolle, D. Martín, R. Peña, B. Galiana and J. R. González, Pending Issues in the Modeling of Concentrator Solar Cells, Journal for Process and Device Engineers, Vol 15, No 2, 2005, pp 1-11. [6] William A. Lynch and Ziyad M. Salaameh, Simple Electrooptically controlled dual-axes sun tracker, Pergamon Press, Solar Energy, Vol 45, No 2, 1990, pp 65-69. [7] Chia-Yen Lee , Po-Cheng Chou , Che-Ming Chiang and ChiuFeng Lin , Sun Tracking Systems: A Review, Sensors, Vol 9, 2009, pp 3875-3890. [8] Hossein Mousazadeh, Alireza Keyhani, Arzhang Javadi, Hossein Mobli, Karen Abrinia, Ahmad Sharifi, A review of principle and sun-tracking methods for maximizing, Elsevier Renewable and Sustainable Energy Reviews Vol 13, 2009, pp 1800-1818. [9] R.Y. Nuwayhid , F. Mrad, R. Abu-Said, The realization of a simple solar tracking concentrator for university research applications, Elsevier, Pergamon, Renewable Energy, Vol 24, 2001, pp 207-222. [10] P. Roth , A. Georgiev , H. Boudinov , Design and construction of a system for sun-tracking, Elsevier, Renewable Energy, Vol 29, 2004, pp 393-402. [11] F.R. Rubio , M.G. Ortega, F. Gordillo, M. Lo´pez-Mart´nez, Application of new control strategy for sun tracking, Elsevier, Energy Conversion and Management, Vol 48, 2007, pp 21742184. [12] A. M. Abu Hanieh, Orientation of Solar Photovoltaic Panels in Desert Regions, (2008) International Review of Automatic Control (IREACO), 1. (3), pp. 347-354.
(b) Figs. 7. Axes Starting Responds
(a)
(b) Figs. 8. Angle Positions
Copyright © 2013 Praise Worthy Prize S.r.l. - All rights reserved
International Review of Automatic Control, Vol. 6, N. 6
699
Budhy Setiawan, Mauridhi Hery Purnomo, Mochamad Ashari
[13] Vasile, A.; Drumea, A.; Neacsu, C.; Angel, M.; Stoichescu, D.A.; Automatic System and Energetic Efficiency Optimization Algorithm for Solar Panels on Mobile Systems, IEEE Conferences.in Electronics Technology}, 32nd International Spring Seminar, 2009. Brno, Czech Republic. [14] S. Surendrana, S.K. Leeb, J. Venkata Ramana Reddyc,Gyoungwoo Leed, Non-linear roll dynamics of a Ro-Ro ship in waves, Ocean Engineering Vol 32, 2005, pp 1818-1828. [15] Michael S Triantafyllou, Marc Bodson, Michael Athans, Real Time Estimation of Ship Motions Using Kalman Filtering Techniques, IEEE Journal of Ocean Engineering, Vol OE-8, No 1, January 1983, pp 9-20. [16] I. Senjanovic, J. Parunov and G. Cipric Chow, Safety Analysis of Ship Rolling in Rough Sea, Sohrons & Fractals, Elsevier Science Ltd PII, Printed in Great Britain, Vol 8, No 4, 1997, pp 659-680. [17] R. A. Ibrahim and I. M. Grace, Review Article Modeling of Ship Roll Dynamics and Its Coupling with Heave and Pitch}, Hindawi Publishing Corporation, Mathematical Problems in Engineering, Vol 2010, 2010, 32 pages.
Authors’ information 1
Department of Electrical Engineering, Institute Teknologi Sepuluh Nopember , Surabaya 60111, Indonesia. 2
Department of Electrical Engineering, Politeknik Negeri Malang, Malang 65144, Indonesia. Budhy Setiawan was born at Surabaya, Indonesia on 9 April 1964. He was graduated Bachelor of Science in Electrical Engineering Technology on Microprocessor Control and robotics in 1991 at Southern Institute of Technology, Marietta, Georgia, USA. In 2008, he has earned Master of Technology degree on Applied Electrical Control at Brawijaya University, Malang, Indonesia. And, now, he is pursuing his doctorate degree on Energy Conversion at Institut Teknologi Sepuluh Nopember, Surabaya, Indonesia. Meanwhile, he is a lecturer on Politeknik Negeri Malang, Malang, Indonesia. His previous publication and research mostly concern with solar energy maximation control and its applied technology. Prof. Dr. Ir. Mauridhi Hery Purnomo, M.Eng. received his bachelor degree from Institut Teknologi Sepuluh Nopember (ITS) in 1985. In 1995 and 1997, he got his Master and Ph.D degrees from Osaka University, Japan. He joined ITS as a lecturer in 1985 and became Professor in 2003. His current interests include intelligent system applications, image processing, medical imaging, control and management. He is a Member of IEEE. Prof. Ir. Mochamad Ashari, M.Eng, PhD. recieved his bachelor degree from Institut Teknologi Sepuluh Nopember (ITS) in 1989 and joined ITS as lecturer in 1990. In 1998 and 2001, he got his Master and PhD degrees from Curtin University, Australia. He earned professor honor in 2009. His research field is industrial electronics and applications, including harmonics filter design, solar home systems, etc. He has received many research grants from ADB, JICA, and Indonesian Government.
Copyright © 2013 Praise Worthy Prize S.r.l. - All rights reserved
International Review of Automatic Control, Vol. 6, N. 6
700
International Review of Automatic Control (I.RE.A.CO.), Vol. 6, N. 6 ISSN 1974-6059 November 2013
Optimal Placement and Sizing of Multiple Capacitors in Radial Distribution Systems Using Modified TLBO Algorithm Manas Ranjan Nayak, Kumari Kasturi, Pravat Kumar Rout Abstract – Nowadays due to development of distribution systems and increase in electricity demand, the use of capacitors in parallel are increased. Determining the installation location and size are two significant factors affecting network loss reduction and improving network performance. The optimal capacitor placement and sizing problem is formulated as a mixed integer nonlinear optimization problem subject to highly nonlinear equality and inequality constraints. This paper, proposes an efficient method based on Modified Teaching Learning Based Optimization Algorithm (MTLBO) for optimal placement and sizing of multiple capacitors in a radial distribution system(RDS) is proposed, which can greatly envisaged with problems. The objective function is to minimize the network active power losses, improving system voltage profile, increasing voltage stability index and load balancing within the frame work of system operation and security constraints. The proposed method is implemented on 33 and 69 bus radial distribution systems and the results are compared with results of other popular optimization methods available in published articles. Test results show that the proposed method is more effective and has higher capability in finding optimum solutions. Copyright © 2013 Praise Worthy Prize S.r.l. - All rights reserved.
Keywords: Radial Distribution System (RDS), Capacitor Placement, Modified Teaching Learning Based Optimization (MTLBO), Active Power Loss, Voltage Deviation, Voltage Stability Index
Nomenclature Pi Qi
Pj Qj P Li Q Li
P Lj Q Lj I ij avg
I ij
I ijmax
V i,nom Vi Vj V imin
V imax
Active power flowing out of bus i Reactive power flowing out of bus i Active power flowing out of bus j Reactive power flowing out of bus j Active power load connected at bus i Reactive power load connected at bus Active power load connected at bus j
i
P Loss i, j
Active power loss of the line section between buses i and j
P T ,Loss n P SUB Q SUB nCap M Nf
Total active power loss Total number of buses Active power injection of substation Reactive power injection of substation Number of Capacitors Total number of branches Total number of sources Reactive power injection of i th Capacitor Lower limit of reactive power injection of the ith Capacitor Upper limit of reactive power injection of the ith Capacitor Capacitor installation cost (1000 $ / Capacitor) Capacitor marginal cost (3$/kVAr) Load duration (8760 hrs) Capacitor energy cost of losses (0.06 $ / kWh)
Q Cap,i
Reactive power load connected at bus j Current in line section between buses i and j Average current in line section between buses i and j Maximum current in line section between buses i and j
min Q Cap,i max Q Cap,i
K cf Kc Ti Ke
Nominal voltage of bus i Voltage of buse i Voltage of buse j Minimum value of bus voltage magnitude Maximum value of bus voltage magnitude
I.
Introduction
The analysis of the customer failure statistics of most
Manuscript received and revised October 2013, accepted November 2013
701
Copyright © 2013 Praise Worthy Prize S.r.l. - All rights reserved
Manas Ranjan Nayak, Kumari Kasturi, Pravat Kumar Rout
utilities indicates that the distribution system makes the greatest individual contribution to the unavailability of supply to a customer [1]. Therefore, the analysis of a distribution system is an important area of activity [1]-[20]. Distribution system has a major share of losses in power system. High R/X ratio and also a significant voltage drop in the system causing significant losses in these systems. Distribution systems typically have radial feeders. The increase of electrical demand and consequently the development of distribution systems cause further voltage drop and power losses increment and load imbalance, which reduce the voltage stability. The reactive power support is one of the well-recognized methods for the reduction of power losses together with other technical benefits; such as improved voltage profile, improved voltage stability index, improve the power factor, increases available capacity of feeders and improvement in system reliability and security. On the other hand, economic advantages of installing capacitors include various investments for improving facilities, operational costs decrement, optimized production, decreasing the costs of energy losses, and an increment in protection of critical loads. Reactive power addition can be beneficial only when correctly applied. Correct application means choosing the correct location and size of the reactive power support. The problem of proper locating and sizing of shunt capacitor banks in distribution systems become a challenge for power system researchers and planners. Various methods have been investigated for load flow analysis and capacitor placement problems by many researchers. Shirmohammadi and Semlyen [2] presented a new compensation-based power flow method for the solution of weakly meshed distribution and transmission networks. Ghosh and Das [3] proposed a simple and efficient method for the load flow of radial distribution network using the evaluation based on algebraic expression of receiving end. Goswami and Basu [4] have presented a direct method for solving radial and meshed distribution networks. Das [5] has presented an optimal capacitor placement method using a fuzzy-GA method. Sundhararajan and Pahwa [6] have solved the general capacitor placement problem in a distribution system using a genetic algorithm. Kasaei and Gandomkar [7] have presented an optimal capacitor placement method using ant colony algorithm. Sarma and Rafi [8] have solved optimal capacitor location and size to reduce the power losses using plant growth simulation algorithm. Sydulu and Prakash [9] presented a novel Particle Swarm Optimization based approach for capacitor placement on RDS. Taher and Bagherpour [10] used a hybrid honey bee colony optimization method for minimization of the power losses and unbalances and also voltage profile improving. Tabatabaei and Vahidi [11] presented the bacterial foraging with a PSO algorithm used to determine the optimal placement of capacitors.
From the literature survey, it is observed that most of these population based optimization techniques have successfully used to determine size, placement, and loss minimization problem of capacitor in radial distribution system. However, many of them suffer from local optimality and require large computational time for simulation. These motivate the present authors to introduce new, simple, efficient and fast population based optimization techniques to solve optimal capacitor placement and sizing problem of radial distribution system. In this study modified teaching learning based optimization (MTLBO) is proposed to determine optimal size and location of multiple capacitors to minimize different objective functions of 33 and 69 bus RDS. To show the effectiveness and superiority, the performance of the proposed method was tested on 33 and 69 bus RDS .The results were compared with the results of other popular optimization techniques. The rest of the paper is organized as follows. In Section 2, modeling of power flow in RDS is discussed. The problem formulation with system constraints and economic evaluation are addresses in Section 3.Overview of the proposed MTLBO algorithm is briefly described in Section 4. Application of MTLBO to solve the optimal capacitor placement and sizing problem of radial distribution system are explained in Section 5. In Section 6, Capacitor placement & sizing evaluation indices are described. Test system description, simulation results and analysis are reported in Section 7. Finally, conclusions are drawn in Section 8.
II.
Modeling of Load Flow
In this paper, network topology based backward and forward sweep method [12] is used to find out the load flow solution for balanced radial distribution system. Conventional NR and Gauss Seidel (GS) methods may become inefficient in the analysis of distribution systems, due to the special features of distribution networks, i.e. radial structure, high R/X ratio and unbalanced loads, etc. These features make the distribution systems power flow computation different and somewhat difficult to analyze as compared to the transmission systems. Various methods are available to carry out the analysis of balanced and unbalanced radial distribution systems and can be divided into two categories. The first type of methods is utilized by proper modification of existing methods such as NR and GS methods. On the other hand, the second group of methods is based on backward and forward sweep processes using Kirchhoff’s laws. Due to its low memory requirements, computational efficiency and robust convergence characteristic, backward and forward sweep based algorithms have gained the most popularity for distribution systems load flow analysis. The voltage magnitude and phase angle of the source should to be specified.
Copyright © 2013 Praise Worthy Prize S.r.l. - All rights reserved
International Review of Automatic Control, Vol. 6, N. 6
702
Manas Ranjan Nayak, Kumari Kasturi, Pravat Kumar Rout
Also the complex values of load demands at each node along the feeder should be given. Starting from the end of the feeder, the backward sweep calculates the line section currents and node voltages (by KCL and KVL) back to the source. The calculated voltage at the source is compared with its original specified value. If the error is beyond the limit the forward sweep is performed to update the node voltages along the feeder. In such a case, the specified source voltage and the line section currents already calculated in the previous backward sweep are used. The process keeps going back and forth until the voltage error at the source becomes within the limit. The shunt admittance at any bus to ground is not considered. The single line diagram of distribution system is shown in Fig. 1.
( V j ) are expressed by the following set of recursive equations: 2
P j P i P Lj R ij
Vi
V
2 j
2
(5)
2
V i 2 Ri j Pi X i j Qi 2
R i2 j X i2 j
(6)
P 2j Q j 2 j
Hence, if the Vo , Po , Qo at the first bus of the network are known, then the same quantities at the other nodes can be calculated by applying the above branch equations. By applying the backward and forward update methods, we can get a power flow solution. The active power loss of the line section connecting between buses i and j is calculated as:
Backward Sweep
2
P Loss i, j R ij
By starting from the ending buses and moving backward to the slack bus (substation bus), the power flow through each branch is expressed by the following set of recursive equations:
2
(7)
The total active power loss of the all lines sections in n bus system ( P T ,Loss ) is calculated by adding up the losses of all line sections of the feeder, which is described as:
(1)
2
P i2 Q i Vi
'2
P' j2 Q j V
P i2 Q i Vi
Fig. 1. Distribution system with capacitor installation at any location .
P i P j P Lj R ij
(4)
2
2
Q j Q i Q Lj X ij
V
II.1.
P i2 Q i
j
n 1
Q i Q j Q Lj X ij
'2 P' j2 Q j
V 2
2
Vi V
j
P T ,Loss
(2)
2 j
III. Problem Formulation
'2 P' j2 Q j
V
The optimum placement and sizing of the capacitors are optimization problems with nonlinear objective function that has equality and inequality constraints. The proposed objective function includes: reducing power losses, reducing voltage deviation and improving voltage stability index of the system and help in balancing the current of system in a given radial distribution network.
(3)
2 j
where P' j P j P Lj and Q' j Q Q Lj . j II.2.
(8)
i 1
2 R ij P' j X ij Q' j
R ij2 X ij2
P loss i, j
Forward Sweep III.1. Objective Function
By starting from the slack bus (substation bus) and moving forward to ending bus, the active and reactive power flows at the receiving end of branch ( P j and
In this paper, three objective functions are considered separately as single objective for the capacitors placement and sizing problem in the distribution network.
Q j ) and the voltage magnitude at the receiving end
Copyright © 2013 Praise Worthy Prize S.r.l. - All rights reserved
International Review of Automatic Control, Vol. 6, N. 6
703
Manas Ranjan Nayak, Kumari Kasturi, Pravat Kumar Rout
Buses with the minimum of the voltage stability index may be unstable, and it is very important to identify weak buses. SI j must be maximized for improving voltage stability as its result the proposed objective function will be minimized.
A. Minimization of the active power losses ( f 1 ) The active power loss of the line section connecting buses i and j can be computed as: 2
PLoss i, j R ij
P i2 Q i
(9)
V i2
D. Load balancing ( f 4 ) The term f 4 in the objective function is considered
The total active power loss of the all lines sections is described as:
for load balancing of the lines. Eq. (16) represents the load balancing:
n 1
f 1 P T ,Loss
P Loss i, j
n 1
I ij f 4 avg i 1 I ij
(10)
i 1
B. Minimization of Voltage deviation ( f 2 )
avg I ij
f 2 max V i V i,nom
(16)
where:
The objective function for minimization of voltage deviation is defined as: n
2
(11)
1 n 1 I i, j n i i 1
(17)
i 1
III.2. System Constraints C. Improvement of the voltage stability index ( f 3 )
The objective function is subjected to the following constraints:
Fig. 1 shows a branch of radial system. In radial distribution system each receiving bus is fed by only one sending bus. From Fig. 1: I ij
V i V j R ij j X ij
a) Power balance constraints: n P SUB i PLi P T , Loss
(12)
nCap
P j j Q j V *j I ij
Q SUB
(13)
n
Q Cap,i i Q Li QT ,Loss
(18)
(19)
i 1
when the capacitor is connected to distribution network, the index of voltage stability for distribution network will be changed. This index, which can be evaluated at all buses in radial distribution systems, was presented by Chakravorty and Das [13]. Eq. (14) represents the voltage stability index. Using Eq. (12) and (13):
b) Bus Voltage limit:
4 P j R ij Q j X ij V i
2
(20)
I ij I ijmax
(21)
c) Thermal Limits:
2
4 SI j V i 4 P j X ij Q j R ij
V imin V i V imax
(14)
d) Radial structure of the network:
M nN f
Objective function for improving voltage stability index is given by (15):
(22)
e) Power limits of Capacitor:
1 , j 2,3,...,n f3 SI j
(15)
min max Q Cap,i Q Cap,i Q Cap,i
For stable operation of the radial distribution systems, SI j 0 and the maximum value of SI j for j 2 ,3,......n , causing minimum value of f 3 , so that;
(23)
III.3. Economic Evaluation of Installing Capacitors For economical evaluation of the proposed method in each objective function, the mathematical formulation [14] for different terms of costs presented as follows:
there is a feasible solution.
Copyright © 2013 Praise Worthy Prize S.r.l. - All rights reserved
International Review of Automatic Control, Vol. 6, N. 6
704
Manas Ranjan Nayak, Kumari Kasturi, Pravat Kumar Rout
A. Installation cost of capacitors Capacitor installation cost is presented as follows:
to the students. A student’s result is analogous to fitness value and the value of objective function represents the knowledge of a particular students. The best solution is considered as the teacher. The teaching phase and learning phase concept of MTLBO algorithm are described below. (a) Teacher phase This is the first phase of the MTLBO algorithm where students improve their learning using teaching aids of the teacher and the teacher tries to improve the average result of the class room through teaching from an initial value to his own level, though it is practically impossible and the teacher can only improve the average grade of the class to some extent. If the new average grade of the k th subject at d th iteration is dnew.k the difference between
nCap
C Inst.
K cf
$
(24)
i 1
where capacitor installation cost is taken as same value for all capacitor. B. Cost of capacitors Cost of capacitor is presented as follows: nCap
C Cap.
K c Q Cap,i
$
(25)
i 1
the existing mean and new mean of the k th subject at the d th iteration may be formulated as [15]:
where capacitor marginal cost is taken as same value for all capacitor.
d t f kd ddiff .k rand new.k
C. Economical Saving Energy cost of losses before installing capacitors in a radial distribution system for one year period (8760hrs) is defined as:
CEL NOCap K e Ti PT ,Loss,NOCap
$
where rand is a random number between [0, 1]; t f is the teaching factor (either 1 or 2) which is evaluated randomly by the following equation:
(26)
t f round 1 rand 0 ,1
where P T ,Loss,No Cap is the active power loss before
where
P T ,Loss, Cap
$
1 where X dp,k , X dp,k are the grade of them k th subject of
(27)
the p th student at d th and d 1
iteration; ddiff .k is
th
at d th and d 1 iteration. (b) Learner phase It is the final phase of the proposed algorithm where students enhance their knowledge through mutual interaction with other students. Each student randomly chooses another student for interaction and learns new things from him if the selected student has better knowledge than him. Mathematically, this learning phenomenon may be expressed as:
capacitor installation: Benefit (Saving) of reduction in energy cost ($) of losses for one year = C EL NOCap C EL Cap $ (28)
IV.
th
the difference between the mean grade of the k th subject
is the active power loss after
Net annual savings ($)= = C EL NOCap C EL Cap C Inst. C Cap.
(31)
The grade of k th subject of the p th student is updated by: d 1 X dp,k diff (32) X dp,k .k
capacitor installation (Base case). Energy cost of losses after installing capacitors in a radial distribution system for one year period (8760hrs) is defined as:
CEL Cap K e Ti PT ,Loss,Cap
(30)
(29)
Overview of MTLBO Technique
1 X dp,k rand X dp,k X ds,k X dp,k
The MTLBO algorithm is a new efficient population based algorithm developed by Rao et al. [15]. The algorithm mimics the teaching-learning ability of the teacher and learners in a classroom. Teachers are the most learned person in society and they try to increase the knowledge of the students. The algorithm describes two basic phases of learning; they are teaching phase and learning phase. In this method, a group of students in a class is considered as a population and design variables are the subjects offered
if
f X
p
f X s
1 X dp,k rand X ds,k X dp,k X dp,k
if
f X
p
X s
(33)
(34)
where X dp,k1 , X dp,k are the value of k th control variable th
of the p th student at d th and d 1 iterations; X ds,k is
Copyright © 2013 Praise Worthy Prize S.r.l. - All rights reserved
International Review of Automatic Control, Vol. 6, N. 6
705
Manas Ranjan Nayak, Kumari Kasturi, Pravat Kumar Rout
which coincides with the number of units to place in the distribution system ( k ) and limits of design variables (upper, U L and lower, L L of each case). Define the optimization problem as: Minimize f X ,
the value of k th control variable of the s th student (randomly selected) at d th iteration; f X s is the grade point of the s th student. The proposed MTLBO algorithm that is introduced here is shown in the flow chart of Fig. 2.
where f X is the objective function, X is a vector for design variables such that L L X U L . Step 2: Generate a random population according to the number of students in the class ( p ) and number of
BEGIN Define optimization problem
subjects offered ( k ). This population is mathematically expressed as:
Initialize the optimization parameters:
p,G,k ,U L and L L
. . . . .
X 11, X 1,2 X 2 ,1 X 2 ,2 . V . . . X p,1 X p,2
Generate randomly the initial population
Calculate the objective function value of all individuals
. X 1,k . X 2 ,k . . . . . X p,k
(35)
where X p,k is the initial grade of the k th subject of the
Teacher phase: Modify the population based on Eq.38 and discretize it
p th student. Step 3: Evaluate the average grade of each subject offered in the class. The average grade of the k th subject is given by:
Calculate the objective function value of all individuals
k mean X 1,k , X 2 ,k ,..., X
Accept each new individual if it gives a better function value than the original
p,k
(36)
Step 4: Based on the grade point (objective value) sort the students (population) from best to worst. The best solution is considered as teacher and is given by:
Learner phase: Modify the population based on Eq.39 & 40 and discretize it
X tearcher X Calculate the objective function value of all individuals
(37)
f X min
Step 5: Modify the grade point of each subject (control variables) of each of the individual student. Modified grade point of the k th subject of the p th student is given by:
Accept each new individual if it gives a better function value than the original
old X new p,k X p,k r 1 X tearcherk round 1 r 2 k (38)
NO Is the termination Criterion satisfied?
where r 1, r 2 are random numbers between [0, 1]. Step 6: Every student improves grade point of each subject through the mutual interaction with the other students. The grade point of the k th subject of the p th student is modified by:
YES Final value of solutions END Fig. 2. Flow diagram of the MTLBO algorithm
old X new p,k X p,k rand X
The following steps give explanations to the MTLBO algorithm. Step 1: Initialize the population size or number of students in the class ( p ), number of generations ( G ), number of design variables or subjects (courses) offered
if
f X
p
p,k
X s,k
f X s
old X new p,k X p,k rand X s,k X
if
Copyright © 2013 Praise Worthy Prize S.r.l. - All rights reserved
f X
p
f X s
p,k
(39)
(40)
International Review of Automatic Control, Vol. 6, N. 6
706
Manas Ranjan Nayak, Kumari Kasturi, Pravat Kumar Rout
V.
grid, the vector will have a dimension of 1 2nCap .
Application of MTLBO to Solve the Optimal Capacitor Allocation Problem
Depending upon the population size, initial solution M is created which is given by:
The procedure for implementing the MTLBO algorithm in solving optimal capacitor placement problem can be summarized by the following steps: Step 1: Read the system data, constraints, the population size ( P ), the maximum number of iterations ( G ), the number of capacitors to be installed in the distribution network, limits of placement of capacitor Buses and limits of size of the capacitors. Step 2: The capacitor placement Buses are positive integers, while the variables that represent the capacitor unit size variables are continuous. The placement of capacitor Buses and size of the capacitors are randomly generated and normalized between the maximum and the minimum operating limits. The placement of capacitor Buses and size of the capacitors of j th capacitor is normalized to b jCap and j Q cap
M M 1, M 2..., M j ..., M P
Step 3: Compute the objective functions using eq. (10), (11), (15) and (16) independently. Step 4: Identify the best solution and assign that solution as the teacher of the class. Step 5: Modify the grade of each subject (independent variables of radial distribution system) of each student based on the teacher knowledge using eq. (38). Step 6: Update grade of each subject of each student based on the learners’ knowledge by utilizing the knowledge of some other learner of the same group using Eq. (39) and (40). Step 7: Check whether the independent variables violate the operating limits or not. If any independent variable is less than the minimum level it is made equal to minimum value and if it is greater than the maximum level, it is made equal to maximum level. Step 8: Go to step 2 until the current iteration number reaches the pre specified maximum iteration number.
as given below to satisfy the placement of
capacitor Buses and size of the capacitors constraints:
random j j b Cap round b Cap,min b jCap, max b jCap,min
(41)
VI.
j b Cap N , b Cap b Cap,min b Cap,max
j Main distribution substation is designated as b Cap =1:
PL : The penetration level of capacitor units is defined by PL , where Q Cap and Q load are the reactive power of
j Cap, max
Q j Q jCap,min random Q Cap Q j Cap,min (42) j R, Q Cap Q Cap,min Q Cap,max Q Cap
capacitor/capacitors and the total reactive load of the network, respectively.
APLR and RPLR : APLR and RPLR show active and reactive loss reduction after installing Capacitor/ Capacitors, where NO Cap represents the base case and Cap , the case after capacitor installation. Higher values of APLR and RPLR indicate better performance of capacitors in loss reduction.
Select capacitor placement Buses randomly from all the buses and the capacitors are installed in these selected buses. The rating of all the installed capacitors, comprise a vector which represents the grade of different subjects of a particular student and it also represents a candidate solution for the optimal capacitor allocation problem. Each set of the feasible solution of matrix M i represents a potential solution which is given by:
Capacitor Placement &Sizing Indices
There are various technical issues that need to be addressed when considering the presence of distributed generators in distribution systems. To study the effect of capacitor units on the performance of power systems, some indices are used as shown in Table I.
j where b Cap represents bus location.
Q Capi,1,Q Capi,2......,Q Capi,nCap Mi b Capi,1,b Capi,2......,b Capi,nCap
(44)
VDR : It shows voltage deviation reduction after installing capacitor/capacitors. Higher value of VDR indicate better bus voltage. VSIR : It shows voltage stability index reduction after installing capacitor/capacitors. Higher value of VSIR indicate better improvement of voltage stability of the system.
(43)
VDI : The determination where V i nom V i nom = 1 p.
The dimension of the vector is two variables per capacitor installed (the positive integer bus number and the capacitor reactive power output). Moreover for multiple capacitor units ( nCap ) to be installed in the
Copyright © 2013 Praise Worthy Prize S.r.l. - All rights reserved
VDI index is a good indicator for the of deviation from bus voltage nominals, is the desired voltage at bus i (usually, u.) and V i Cap is the bus voltage when
International Review of Automatic Control, Vol. 6, N. 6
707
Manas Ranjan Nayak, Kumari Kasturi, Pravat Kumar Rout
capacitor is presented in the network, both in per unit. n is the number of buses. Closer the index to zero will give the better performance of the network so this index must be minimized to improve the voltage profile.
3802.19 kW and 2694.6 kVAr, respectively. It is demonstrated in Fig. 4 [16].
VPI : In order to have better voltage profile, VPI index must be maximized. TABLE I EVALUATION INDICES DUE TO INSTALLATION OF CAPACITORS IN RDS Impact index Formula Capacitor penetration level
Active power loss reduction
PL
APLR
Q Cap Q load
P T , Loss , NO Cap P T , Loss , Cap P T , Loss ,
Reactive power loss reduction
RPLR
VDR
100%
NO Cap
Q T , Loss , NO Cap Q T , Loss , Cap Q T , Loss ,
Voltage deviation reduction
Fig. 3. Single-line diagram of the 33-bus radial distribution network 100%
100%
NO Cap
VD NO Cap VD Cap
Fig. 4. Single-line diagram of the 69-bus RDS 100%
VD NO Cap
VSI
Voltage stability index reduction
VSI
Voltage deviation index
VDI max
VSI n i 1
NO Cap
VSI Cap
VII.2.
(1) Power flow calculation is performed using S base = 100 MVA and V base =12.66 kV. (2) Single and Three capacitors that inject reactive power are installed in to the systems. (3) The limits of capacitor unit sizes for installation at different systems bus locations are assumed to be 200 kVAr to 1200 kVAr with step of 2 kVAr. (4) Voltage at the primary bus of a substation is 1.0p.u. (5) The upper and lower limits of voltage for each bus are 1.05p.u. and 0.9 p.u., respectively. (6) The maximum allowable number of the parallel capacitor is one, in each bus. (7) The load model which is used in the simulations in uniform with constant power (active and reactive) throughout year.
100%
NO Cap
V i nom V i Cap
V i nom
n
Voltage profile index
VPI
1 n
V i Cap V i NO
i 1
V
Cap
100
n i NO Cap
i 1
VII.
Test System Description, Simulation Results and Analysis VII.1.
Assumptions and Constraints
Test Systems
The proposed method has been programmed using MATLAB and run on a personal computer having dual core processor, 1.86GHz speed and 2GB RAM. The proposed MTLBO algorithm is run for 50 population size and 100 iterations for each case. The effectiveness of the proposed method for loss reduction by capacitor placement is tested on 33 and 69 bus RDS. The first system is a 12.66 kV, 33 bus RDS consisting of 33 buses configured with one substation, one main feeder, 3 laterals and 32 branches. The total active and reactive loads on this system are 3715 kW and 2300 kVAr, respectively. It is demonstrated in Fig. 3 [16]. The second system is a 12.66 kV, 69 bus large scale RDS with consisting of 69 buses configured with one substation, one main feeder, 7 laterals and 68 branches. The total active and reactive loads on this system are
VII.3.
Simulation Results
Simulation results are divided to two parts: A. Simulation results related to system performance and technical advantages In this section, the technical results of proposed method for 33 and 69 bus RDS are presented. Table II shows the pre installation objective function values of capacitors. Table III shows objective functions values after installation of single capacitor and three capacitors. The detailed results using proposed (MTLBO) algorithm for both systems during pre installation and post installation of the capacitors (single and three) are described in Tables IV and V for minimization of the active power losses.
Copyright © 2013 Praise Worthy Prize S.r.l. - All rights reserved
International Review of Automatic Control, Vol. 6, N. 6
708
Manas Ranjan Nayak, Kumari Kasturi, Pravat Kumar Rout
TABLE II OBJECTIVE FUNCTION VALUE OF THE RDS BEFORE CAPACITORS INSTALLATION Objective function value System 33-Bus 69-Bus
f 1 (kW)
f 2 (p.u.)
f 3 (p. u.)
f 4 (p.u.)
210.07 224.54
0.095 0.089
1.49 1.45
65.56 200.85
TABLE VI EVALUATION INDICES FOR 33 AND 69 BUS RDS 33 Bus 69 Bus Impact index Single 3No.of Single 3No.of Cap. Cap. Cap. Cap. Capacitor penetration 52.17 85.92 44.54 68.07 level (%) Active power loss 28.55 35.02 32.56 35.68 reduction (%) Reactive power loss 27.74 34.66 31.06 33.94 reduction (%) Voltage deviation 14.3 37.57 22.38 25.16 reduction (%) Voltage stability index 5.82 14.43 8.37 9.33 Reduction (%) Voltage deviation 4.24 3.46 2.19 1.96 index Voltage profile index 0.03 0.06 0.006 0.01
TABLE III OBJECTIVE FUNCTION VALUE OF THE RDS AFTER CAPACITORS INSTALLATION Objective function value System
f 1 (kW)
33-Bus 69-Bus
150.09 151.42
33-Bus 69-Bus
136.5 144.41
f
2
(p. u.)
Singe Capacitor 0.069 0.065 3No. of Capacitor 0.0216 0.0287
f
3
(p. u.)
f 4 (p.u.)
1.33 1.31
47.61 139.63
1.09 1.12
39.26 98.15
Tables VII and VIII give the results which are compared with other existing techniques for 33 and 69 bus RDS respectively. It may be observed from the simulation results that distribution losses achieved due to installation of capacitors in optimal position obtained by different algorithms are reduced significantly.
To clarify the effect of capacitor units on the performance of power systems, some indices are calculated as shown in Table VI. TABLE IV PERFORMANCE ANALYSIS OF THE 33 BUS RDS AFTER CAPACITORS INSTALLATION After capacitor Before installation System capacitor Single 3No.of installation capacitor capacitors Optimal location of 30 24,14,30 capacitors Optimal size of 1200 508,416, capacitors (kVAr) 1052 Total kVAr placed 1200 1976 Total Active power 210.07 150.09 136.5 loss (kW) Total Reactive 142.53 102.99 93.12 power loss (kVAr) Voltage deviation 0.0958 0.0821 0.0598 (p.u.) Voltage Stability 1.4960 1.4089 1.2800 Index (p.u.) Overall power factor 0.8487 0.9640 0.9983 Vmin (p.u.) / Bus No. 0.9042/18 0.9179/ 18 0.9402/18
TABLE VII COMPARISON OF THE PROPOSED METHOD RESULTS WITH PREVIOUS PUBLICATIONS FOR 33 BUS RDS WITH THREE CAPACITORS Items
PGSA [8]a
Total Active power 135.4/ loss(kW)(Compensated / 202.67 Uncompensated) Active power loss 33.19 reduction (%) Optimal location of 6,28,29 Capacitor Optimal size of Capacitor 1200, (kVAr) 760,200 Total kVAr placed 2160 Min. voltage (p. u.) N/A (Compensated / Uncompensated) a Slight difference in load and line data.
Two stage method[17]
Proposed (MTLBO)
144.04/ 210.80
136.5/ 210.07
31.66
35.02
7,29,30
24,14,30
850, 25,900
508,416, 1052 1976 0.9402/ 0.9042
1755 0.9251/ 0.9038
TABLE VIII COMPARISON OF THE PROPOSED METHOD RESULTS WITH PREVIOUS PUBLICATIONS FOR 69 BUS RDS WITH THREE CAPACITORS Two stage PGSA Proposed Items PSO [9] method [8] (MTLBO) [17] Total Active 152.48/ 148.91/ 147.40/ 144.41/ power loss(kW) 224.98 224.79 224.98 224.54 (Compensated / Uncompensated) Active power loss 32.22 33.75 34.48 35.68 reduction (%) Optimal location 46,47,50 19,62,63 57,58,61 21,61,11 of Capacitor Optimal size of 781, 225, 1200, 238,1200, Capacitor (kVAr) 803,479 900, 225 274, 200 396 Total kVAr 2063 1350 1674 1834 placed Min.voltage (p.u.) N/A 0.9289/ N/A 0.9328/ (Compensated / 0.9092 0.9102 Uncompensated)
TABLE V PERFORMANCE ANALYSIS OF THE 69 BUS RDS AFTER CAPACITORS INSTALLATION After capacitor Before installation System capacitor Single 3No.of installation capacitor capacitors Optimal location of 61 21,61,11 capacitors Optimal size of 1200 238,1200, capacitors (kVAr) 396 Total kVAr placed 1200 1834 Total Active power 224.54 151.42 144.41 loss (kW) Total Reactive power 101.96 70.28 67.35 loss (kVAr) Voltage deviation 0.0898 0.0697 0.0672 (p.u.) Voltage Stability 1.457 1.335 1.321 Index (p.u.) Overall power factor 0.8084 0.9373 0.9800 Vmin (p.u.) / Bus No. 0.9101/65 0.9302/ 65 0.9325/65
Copyright © 2013 Praise Worthy Prize S.r.l. - All rights reserved
International Review of Automatic Control, Vol. 6, N. 6
709
Manas Ranjan Nayak, Kumari Kasturi, Pravat Kumar Rout
In addition, it should be pointed out that for 33 bus RDS accomplished with the installation of three numbers of capacitors, the proposed MTLBO algorithm attains active power loss reduction of 35.02 kW which is better than previously reported methods. Similarly, for 69 bus system, active power loss reduction of 35.68 kW is accomplished with the installation of three numbers of capacitors using the proposed MTLBO algorithm which is far better than the active power loss reduction of previously reported methods. Therefore, it can be concluded that MTLBO technique is more efficient than other techniques in reducing the power loss of 33 and 69 bus radial distribution systems. The convergence characteristics of objective function after the installation of capacitors (single and three numbers) obtained by the proposed algorithm for 33 and 69 bus RDS are illustrated in Figs. 5-6 and 7-8 respectively. Figs. 9 and 10 depict active power loss of each bus in 33 and 69 bus RDS respectively. It is observed that the three numbers of capacitors injecting reactive power results in higher real power loss reduction in the systems as compared to the single capacitor and without capacitor. Figs. 11 and 12 gives reactive power loss of each bus in 33 and 69 bus RDS respectively. It is seen that the three numbers of capacitors injecting reactive power results in higher reactive power loss reduction in the systems as compared to the single capacitor and without capacitor. Figs. 13 and 14 depicts voltage profile of each bus in 33 and 69 bus RDS respectively. The results show the different voltage levels during pre installation and post installation of the capacitors for proposed method.
Obj. function (Active power loss) in KW
162 160 158 156 154 152 150 0
10
20
30
40
50
60
70
80
90
100
No of Iterations
Fig. 7. Objective function ( f 1 ) Variation for 33 bus RDS with single capacitor Obj.Function(Active power loss) in KW
151 150 149 148 147 146 145 144 0
10
20
30
40
50 60 No of Iterations
70
80
90
100
Fig. 8. Objective function ( f 1 ) Variation for 69 bus RDS with 3 No. of capacitors 60 Without capacitor
Active Power Loss (KW)
50
With single capacitor With 3 No.of capacitor
40 30 20 10 0 0
10
15
20
25
30
35
Branch No.
Fig. 9. Active power loss (kW) before & after capacitor installation for 33 bus RDS
151.5
151
50
Without capacitor
45
With single capacitor
150.5
40
150 0
10
20
30
40
50 60 No of Iterations
70
80
90
100
Fig. 5. Objective function ( f 1 ) Variation for 33 bus RDS with single capacitor
With 3 No. of capacitors
35 30 25 20 15 10 5 0
141 Obj. function (Active power loss) in KW
5
152
Active power loss (KW)
Obj. function (Active power loss)in KW
152.5
0
10
20
30
40
50
60
70
Branch No.
140
Fig. 10. Active power loss (kW) before & after Capacitor installation for 69 bus RDS
139
Fig. 6. Objective function ( f 1 ) Variation for 69 bus RDS with 3 No. of capacitors
Pre installation of capacitors, voltage level in a 33 and 69 bus RDS are low. After installation of the single and three capacitors, the voltage levels are improved in the proposed method. Figs. 15 and 16 give bus voltage deviation of each bus in 33 and 69 bus RDS respectively. It is observed that the three numbers of capacitors injecting reactive power results in higher voltage deviation reduction in the systems as compared to the single capacitor and without capacitor.
Copyright © 2013 Praise Worthy Prize S.r.l. - All rights reserved
International Review of Automatic Control, Vol. 6, N. 6
138
137
136 0
10
20
30
40
50 60 No of Iterations
70
80
90
100
710
Manas Ranjan Nayak, Kumari Kasturi, Pravat Kumar Rout
0.09
35 Without capacitor With single capacitor With 3 No.of capacitors
25
Voltage deviation (p.u.)
Reactive power loss (KVAR)
30
20 15 10 5
0.08
Without capacitor
0.07
With single capacitor With 3 No. of capacitors
0.06 0.05 0.04 0.03 0.02 0.01
0 0
5
10
15
20
25
30
35
0
Branch No.
0
10
20
30
40
50
60
70
Bus No.
Fig. 11. Reactive power loss (kVAr) before & after Capacitor installation for 33 bus RDS
Fig. 16. Bus voltage deviation (p. u.) before and after capacitor installation for a 69 bus RDS
20 Without capacitor Reactive power loss (KVAR)
With single capacitor With 3 No. of capacitors
15
Figs. 17 and 18 give voltage stability index of each bus in 33 and 69 bus RDS respectively. The results show that the three numbers of capacitors injecting reactive power results in higher voltage stability index reduction in the systems as compared to the single capacitor and without capacitor.
10
5
0 0
10
20
30
40
50
60
70
Branch No.
Without capacitor 1.6 Voltage stability index (p.u.)
Fig. 12. Reactive power loss (kVAr) before & after Capacitor installation for 69 bus RDS 1.02 Without capacitor With single capacitor
Voltage magnitude (p.u.)
1
With 3 No. of capacitors 0.98
With single capacitor With 3 No. of capacitors
1.5 1.4 1.3 1.2 1.1
0.96
1 0
5
10
15
20
25
30
35
Bus No.
0.94
Fig. 17. Voltage stability index (p. u.) before and after capacitor installation for a 33 bus RDS
0.92 0.9 0
5
10
15
20
25
30
35 1.5
Bus No.
Without capacitor Voltage stability index (p.u.)
Fig. 13. Bus voltage level (p. u.) before and after Capacitor Installation for a 33 bus RDS 1.04 Wit hout capacit or Voltage magnitude ( p.u.)
1.02
Wit h single capacit or Wit h 3 No. of capacit ors
1
With single capacitor
1.4
With 3 No.of capacitors 1.3
1.2
1.1
0.98
1
0.96
0
10
20
30
Bus No.
40
50
60
70
0.94
Fig. 18. Voltage stability index (p. u.) before and after capacitor installation for a 69 bus RDS
0.92 0
10
20
30
40
50
60
70
Bus No.
B. Simulation results relating to economical saving In this section, the economical saving of proposed method for 33 and 69 bus RDS are presented and discussed. Following detailed case studies have been carried out that energy saving by using optimal placement and sizing of capacitors. In this way total cost of capacitors (Section III.3) is obtained and calculated. Tables IX and X show comparison the installation costs of capacitor, costs of capacitor and costs of energy losses for pre installation and after installation of capacitors in both systems. Saving or benefit of reduction in energy cost of losses and net savings or benefits including the total costs in a one year time period can be seen in Tables IX and X.
Fig. 14. Bus voltage level (p. u.) before and after capacitor installation for a 69 bus RDS 0.12 Without capacitor With single capacitor
Voltage deviation (p.u.)
0.1
With 3 No.of capacitors 0.08 0.06 0.04 0.02 0 0
5
10
15
20
25
30
35
Bus No.
Fig. 15. Bus voltage deviation (p. u.) before and after capacitor installation for a 33 bus RDS
Copyright © 2013 Praise Worthy Prize S.r.l. - All rights reserved
International Review of Automatic Control, Vol. 6, N. 6
711
Manas Ranjan Nayak, Kumari Kasturi, Pravat Kumar Rout
[2]
According to the Table IX, net annual savings of 33 RDS for single and three capacitors are 26925 $ (24.38%) and 29740 $ (26.93%), respectively. From the Table X, net annual savings of 69 RDS for single and three capacitors are 33832 $ (28.66%) and 33615 $ (28.48%), respectively.
[3]
[4]
TABLE IX COMPARISON OF FINAL SOLUTION AND COMMERCIAL INFORMATION OF CAPACITORS FOR 33 RDS 33 Bus Information Without Single Cap. 3No.of Cap Cap. Capacitor installation cost ($ ) 1000 3000 Cost of capacitor ( $) 3600 5928 Energy cost of losses for one 110412 78887 71744 year ($ ) Benefit of reduction in energy 31525 38668 cost ($) Net annual savings ($) 26925 29740 Net annual savings (%) 24.38 26.93
[5]
[6]
[7]
[8]
TABLE X COMPARISON OF FINAL SOLUTION AND COMMERCIAL INFORMATION OF CAPACITORS FOR 69 BUS RDS 69 Bus Information Without Single Cap. 3No.of Cap. Cap. Capacitor installation cost ($ ) 1000 3000 Cost of capacitor ( $) 3600 5502 Energy cost of losses for one 118018 79586 75901 year ($ ) Benefit (Saving) of reduction 38432 42117 in energy cost of losses for one year ($) Net annual savings ($) 33832 33615 Net annual savings (%) 28.66 28.48
[9]
[10]
[11]
[12]
[13]
VIII.
Conclusion
[14]
In the paper MTLBO method was proposed to solve placement and sizing problems for capacitors simultaneously in 33 and 69 bus radial distribution systems. The proposed method stated less objective function values in state of existence capacitors. Also this method showed less real power losses in comparing with the results of other popular optimization techniques. After capacitors installation, the both methods have shown major improvement in voltage profile, increase the voltage Stability index and balance the loads for the proposed method. By using the proposed method in addition to its technical advantages, an economic saving or benefit is obtained after one year. Considering active power losses, reactive power losses, voltage stability index, voltage deviation index, voltage profile index, load balancing and the value for objective function along with economic issues, it can be concluded that the proposed method exhibited a higher capability in finding optimum solutions compared to results of other popular optimization methods.
[15]
[16]
[17]
[18]
[19]
[20]
References [1]
Shirmohammadi D., Hong H. W., Semlyen A. and Luo G. X., A Compensation - Based Power Flow Method for Weakly Meshed Distribution and Transmission Networks, IEEE Transactions on Power Systems, vol. 3, no. 2, 1988, pp. 753-762. Ghosh S. and Das D., Method for load-flow solution of radial distribution networks, IEEE Proceedings on Generation, Transmission & Distribution, vol. 146, no. 6, 1999, pp. 641-648. Goswami, S.K., and Basu, S.K., Direct solution of distribution systems, IEEE Proc. C., 188, (I), 1991, pp.78-88. Das D., Optimal Placement of Capacitors in Radial Distribution System using a Fuzzy-GA method, Electrical Power and Energy System, vol. 30, 2008, pp.361-367. Sundhararajan S. and Pahwa A., Optimal Selection of Capacitors for Radial Distribution Systems using Genetic Algorithm, IEEE Transactions on Power Systems, vol. 9, no. 3, 1994, pp. 4991507. Kasaei M. J., Gandomkar M., Loss Reduction in Distribution Network Using Simultaneous Capacitor Placement and Reconfiguration with Ant Colony Algorithm, IEEE Transaction on Power and Energy Engineering Conference (APPEEC), 15 April 2010,pp.1-4. Sarma A. Kartikeya and Rafi K. Mohammand, Optimal Selection of Capacitors for Radial Distribution Systems Using Plant Growth Simulation Algorithm, International journal and science and technology, vol.30, May, 2011, pp.43-54. Sydulu M. and Prakash K., Particle swarm optimization based capacitor placement on radial distribution systems in: IEEE Power Engineering Society general meeting 2007. pp. 1-5. Taher S, Bagherpour R. A new approach for optimal capacitor placement and sizing in unbalanced distorted distribution systems using hybrid honey bee colony algorithm. Int J Electr Power Energy Syst.vol. 49, 2013, pp.430–48. Tabatabaei SM , Vahidi B. Bacterial foraging solution based fuzzy logic decision for optimal capacitor allocation in radial distribution system. Electr Power Syst Res, vol.81(4), 2011,pp.1045-50. Haque, M.H., Efficient load flow method for distribution systems with radial or mesh configuration.IEE Proc. On Generation, Transmission and Distribution. Vol. 143(1), 1996, pp. 33-38. Charkravorty M., Das D., Voltage stability analysis of radial distribution networks, International journal of Electrical Power and Energy Systems.vol. 23(2), 2001, pp.129-135. Srinivas R. and Narasimham S.V.L., Optimal capacitor placement in a radial distribution using plant growth simulation algorithm, Proceedings of world academy of science, Engineering and Technology,vol.35, 2008, pp.716-723. Rao, R.V., Savsani, J.V., Balic, J., ‘Teaching-learning based optimization algorithm for unconstrained and constrained realparameter optimization problems’, Engg. Opt., vol. 44 (12), 2012, pp.1447-62. Moradi MH, Abedini M. A combination of genetic algorithm and particle swarm optimization for optimal DG location and sizing in distribution systems. Int J Electr Power Energy Syst , vol.34(1), 2012,pp. 66–74. Ahmed R., Abul wafa . Optimal capacitor allocation in radial distribution systems for loss reduction: A two stage method. Electric Power Systems Research, vol.95, 2013, pp. 168–174. Aman, M.M., Jasmon, G.B., Bakar, A.H.A., Mokhlis, H., Optimum capacitor placement and sizing for distribution system based on an improved voltage stability index, (2012) International Review of Electrical Engineering (IREE), 7 (3), pp. 4622-4630. Shashank, T.R., Rajesh, N.B., Analysis of Fast Voltage Stability Index on long transmission line using Power World Simulator, (2013) International Review on Modelling and Simulations (IREMOS), 6 (3), pp. 888-892. Sattianadan, D., Sudhakaran, M., Dash, S.S., Vijayakumar, K., Cost / loss minimization by the placement of DG in distribution system using ga and PSO - A comparative analysis, (2013) International Review of Electrical Engineering (IREE), 8 (2), pp. 769-775.
Billinton R., Allan R.N., Reliability evaluation of Power Systems (Plenum, New York, 1996, 2nd edn.).
Copyright © 2013 Praise Worthy Prize S.r.l. - All rights reserved
International Review of Automatic Control, Vol. 6, N. 6
712
Manas Ranjan Nayak, Kumari Kasturi, Pravat Kumar Rout
Authors’ information Manas Ranjan Nayak was born in 1972, india. He received his B.E. degree in Electrical Engineering from I.G.I.T.Sarang (Utkal University, India) and M.E. degree in Electrical Engineering from U.C.E., Burla (Sambalpur University, India) in 1994 and 1995 respectively. For 1998 – 2008, he was with Orissa Hydro Power Corporation Ltd. (A Govt. Odisha PSU) as Asst. Manager (Electrical) and since 2008 he has been with Electrical Engineering Deptt. , ITER, Siksha ‘O’ Anusandhan University, Bhubaneswar, Odisha, India-751030 and continuing as an Associate Professor. His research interests include power system operation and planning, Distribution Network, Distributed Generation, FACTS and Application of Soft computing techniques to power system optimization. Prof. Nayak has membership in professional societies i.e. IET (70472641) and ISTE (LM-71207) Postal address: House No.-51, Road No.-12, Jagannath Nagar, P.O.G.G.P.,Bhubaneswar,Odisha,India,Pin-751025. Tel.: +919437332558 E-mail:
[email protected] Kumari Kasturi was born in 1986, India. She received her B.Tech degree in Electrical Engineering from Biju Pattanaik University (BPUT), Odisha, India and M. Tech. degree in Electrical and Electronic Engineering from I.T.E.R,SOA University, Odisha, India. Since 2008, she has been with Electrical Engineering Deptt. , I.T.E.R, Siksha ‘O’ Anusandhan University, Bhubaneswar, Odisha, India-751030 and continuing as an Assistant Professor. Her research interests include power system operation and planning, Distribution Network, Distributed Generation and Application of Soft computing techniques to power system optimization. Postal address: 126, Ratnakarbag, Tankapani Road, Bhubaneswar, Odisha, India, Pin-754018. Dr. Pravat Kumar Rout was born in 1969, India. He is a Professor with the department of Electronic & Electrical Engineering, under the Faculty of Engineering & Technology, Siksha ‘O’ Anusandhan University, Bhubaneswar. He received his M.E. degree in Electrical Engineering from Thigarajar College of Engineering, Madurai, and Ph.D degree in Electrical Engineering from Biju Patnaik University of Technology, India, in 1995 and 2010, respectively. His research interests include power system control and power system optimization through evolutionary computation, Distribution Network, Distributed Generation, Custom Power (DFACTS) and FACTS. Postal address: Plot.No.-614/2081, Lane No. 8, Shree Vihar, Chandrasekharpur, Bhubaneswar, Odisha, India, Pin-751031.
Copyright © 2013 Praise Worthy Prize S.r.l. - All rights reserved
International Review of Automatic Control, Vol. 6, N. 6
713
International Review of Automatic Control (I.RE.A.CO.), Vol. 6, N. 6 ISSN 1974-6059 November 2013
A Backstepping Approach for Airship Autonomous Robust Control Y. Meddahi, K. Zemalache Meguenni, M. Tahar, M. A. Larbi Abstract – In this paper, we present the robust control of a dirigible airship. In the first part of this paper, kinematics and dynamics modeling of autonomous airships is presented. Euler angles and parameters are used in the formulation of this model and the technique of Backstepping control is introduced. In the second part of the paper, we develop a methodology of control that allows the dirigible to accomplish a prospecting mission of an environment, as the follow-up of a trajectory by the simulation who results show that Backstepping control method is suitable for airships. Copyright © 2013 Praise Worthy Prize S.r.l. - All rights reserved.
Keywords: Autonomous Airship, Blimp, Backstepping Control, Lyapunov Function
The airship is a member of family of under-actuated systems it has fewer input than degrees of freedom and the principle of Archimedes applies in the air as well as under water. We described the basic movements of the airship, and then gave a dynamic model of our system by the formalism of Newton. The complete model includes almost all physical phenomena acting on the airship. This model shows the coupled nature, complex, non-linear, multi-variable and operating under our airship, which makes the synthesis of controlling relatively difficult. The control theory is a branch of the theory of dynamical systems. Its primary objective is to manipulate the input variables ( ) of a given system to subjugate its output variables ( ) to a reference trajectory ( ). A control airship has motivated numerous studies in recent years. These devices are able to take off and land vertically, with a large payload capacity and easy to handle are of obvious interest for military and civilian applications. Generally, as well as all air vehicles, they are by nature unstable, under actuated and complex. The introduction of stabilizing control laws and the design of navigation strategies quickly proved indispensable to alleviate the workload of the pilot on the one hand and make systems more independent of the other. The emergence of fully autonomous aerial platforms led to consider new control objectives: beyond the control attitude which serves a purpose control, it is now to ensure the control position, which corresponds to an objective guide. The main objective of this paper is the synthesis of stabilizing control laws in terms of translation and orientation for the airship. The airship is a rotary wing air vehicle; the difficulty of control is mainly due to its complex dynamics, nonlinear multi variable and especially in its operation. We used several techniques to control nonlinear. All orders are stabilizing designed to ensure the continuation of desired trajectories along the three axes (X, Y, and Z).
Nomenclature [ , , ] [ , ]
[ , ]
( , ), L, D
( , )
I.
Position vector Euler angles yaw, pitch Velocity of airship Masse of the vehicle Force developed by propulsion Angles of the rudders and elevators Setting of the reference area Density of the air Mach number Volume of the vehicle Force of buoyancy Parameters of lift and drag Lift and drag forces
Introduction
Unmanned aerial vehicles can be divided in two different types rotary wing aircraft (helicopter) and lighter than air vehicles (airships). In relation to the other drones (UAV), the dirigibles have a very low cost to maintain themselves in flight and have the possibility to fly in low-altitude and with low speed. The blimp is an envelope of ellipsoid shape filled of helium gas, provided with propeller to assure the control. The airships are divided in two types, the small airship (laboratory) and the big airship (outside). the dirigible is my research because the airship has an important application potential, it suit a wide range of applications as surveillance ,aerial photography ,research ,advertising ,communication plat form , transportation , observation and military roles [1]. The first objective of this article is to present a model of the autonomous airship (kinematics and dynamics) and we propose technique of a control for dynamic model (Backstepping). This dynamic model is developing by “Y. Bestaoui” based with Newton-Euler approach [2].
Manuscript received and revised October 2013, accepted November 2013
714
Copyright © 2013 Praise Worthy Prize S.r.l. - All rights reserved
Y. Meddahi, K. Zemalache Meguenni, M. Tahar, M. A. Larbi
The control strategy is based on the decomposition of the original system into two subsystems: the first concerns the position control while the second is the control orientation and the velocity. The Backstepping Kanellakopoulos was developed by [3], and inspired by the work of Feurre & Morse [4], Sussmann and Kokotovic [5]. The basic idea is to let some system states act as virtual inputs. The backstepping uses a form of system integrators chain after a coordinate transformation for a triangular system based on the direct method of Lyapunov. The method consists of fragmented system into a set of subsystem nested descending order. From the, it is possible to design systematically and recursively controllers and corresponding Lyapunov functions [6] [7] [8]. Many published works on the dynamic model and the control of lighter than air vehicles. In [9] [10] [11] motion is referenced to a system of orthogonal body axes located in the airship. This model was written originally for a buoyant underwater vehicle [9]. It was modified later to take into account the specificity of the airship [10] [11]. This model was modified by [12] this modification has the particularity origin of the airship fixed frame is located in the centre of gravity. Recall that the centre of buoyancy is the centre of the airship volume. But in these papers, we used new dynamic model developed by [2] and we propose to control of this model. Many works are published in the control of the lighter than air vehicles for examples: In [13] they are proposed the linear control theory applied to the linearization. In [14] proposed nonlinear adaption controller stabilizing the error system is designed by Lyapunov direct method and Matrosov theorem. While in the cited works, they are used the decoupled linear models comprised the longitudinal and lateral models. In [15] they are addressing the problem of designing tracking feedback control. In [16] they are designed an adaptive feedback linearization control. In [17] they are presented an improved sliding mode control. In [18] the dynamic in the vertical plane are analyzed and controlled, using maximal feedback linearization. In [19] a fuzzy adaptive backstepping control is presented, and the trajectory control method for under actuated stratospheric airship is proposed in [20] based on TLC theory. In this paper, the Backstepping controller and motion planning are combined to stabilize the airship by using the point to point steering stabilization. Modeling is briefly described Section II. Section III describes Backstepping controllers. In Section IV, simulation results are presented. Finally, some conclusions and future work are given in the last section.
II.
It aims to fly in the stratosphere. Buoyancy is provided by helium contained in the envelope. The avionics system, power system and payloads are equipped in a gondola fixed below the envelope. The aerodynamic control surfaces like rudders and elevators attach to the empennage surfaces. In this research, the up and down rudders move together, while the left and right elevators are differential and move separately. Therefore, the deflections of the rudders control the yaw movement whereas the elevators influence the pitch and rotation. The propellers are fixed on both sides of the gondola and are vectored thrust systems with rotation units about their horizontal axes. The propellers provide main propulsive force for flight.
Fig. 1. Structure of the Airship
The dynamic modeling of lighter with air (airship) is deduced from Newton’s laws of classical mechanics. We are analyzing the motion of an airship with six degrees of freedom. When we are considering the velocity of the wind is null. We described two references frames (inertial and body-fixed), so the kinematic equations are given by: ̇= ̇ = ̇=
( ) ( ) ( )
( ) ( )
(1)
The translation equations are followed as: ⎧ ⎪ ⎪ ⎨ ⎪ ⎪ ̇ ⎩
( ) + ) −( − ̇= ( + ) ( ) + ̇ = ( + ) 1 ( = +( − +
The forces of the lift given by: 1 ( ⎧ = 2 ⎪ 1 ⎨ =2 ( ⎪ ⎩ = ·
Airship Translation Dynamics
The airship (Fig. 1) studied here has a traditional ellipsoidal envelope.
Copyright © 2013 Praise Worthy Prize S.r.l. - All rights reserved
, drag
( ) ( ) ( ) ( ) )− ) ( )
(2)
and buoyancy b are
, ) , )
(3)
·
International Review of Automatic Control, Vol. 6, N. 6
715
Y. Meddahi, K. Zemalache Meguenni, M. Tahar, M. A. Larbi
and:
For the first step we consider the tracking error: ( , )= ( , )=
( )+ +
( )
(4)
=
−
(6)
: is the desired velocity. Its derivative is computed as:
III. Backstepping C ontroller III.1. Conventional Backstepping
= ̇− ̇ ̇
Backstepping controllers are especially useful when some states are controlled through other states [21]. Backstepping has become a popular nonlinear control design technique, which hinges on using a part of the system states as virtual controls to control the other states [22]. The term Backstepping refers to the recursive nature of the control design procedure in which a control law and a control Lyapunov function are recursively constructed to guarantee stability. Readers may refer to [23] for a survey of results in this area. The Backstepping control approach has shown itself very effective in dealing with systems with multiple dynamics, such as mechanical systems driven by electrical systems or multiple coupled mechanical systems [24]. This system described is constituted of two subsystems, the dynamic model (angular rotation and the velocity) and the kinematic (the linear translation). First we notice that motion in the translations can be controlled through the changes of the pitch, yaw angles and the velocity. These variables are related by the cascade system.
(7)
where two Eqs. (6) and (7) are associated in Lyapunov function, using the Lyapunov function as: ( ̇(
)=
)= ̇
1 2
(8) ̇− ̇
=
(9)
The stabilization of can be obtained by introducing a virtual control input x2d such that: = ̇ +
(10)
> 0:
with
= ̈ + ̇
̇
(11)
The Eq. (9) is then: ̇(
1) Backstepping control of the dynamic model The velocity, the pitch and the yaw can be controlled by a feed forward controller (Fig. 2).
)=−
(12)
For the second step we consider a variable change by making: = ̇− ̇ − The derivative of
(13)
is computed as:
= ̈− ̈ − ̇
̇
(14)
We consider the augmented Lyapunov function: (
)=
,
1 ( 2
+
)
(15)
The derivative of Eq. (15) is calculated as: Fig. 2. Backstepping controller for dynamic model
̇(
From the model (2) one can see that through the velocity depend on , on the other hand , control through the angles , respectively. The movement equation is given by: ̇ =
1 +
̇
+
̇
(16)
Thus giving: ̇(
( )− ) ( ) +( −
)=
,
,
)=
+
(− − ̈− ̈ −
) ̇
(17)
(5) and:
We use the Backstepping algorithm to develop the control allowing the system to follow the desired trajectory; In fact, the algorithm Backstepping is described step by step in the following.
V̇ (e , e ) =
Copyright © 2013 Praise Worthy Prize S.r.l. - All rights reserved
+e
−K e + V̈ − V̈ − e + − K (−K e − e )
(18)
International Review of Automatic Control, Vol. 6, N. 6
716
Y. Meddahi, K. Zemalache Meguenni, M. Tahar, M. A. Larbi
, control the motion through the axes , respectively. This leads to a Backstepping controller for which , , are given by:
The control input is appears in Eq. (18). We achieve the control that give the expression equal to − , with is positive constant, the final control is:
̇ =
⎡ ⎢ ⎢ ⎢+ ⎣
( )+ ̇ ̇ ) ( ) − ̇( − ̈ −( ) + ( + ) −(1 −
⎤ ⎥ ⎥ )⎥ ⎦
̇ (19)
1
=
+
Verifying that: ̇(
,
)=−
−
1
̇=
(20)
Hence, the Backstepping control is asymptotically stabilizing. The yaw and pitch attitudes can be stabilized to a desired value with the following tracking feedback control. ( +
̇=
⎡ ⎢ ⎢ ⎢ ⎢ ⎢ ⎢ + ⎣
̇
) ) +( − ( ) + ̇ + − ̇+ ̇ ) − ̇( − ̈ − + ( + − 1−
̇ ( ⎡ − ̇ ⎢ ⎢ ( ̇+ ̇ ⎢ − ⎢ ) ⎢+ ( + ⎣ ϒ ̇= ( + ) where , , and and positive constants.
)
+ +
)
̇
)
̈ –( – – (1–
) )
(23)
̈ − ( ) – ) – (1– −( ̇ − ̇ )
(24)
̈ − ( ) – ) – (1– − ̇
(25)
where , , , , and of stability and positive constants.
⎤ ⎥ ⎥ ⎥ ⎥ (21) ⎥ ⎥ ⎦
⎤ ⎥ ⎥ ⎥ ⎥ ⎥ ⎦
1
̇=
̈ − ( ) – ) – (1– ̇ + ̇
IV.
are the coefficients
Simulation and Discussion
To evaluate the designed control system, repetitive simulation tests were performed via numerical simulation. The control system was simulated using the variable step Runge–Kutta integrator in MATLAB. In the following simulation, one typical trajectory, ascendant straight line is selected as the desired trajectories to verify the proposed control method. The model parameters of the airship platform are defined as: = 18.375 (kg) = 15 (m ) = 1.225 = 1.247 · ρ (kg) = 17.219 · ρ (kg) = 16.671 · ρ (kg) = 9.8 (m/s ) = 0.5 = 0.024 = 0.937 = 1.4 = 2.84
(22)
are the coefficients of stability
2) Backstepping control of the kinematic model The motion through the axes , and can be controlled by a feed forward controller (Fig. 3).
For the backstepping control simulations, the gains are chosen as follows: For dynamic model: K
= 250, K = 130, K = 25, K = 2, K γ = 16, K γ = 1.5
For kinematic model: Fig. 3. Backstepping controller for kinematic model
K
From the model (1) one can see that the motion through the axes Z depends on γ, on the other hand
Copyright © 2013 Praise Worthy Prize S.r.l. - All rights reserved
= 16, K = 2.3, K = 10.5, K K = 15, K = 6.9
= 5.6,
International Review of Automatic Control, Vol. 6, N. 6
717
Y. Meddahi, K. Zemalache Meguenni, M. Tahar, M. A. Larbi
5 ev (m/s)
The desired trajectory for ascendant straight line tracking simulation is performed as:
0 -5 -10
X = 4t Y = 3t Z = 0.1t epsi(rad) egama(rad)
1.5
z(m)
14
16
18
20
0
2
4
6
8
10
12
14
16
18
20
0
2
4
6
8
10 time(s)
12
14
16
18
20
Fig. 4 shows the simulation results of backstepping control with accurate parameters and without external disturbances. In Fig. 4 confirm the robustness of proposed trajectory tracking control method. As illustrated in the above figures, the convergence to the trajectory is guaranteed after a transient behavior. It can be observed that the airship platform trends to the target point precisely, which demonstrates that the proposed approach succeeds in station keeping control for the airship platform. Figs. 5-6 show that the position errors and the translation dynamic (velocity and orientations) of the airship platform with accurate parameters and without external disturbances. The position errors are converging to zero within 2.5 s. The orientations have to leave a 0.4 rad at the first 2.5 s, and then converge to desired value. The abovementioned results demonstrate that the stationkeeping control is accomplished with precision using the designed control system. In Fig. 7 present the translation errors (the velocity, orientations) of the airship. These errors are converging to zero within 2.5 s. The above mentioned results demonstrate that the backstepping control is accomplished with precision using the designed control system. In conclusion, the simulation results verify that the trajectory tracking control method designed in this paper for airship is efficient.
Ref Rep-Back 60
80 60
40 40 20
20 0
y(m)
0 x(m)
Fig. 4. Result of position trajectories for line tracking 0.4
ex (m)
0.2 0 -0.2 -0.4
0
2
4
6
8
10
12
14
16
18
20
0
2
4
6
8
10
12
14
16
18
20
0
2
4
6
8
10 time(s)
12
14
16
18
20
0.2 0 ey(m)
12
Fig. 7. Control errors without disturbances
0 80
-0.2 -0.4 -0.6
0.2
ez(m)
0.1 0 -0.1 -0.2
Fig. 5. Control errors without disturbances 10 v(m/s)
10
1
0.5
5 0
0
2
4
6
8
10
12
14
16
18
20
V.
1 psi(rad)
8
0
-0.5
0
2
4
6
8
10
12
14
16
18
20
0
2
4
6
8
10 time(s)
12
14
16
18
20
Conclusion
In this paper, dynamics of lighters than air (airships) are studied using Newton Euler approach and we discussed Backstepping controllers of an unmanned blimp. For complex non-linear movement of blimps we can design its Backstepping controllers but don’t use the linearization of this model. The dynamic translation control problem for the solution has been proposed. The objectives were to test the capability of an airship to control with these techniques. The simulation results indicate that the Backstepping controllers can provide stronger robust
0.5
0.5 gama(rad)
6
0.5
2
0
-0.5
4
0
-0.2
0
2
0.2
The simulation results are shown in Figs. 4-7.
-5
0
Fig. 6. Control inputs without disturbances
Copyright © 2013 Praise Worthy Prize S.r.l. - All rights reserved
International Review of Automatic Control, Vol. 6, N. 6
718
Y. Meddahi, K. Zemalache Meguenni, M. Tahar, M. A. Larbi
[20] Zewei Zheng, Wei Huo, Zhe Wu, Trajectory tracking control for Underactuated Stratospheric Airship, Advances in Space Research 50 (2012) 906-917. [21] Ackermann J, Bunte T. Yaw, ‘disturbance attenuation by robust decoupling of car steering’. Control Eng Pract. 1997; 5(8):1131-6. [22] Krstic M, Kokotovic PV, Kanellakopoulos I. ‘Nonlinear and adaptive control design’, John Wiley & Sons, Inc. New York, NY, USA, 1995. [23] Kokotovic P, Arcak M. Constructive nonlinear control, a historical perspective. Automatica.2001, 37(5):637-62. [24] Bihua Chen, Zongxia Jiao, Shuzhi Sam Ge, Aircraft On-ground Path Following Control by Dynamical Adaptive Backstepping, Chinese Journal of Aeronautics, Volume 26, Issue 3, June 2013, Pages 668–675.
performance to blimps maneuvering. The Backstepping controllers will be employed in further developing. As a future works, we will essentially use other controller sliding mode and compare with this controller (Backstepping) and develop an algorithm for controller’s parameter because this parameter is the problem of the nonlinear controller.
References [1]
[2]
[3]
[4]
[5]
[6]
[7]
[8] [9] [10]
[11] [12]
[13]
[14]
[15]
[16]
[17] [18]
[19]
Johan Bijker, Willem Styn, Kalman filter configurations for a low-cost loosely integrated inertial navigation system on an airship, Control Engineering Practice, Volume 16, Issue 12, December 2008, Pages 1509–1518. Y. Bestaoui Sebbane, lighter than air robots. Intelligent systems control and automation: journal of Guidance, Control, and Dynamics Vol. 32, No. 4, Jul-August 2009 I. Kanellakopoulos systematic design of adaptive controllers for feedback linearisable Systems», IEEE. Transaction on automatic control vol. 36(11), pp 1241-1253, July 2000. A. Feurrel & A.S. Morse, ‘Adaptive control of single-input, single-output linear systems’, IEEE. Transaction on automatic control vol. 23 (4), pp 557-569, July 2000. P.V, Kokotovic and H.J, Sussman, «A positive real condition for global stabilization of nonlinear systems», systems &control letters vol.13, pp 125-133, July 2000. K. Zemalache Meguenni, M. Tahar, M. R. Benhadria, Y. Bestaoui, Integral Backstepping Controller for an Autonomous Helicopter, (2010) International Review of Aerospace Engineering (IREASE), 3 (5), pp. 257-267. K. M. Zemalache, L. Beji, H. Maaref, «Two Inertial Models of X4-Flyers Dynamics, Motion Planning and Control», Journal of the Integrated Computer-Aided Engineering (ICAE), Vol. 14, No. 2, pp. 107-119, January 2007. J. Tisinias sufficient Lyapunov-like conditions for stabilization», Math. Control. Signal. systems2, pp 343-357, July 2000. T. I. Fossen, Guidance and Control of Ocean Vehicles John Wiley Sons Ltd, Chichester, (1994). E. Hygounec, P. Soueres, S. Lacroix’ Modélisation d’un ballon dirigeable, Etude de la cinématique et dynamique ‘ CNRS report, 426, LAAS, Toulouse, France, October 2000. G. A. Khoury, J. D. Gillet, eds. Airship technology, Cambridge University press, (1999). Y. Bestaoui, T. Hamel, Dynamic Modelling of Small Autonomous Blimps’, Conference on Methods and models in automation and robotics, Miedzyzdroje, Poland, (2000), vol.2, pp.579-584. L. Beji, A. Abichou, Y. Bestaoui, ‘Stabilisation of a Nonlinear Underactuated Autonomous Airship-A Combined Averaging and Backstepping Approach’ third international Workshop on Robot Motion and Control, November 9-11, 2002. ZHANG Yan QU Wei-Dong XI Yu-Geng CAI Zi-Li, ‘Adaptive Stabilization and Trajectory Tracking of Airship with Neutral Buoyancy’, Vol. 34, No. 11 November, 2008 L. Beji & A. Abichou, ‘Tracking control of trim trajectories of a blimp for ascent and descent flight maneuvers’, International Journal of Control, 2005. Wu Yongmei, Zhu Ming, Zuo Zongyu, Zheng Zewei, ‘Trajectory Tracking of a High Altitude Unmanned Airship Based on Adaptive Feedback Linearization’, International Conference on Mechatronic Science, Electric Engineering and Computer, August 19-22, 2011, Jilin, China. YANG Yueneng, ZHENG Wei WU Jie, Sliding Mode Control for a Near Space Autonomous Airship, 2011 IEEE. Xiaotao Wu, Claude H. Moog, Luis Alejandro Marquez-Martinez, Yueming Hu, Full model of a buoyancy-driven airship and its control in the vertical plane, Aerospace Science and Technology 26 (2013) 138-152, Elsevier. Yueneng Yang, Jie Wu, Wei Zheng, Station-keeping control for a stratospheric airship platform via fuzzy adaptive backstepping approach, Advances in Space Research 51 (2013) 1157–1167.
Authors’ information Meddahi Youssouf received the Master Degree in Electrical Engineering from University of Sciences and Technology of Oran M-B (USTO), Algeria, in 2009. His research interests include nonlinear control of mechanical systems, control system analysis and design tools for under-actuated systems with applications to aerospace vehicles in LDEE laboratory. Kadda Zemalache Meguenni received the Dipl.-Ing. Degree in Electrical Engineering from University of Sciences and Technology of Oran M-B (USTO), Algeria, in 1998, Master Degree from USTO in 2001 and received the PhD from Evry University, France, in 2006. His research interests include nonlinear control of mechanical systems, robotics, and control system analysis and design tools for under-actuated systems with applications to aerospace vehicles. Tahar Mohamed received both his electrotecnics engineer and ME from the Electrotecnic Institute, University of Sciences and Technology, Oran (USTO). He was a head of the Electrotecnic Institute in Oran. He is currently a researcher in nonlinear control in LDEE laboratory.
Larbi Mohamed Elamine was born in Relizane Algeria on June 25. 1986. He received both his license in automatic and Master in automation and control of intelligent industrial system from the automatic department, University of Sciences and Technology, Oran (USTO). He is currently a researcher in nonlinear robust control and observation in LDEE laboratory.
Copyright © 2013 Praise Worthy Prize S.r.l. - All rights reserved
International Review of Automatic Control, Vol. 6, N. 6
719
International Review of Automatic Control (I.RE.A.CO.), Vol. 6, N. 6 ISSN 1974-6059 November 2013
Advanced Interactive Tools for Analysis and Design of Nonlinear Robust Control Systems Kamen M. Yanev Abstract – This paper contributes for the further advancement of the analysis and design of robust nonlinear control systems. A nonlinear on-off element with hysteresis is considered as a nonlinear section of the plant discussed in this research. An innovative robust controller design is accomplished by a number of successive steps. Based on the difference equations of its stages, the robust controller is realized by two microcontrollers. Taking into account the Euler's approximation, the method of the D-partitioning and the describing-function stability analysis, as well as robust assessment are applied before and after the robust compensation. The research is a further development of the author’s work on the analysis and design of linear and digital robust control systems. The suggested innovative tool for analysis and design of nonlinear robust control systems by applying a digital robust controller is vital and useful for the further advancement of control theory in this field. Copyright © 2013 Praise Worthy Prize S.r.l. - All rights reserved.
Keywords: Nonlinear, D-Partitioning Stability Analysis, Interaction, Describing Function Stability Analysis, Discrete-Time Domain, Microcontrollers
The system’s stability and robust assessment is based on the interaction between its nonlinear and linear sections. D-partitioning [1], [2], [3] and describing function analyses [4], [5] are implemented before and after the robust compensation. The lack of a comprehensive and user friendly analysis tool for control systems, consisting of linear and nonlinear parts is the motivating factors for this research. The D-partitioning assessment of the linear section of the nonlinear system is a significant part in the overall analysis. It verifies the precondition of a stable linear section, to achieve the overall stability of the system. The interaction assessment between the linear and nonlinear stages of the system with the aid of the Goldfarb stability criterion is based on the describing-function analysis and examines the stability and the robustness of the resulting limit cycles [4], [5]. The describing function approach enables the application of frequency-response methods to reshape the locus of the plant’s linear section and as suggested in this research to improve the response characteristics. An optimal digital robust controller is implemented based on two-step compensation and operating in two degrees of freedom [6]. The approach used to realize the robust controller is to implement digital filters based on microcontrollers [7] that correspond to the robust controller stages.
Nomenclature GP(s) s N(M) Ts Tmin G(s) K s m n K1 h M D(0) D(1), D(2) GCL(s) GS(s) GF(s) GOLSP(s) z GS(z) GF(z)
Plant’s linear section transfer function Laplace operator Plant’s nonlinear describing function Sampling period Minimum time-constant of GP(s) System’s characteristic equation Variable system’s gain Frequency, rad/s Sampling frequency, rad/s Input to the nonlinear element Output from the nonlinear element Saturation factor Hysteresis factor Amplitude of the input variations D-partitioning region of stability D-partitioning regions of instability Plant’s unity feedback transfer function Series controller stage transfer function Forward controller stage transfer function Open loop series connection of GS and GP Discrete-time domain operator Series controller stage transfer function in the discrete-time domain Forward controller stage transfer function in the discrete-time domain
I.
Introduction
II.
This research suggests an interactive strategy for analysis and design of nonlinear robust control system with variable parameters.
Original Control System Analysis
For reaching the objectives of the research, a real-time system of a tight-speed control of a DC motor is explored [8].
Manuscript received and revised October 2013, accepted November 2013
720
Copyright © 2013 Praise Worthy Prize S.r.l. - All rights reserved
Kamen M. Yanev
>> K=tf([-1 -189 -8667 -111111],[0 2400000]) >> nyquist(K)
Its continuous linear part is preliminary reduced and approximated to a third order system with a transfer function GP(s). Its nonlinear part is an ON-OFF element with hysteresis, having a describing function N(M). A control system of such nature operates in a limit cycle of specific amplitude and frequency that is permissible in particular applications. The D-partitioning analysis is applied only to the continuous plant of the control system in the discrete-time domain, considering the Euler's approximation [9], rather than the NyquistShannon theorem [10]. The digital robust control of the nonlinear system is shown in Fig. 1.
The D-partitioning curve is considered only within the range –31416 rad/s +31416 rad/s, taking into account that the frequency limits in the discrete-time domain are = s/2 = 2/2Ts = 31416 rad/s.
Fig. 1. Modified Model of the Control System
II.1.
Fig. 2. D-Partitioning in Terms of the Variable Gain
D-Partitioning Applied to the Original System
The D-partitioning of the continuous linear part, as seen from Fig. 2, determines three regions on the KPlane: D(0), D(1) and D(2). Only D(0) is the region of stability, being always on the left-hand side of the Dpartitioning curve [3], [11]. This implies that the system is stable only when its gain is within the range 0 K 0.625. The marginal step response at K = 0.625, in the discrete-time domain, is depicted in Fig. 3.
The Euler's approximation states that the sampling period Ts should be at least 10 times smaller than the minimum time constant Tmin of the plant Gp(s), or observing the ratio Ts 0.1Tmin [9], [11]. Under these conditions, the discrete controller approximates the continuous controller performance. The transfer function of the continuous linear section as a stand alone system is:
GP s
21.6 K
1 0.001s 1 0.03s 1 0.042s
2400000 K
(1)
s 3 189 s 2 8667 s 111111
The plant’s minimum time constant is Tmin = 0.001 s. Then the sampling period is chosen as Ts = 0.0001 s which satisfies the condition Ts 0.1Tmin. In the case of the present analysis, the plant’s gain K is considered as a variable parameter, although any of the system parameters may be uncertain. To determine the gain marginal limits, the method of the D-partitioning is applied [3], [11]. If the linear part of the plant Gp(s) is involved in a unity feedback, its characteristic equation of the system is:
Fig. 3. Marginal Step Response at K = 0.625
The marginal step response at K = 0.625 is achieved in the discrete-time domain by applying the code:
G s s 3 189s 2 8667 s 111111 2400000 K 0 (2)
>> Gp=tf([0 1500000],[1 189 8667 111111]) >> Hd = c2d(Gp1,0.0001,'zoh') >> Hdfb = feedback(Hd1,1) >> step(Hd1fb)
From Eq. (2), the variable parameter K is determined as: s 3 189 s 2 8667 s 111111 K s 2400000
II.2. (3)
Interaction between the Nonlinear and the Linear Section of the System
The nonlinear section of the plant is an ON-OFF element with hysteresis. Its transfer characteristic and its properties are shown in Fig. 4.
The D-partitioning in terms of K, as seen from Fig. 2, is achieved from Eq. (3) by applying the code: Copyright © 2013 Praise Worthy Prize S.r.l. - All rights reserved
International Review of Automatic Control, Vol. 6, N. 6
721
Kamen M. Yanev
TABLE I N(M) AND Z(M) = 1/N(M) AT DIFFERENT INPUT AMPLITUDES M (CASE OF ON-OFF NONLINEARITY WITH HYSTERESIS; K1 = 1 AND H = 0.4) M 0.4 0.8 1.6 2.4 N(M) 3.18–90 1.59–30 0.8–30 0.53–10 Z(M) –0.31+90 –0.63+30 –1.25+14 –1.9+10 TABLE II FREQUENCY AND AMPLITUDE OF OSCILLATIONS OF THE STABLE LIMIT CYCLES AT DIFFERENT GAIN VALUES (CASE OF ON-OFF ELEMENT WITH HYSTERESIS) Linear System Gain K 0.1 0.3 0.5 Limit Cycles M 0.62 1.45 1.95 Properties 51 79 85 , rad/s
Fig. 4. Characteristic and Properties of the ON-OFF Nonlinearity with Hysteresis
The describing function of the ON-OFF nonlinearity with hysteresis is presented as follows [4], [12]: N M
4K1
M
h sin 1 M
Although under these conditions the system still remains stable, the different properties of the limit cycles affect its performance.
(4)
The results from the D-partitioning analysis demonstrate that if K 0.625 the linear section of the system GP(s) is stable. Under this condition, GP(j) at different gains (K = 0.1, 0.3, 0.5) and Z (M) = 1/ N(M) are plotted in the complex plane as shown in Fig. 5.
III. Continuous Robust Controller Design The objective is that the robust control system should become a system with two enforced dominant poles satisfying specific performance criteria. The following design steps are considered [13]: Step 1: The closed-loop transfer function of the linear section of the plant as a stand alone system is determined as:
GCL s
2400000 K 3
2
(5)
s 189s 8667 s 111111 2400000 K
Step 2: The optimal value of the gain K corresponding to the relative damping ratio ζ=0.707 of the closed-loop system GCL(s), is determined by an interactive procedure with the plot of the ζ =f (K). The optimal gain K of the continuous linear plant at a relative damping ratio ζ = 0.707 can be determined by implementing the code: >> K=[0:0.0001:0.11]; >> for n=1:length(K) G_array(:,:,n)=tf([2400000*K(n)],[1 189 8667 111111+2400000*K(n)]); End >> [y,z]=damp(G_array); >> plot(K,z(1,:))
Fig. 5. Goldfarb Stability Criterion at Different Linear Section Gains K = 0.1, 0.3, and 0.5
According to the Goldfarb stability criterion, the control system is stable for any one of the cases, since as seen from the Fig. 5, each loci GP1(j), GP2(j) or GP3(j) is not enclosing the point (-1, j0) of the complex plane and also is not enclosing this part of the characteristic Z(M), corresponding to the increment of M after a crossing point (,), related to a limit cycle [5], [12]. It is assumed in this part of the analysis that the parameters of the nonlinearity (K1 = 1 and h = 0.4) are constant or change insignificantly. The function Z(M) is plotted by applying Eq. (4). The results for different amplitudes M are shown in Table I. Due to the sensitivity to the variation of the linear section gain K, the limit cycles are with different amplitude M and frequency of oscillation.
As seen from Fig. 6, if the relative damping ration is tuned to ζ = 0.7069 0.707 the gain becomes K = 0.0343. Step 3: By substituting K = 0.0343 in Eq. (5) the transfer function of the closed-loop system is modified to: 82320 (6) GCL s 3 2 s 189 s 8667 s 193431 This condition corresponds to the relative damping of ζ = 0.707 and to the desired closed-loop poles 26.7 j26.7 that are determined by the code:
Copyright © 2013 Praise Worthy Prize S.r.l. - All rights reserved
International Review of Automatic Control, Vol. 6, N. 6
722
Kamen M. Yanev
Step 8: The transfer function of the total robust system is:
GT s GF s GCL s
21.6 K
0.000009 s 0.0017 s 2 0.078s 1 (11) 0.0148K s 2 54 s 1458 3
IV.
D-Partitioning and Discrete-Time Analysis of the Robust System
Based on the characteristic equation of the total system, the variable parameter K is determined as:
Fig. 6. Determination of the Optimal Gain K >> GCL =tf([82225],[1 189 8667 193336]) >> damp(GCL) Eigenvalue Damping Freq. (rad/s) -2.67e+001 + 2.67e+001i 7.07e-001 3.78e+001 -2.67e+001 - 2.67e+001i 7.07e-001 3.78e+001 -1.36e+002 1.00e+000 1.36e+002
K s
0.000009 s 3 0.0017 s 2 0.078s 1 0.0148s 2 0.7992 s 21.6
The D-partitioning curve after the compensation is plotted, as shown in Fig. 7.
(12a) robust
Step 4: Following the design strategy, the two controller zeros can be placed at 27 j27. Then, the transfer function of the series controller is:
GS s
s 27 j 27 s 27 j 27
1458 2 s 54 s 1458 1458
(7)
Step 5: The series robust controller GS(s) and the continuous linear section of the plant GP(s) are connected in series: GOLSP s GS s GP s
Fig. 7. D-partitioning after Compensation
0.0148 K s 2 54 s 1458
0.000009s
3
(8)
The D-partitioning determines two regions of the Kplane: D(0) and D(1). As seen from Fig. 7, D(0) is the region of stability, being on the left-hand side of the curve for a frequency variation within the range –31416 rad/sec +31416 rad/s. The system is stable for any positive values of the gain, K > 0, being in the region D(0). The compensated system is examined for robustness in the discrete-time domain when K = 0.5 and K = 5. Applying the following code to Eq. (11), the discretetime transient responses are achieved as follows:
2
0.0017 s 0.078s 1
Step 6: Further, GOLSP(s) is involved in a unity feedback and the closed-loop transfer function is determined as: GCL s
0.0148 K s 2 54 s 1458
3
2
0.000009s 0.0017 s 0.078s 1 0.0148 K s 2 54 s 1458
(9)
>> GT1=tf([0 10.8],[0.000009 0.0091 0.4776 11.8]) >> GT2=tf([0 108],[0.000009 0.0757 4.01 109]) >> Hd1 = c2d(GT1,0.0001,'zoh') >> Hd2 = c2d(GT2,0.0001,'zoh') >> step(Hd1,Hd2)
Step 7: Since the closed-loop zeros are in the vicinity of some of the closed loop poles of equation (9), a forward controller GF(s) is added to the closed-loop system GCL:
GF s
1458 2
s 54 s 1458
As seen from Fig. 8, due to the effect of the applied robust controller, the compensated system becomes optimal and quite insensitive to variation of the gain K. It is also observed that larger gains K can be employed without affecting the system’s performance.
(10)
Copyright © 2013 Praise Worthy Prize S.r.l. - All rights reserved
International Review of Automatic Control, Vol. 6, N. 6
723
Kamen M. Yanev
V.2.
Describing Function Analysis after Robust Compensation (Nonlinear Variable Parameters)
The properties of the limit cycles differ insignificantly, regardless of the variation of the hysteresis factor h or the saturation factor K1 within specific limits, as seen from Fig. 10 and Fig. 11.
Fig. 8. Discrete-Time Transient Responses of the Robust System
V. V.1.
Describing Function Analysis of the Robust Control System Describing Function Analysis after Robust Compensation (Linear Variable Gain)
Fig. 10. Describing Function Analysis of the Robust System (Case of Variable Hysteresis Factor h)
By applying the Goldpharb stability criterion, the system performance can be assessed after the introduction of the robust controller. The function Z(M) is plotted at Fig. 9 with the aid of the data shown in Table I. The stable limit cycles properties, corresponding to the intercept points between Z(M) and the compensated GT1(j), GT2(j), GT3(j), are presented in Table III.
Fig. 11. Describing Function Analysis of the Robust System (Case of Variable Saturation Factor K1)
VI.
Digital filters based on microcontrollers [5], [14], [15] that are corresponding to the two robust control stages, are designed and applied in the system. The series robust stage can be modified by adding two insignificant poles, to allow its implementation:
Fig. 9. Describing Function Analysis of the Robust System TABLE III PROPERTIES OF THE STABLE LIMIT CYCLES AT DIFFERENT VALUES OF THE GAIN Linear Section Gain K 0.5 2 0.57 0.58 Limit Cycles Properties 56 58 , rad/s
Digital Robust Controller Based on Microcontrollers
GS s
5 0.59 60
s 2 54 s 1458 1458 s 1000 2
(12b)
Further, the series robust control stage can be presented in the discrete-time domain by the following code:
As seen that the properties of the limit cycles differ insignificantly, regardless of the variation of the gain K. This outcome demonstrates the achieved robustness of the system after the application of the robust controller.
>> Gs=tf([1 54 1458],[1458 2916000 1458000000]) Transfer function:
Copyright © 2013 Praise Worthy Prize S.r.l. - All rights reserved
International Review of Automatic Control, Vol. 6, N. 6
724
Kamen M. Yanev
s^2 + 54 s + 1458 ---------------------------------1458 s^2 + 2.916e006 s + 1.458e009 >> Ds = c2d(Gs,0.0001,'zoh') Transfer function: 0.0006859 z^2 - 0.001365 z + 0.0006793 -------------------------------------z^2 - 1.81 z + 0.8187 Sampling time: 0.0001
The forward robust control stage can be presented in the discrete-time domain by the following code: >> Gf=tf([145.8 1458],[1 54 1458]) >> Df = c2d(Gf,0.0001,'zoh') Transfer function: 0.01455 z - 0.01453 ---------------------z^2 - 1.995 z + 0.9946 Sampling time: 0.0001
From the code, the transfer function of the series digital robust stage is presented in the discrete-time domain as follows:
Ds z
0.0006859 z 2 0.001365 z 0.0006793 2
z 1.81 z 0.8187
Considering the outcome of the applied code the transfer function of the forward robust control stage, presented in the discrete-time domain, is as follows: DF z
(13)
Y z
0.01455 z 0.01453 z 2 1.995 z 0.9946
M z E z
(17)
Eq. (17) can be further expressed as:
X z M z 0.01455 E z z 1 0.01453E z z 2
Eq. (13) can be also presented as:
1.995 M z z 1 0.9946 M z z 2
Y z 0.0006859 X z 0.001365 z 1 X z 2
1
0.0006793 z X z 1.81 z Y z
Based on Eq. (18), to facilitate the implementation of a forward microcontroller, the transfer function of the forward digital robust control stage DF(z) is expressed by the following difference equation [11], [16]:
(14)
0.8187 z 2Y z
m ( kT ) 0 .01455 e( k 1)T
To implement a microcontroller, the series digital robust control stage DS(z), based on equation (14), is represented by the following difference equation [11], [16]:
0 .01453 e( k 2 )T
The control system with the incorporated two-stage digital robust controller is presented in the block diagram shown in Fig. 12. Each combination of a sampler, a digital filter DF(z) or DS(z), solving a specific difference equation, plus a zeroorder hold (ZOH), can be represented by a microcontroller that is incorporating an ADC, CPU and DAC [11], [16], as revealed in Fig. 13. It is seen that the forward and the series robust stages are merged into the control system. They can be accordingly programmed to solve the set of difference Eqs. (15) and (19).
(15)
0.8187 y k 2 T The forward robust stage can be modified by adding a zero, to improve the speed of system response:
GF s
145.8s 1458 s 2 54 s 1458
(19)
1 .995 m ( k 1)T 0 .9946 m ( k 2 )T
y kT 0.0006859 x kT 0.001365 x k 1 T 0.0006793x k 2 T 1.81y k 1 T
(18)
(16)
Fig. 12. Two-Stage Digital Robust Controller Incorporated into the Control System
Copyright © 2013 Praise Worthy Prize S.r.l. - All rights reserved
International Review of Automatic Control, Vol. 6, N. 6
725
Kamen M. Yanev
Fig. 13. Two-Stage Robust Microcontroller Incorporated into the Control System
VII.
The microcontroller robust design strategy is the preferable option that can be applied to any control system due to the advantages related to digital systems.
Conclusion
Contribution of this research is the advancement of the D-partitioning method in its application for analysis and design of a digital robust control for a nonlinear control system with a low degree of nonlinearity. Following the Euler's approximation, the results of the research demonstrate that the D-partitioning analysis can be applied independently to the continuous plant of the system if the sampling period is at least 10 times smaller than the plant’s minimum time constant. The outcome from the D-partitioning by considering only the region of stability of the linear part of the system is an important precondition for further discussion on the describing function analysis. The system is assessed in terms of the interaction between the linear and the nonlinear sections with the aid of the Goldfarb stability criterion, based on the describing-function analysis. The outcome proves that after implementation of the digital robust controller, the properties of the limit cycles differ insignificantly regardless of the variation of the gain of the linear section. A major advantage of the describing-function analysis is the graphical display and the simplicity of its application for systems with complex dynamics in their linear parts. Even though the type of the nonlinear stage used in this research is an ON-OFF element with hysteresis, analysis and robust design of systems with any other low degree nonlinearities types produce similar results. For nonlinear control systems, an optimal robust controller is achieved by applying forward-series compensation with two degrees of freedom [17], [18], consisting of a series stage engaged in a unity feedback and a forward stage. The controller enforces the desired system performance. Analysis in the discrete-time domain before and after the application of the robust controller proves that the system becomes quite insensitive to its parameter variations. To achieve digital robust control, the transfer functions of the two controller stages are presented by their difference equations. Microcontrollers are incorporated into the control system as forward and series robust control stages and can be programmed [19], [20], [21] to solve the difference equations related to their performance.
References [1] [2] [3]
[4] [5]
[6]
[7]
[8]
[9] [10] [11] [12] [13]
[14]
[15]
[16] [17] [18]
Copyright © 2013 Praise Worthy Prize S.r.l. - All rights reserved
Neimark, Y., Robust stability and D-partition, Automation and Remote Control Vol. 53(Issue 7), pp. 957–965, 1992. Neimark Y., D-partition and Robust Stability, Computational Mathematics and Modeling, Vol. 9(Issue 2), pp. 160-166, 2006. Yanev K.M., Application of the Method of the D-Partitioning for Stability of Control Systems with Variable Parameters, Botswana Journal of Technology, Vol. 15(Issue 1): 26-33, 2005. Ogata K., Modern Control Engineering, London, Prentice-Hall International, Inc., pp. 662-675, 2000. Yanev K.M., Anderson G.O., Masupe S., Strategy for Analysis and Design of a Digital Robust Controller for Nonlinear Control Systems, 4th IASTED International Conference on Modeling and Simulation, Gaborone, Botswana, ISBN 978-0-88986-929-5, p. 213-220. 2012 K. M. Yanev, G. O. Anderson, S. Masupe, Multivariable System’s Parameters Interaction and Robust Control Design, (2011) International Review of Automatic Control (IREACO), 4 (2), pp. 180-190. Yanev K.M., Anderson G., Masupe S., Strategy for Analysis and Design of Digital Robust Control Systems, ICGST-ACSE Journal, Volume 12, Issue 1, pp. 37-44, 2012. Yanev K.M, Anderson G.O., Masupe S., Stability and Robustness of a Control System for Precise Speed Control, International Journal of Energy Systems, Computers and Control, Volume 2, No. 1, ISSN: 0976-6782 pp. 11–24, 2011. Cannon M., Term H., Discrete Systems, Oxford University Press, pp. 11–26, 2012. Bemporad A., Automatic Control 2, University of Trento Press, pp. 1-31, 2011. Phillips C. L., Digital Control System, Prentice-Hall International Inc., pp.125-403, 2000. Gunchev L.A., Control Systems Engineering, Technika, pp.165169, 2001. Yanev K.M., Analysis of Systems with Variable Parameters and Robust Control Design, 6th IASTED International Conference on Modeling, Simulation and Optimization, pp. 75-83, 2006. Yanev K.M., Stability of Control Systems with two Variable Parameters, Proceedings of the Second IASTED International Conference on Modeling and Simulation, ISBN 978-0-88986763-5, pp.106-111, 2008. M. H. Moulahi, F. Ben Hmida, M. Gossa, Robust Fault Detection for Stochastic Linear Systems in Presence the Unknown Disturbance: Using Adaptive Thresholds, (2010) International Review of Automatic Control (IREACO), 3. (1), pp. 11-23. Bhanot S., Process Control Principles and Applications, Oxford University Press, pp. 170-187, 2010. Dorf R.C., Modern Control Systems, New York, USA, AddisonWesley, pp.578-583, 2006. Kuo B.C., Automatic Control Systems, New York, USA, McGraw-Hill, pp.521-530, 2002.
International Review of Automatic Control, Vol. 6, N. 6
726
Kamen M. Yanev
[19] Behera l., Kar I., Intelligent Systems and Control Principles and Applications, Oxford University Press ,ISBN 0-19-806315-6 pp. 1-38, 2011. [20] Babu B.V., Process Plant Simulation, Oxford University Press ISBN 0-19-566805-7 pp. 295-307, 2011. [21] Bates M., Interfacing PIC Microcontrollers Embedded Design by Interactive Simulation, Newness Imprint of Elsevier, UK, ISBN 0-7506-8028-8, pp. 177-274, 2011.
Authors’ information Prof. Kamen Yanev started his academic career in 1974, following a number of academic promotions and being involved in considerable research, service and teaching at different Commonwealth Universities around the world. His major research is in the field of Control Engineering as well as in the subject of Electronics and Instrumentation. He has more than 92 publications in international journals and conference proceedings in the area of Control Engineering, Electronics and Instrumentation. Most of his latest publications and current research interests are in the field of Analysis of Control Systems with Variable Parameters and Robust Control Design. Prof. Yanev is a member of the Institution of Electrical and Electronic Engineering (IEEE), a member of the Academic Community of International Congress for Global Science and Technology (ICGST), a member of the editorial board of the International Journal of Energy Systems, Computers and Control (IJESCC) at International Science Press, a reviewer for ACTA Press (A Scientific and Technical Publishing Company) and a member of the Botswana Institute of Engineers (BIE).
Copyright © 2013 Praise Worthy Prize S.r.l. - All rights reserved
International Review of Automatic Control, Vol. 6, N. 6
727
International Review of Automatic Control (I.RE.A.CO.), Vol. 6, N. 6 ISSN 1974-6059 November 2013
Analysis of an Improved Single Input Fuzzy Logic Controller Designed for Depth Control Using Microbox 2000/2000c Interfacing Aras M. S. M., S. S. Abdullah, Aziz M. A. A., A. F. N. A. Rahman Abstract – This paper describes an analysis of an improved designed of Single Input Fuzzy Logic Controller (SIFLC) for depth control using Microbox 2000/2000C interfacing. The analysis based on the model of an unmanned underwater platform that called Remotely Operated Vehicle (ROV). This ROV modeling obtained using a MATLAB system identification toolbox on open loop depth control experiment by Underwater Technology Research Group (UTeRG). Microbox 2000/2000C is an XPC target machine device used to interface between an ROV with the MATLAB 2009 software. An improved design for SIFLC based on two parameters that is a distance, d, and its control surface for SIFLC using the linear equation technique will be discussed. Newly technique called An improved Single Input Fuzzy Logic Controller (an improved SIFLC) design for underwater Remotely Operated Vehicle (ROV) also described and will be implemented to simplify the complexity of the system in real time. The optimum parameter for SIFLC tuned using optimization technique. The implementation phase will be verified through MATLAB SIMULINK platform and real time experiment. Copyright © 2013 Praise Worthy Prize S.r.l. - All rights reserved.
Keywords: An Improved Single Input Fuzzy Logic Controller, Microbox 2000/2000c, Depth Control, An improved Single input Fuzzy Logic Controller
DSRV is one of unmanned underwater vehicles that totally autonomous controlled and have the same function with an Autonomous Underwater Vehicle (AUV). The input to SIFLC is a distance, d, and its control surface can be conveniently represented as a linear or piecewise linear interpolation. First of all, an analysis is carried out to ensure that the linear approximation will not dispossess SIFLC from the nonlinear properties of CFLC. Effects of tuning parameter conditions such as membership functions arrangement for generating a linear control surface are studied in [12]. Once the appropriate conditions are obtained, a generalized output equation is derived. It can be shown by the output equation that the linear or piecewise linear control surface can be obtained by changing the peak locations of the membership functions. The main advantages of SIFLC are a simpler method where only a single input variable to be derived and the number of tuning parameters are totally reduced. Consequently, the complexity of computational also been reduced. The specification of the prototype of ROV designed can refer to [13]- [16]. This ROV platform was developed by the Underwater Technology Research Group (UTeRG) from Faculty of Electrical Engineering, University of Technical Malaysia Melaka (UTeM). Based on these results, the modelling of ROV obtained using a MATLAB system identification toolbox to design and focus on controller system can be explained in [13]. As explained detail in [16] the aim of
Nomenclature d w Ze
u uo
Distance between the diagonal lines Heave speed [m/s] Error signal of Depth Main diagonal line slope Change of actual control output Control output from look-up table Control surface Slope of Linear equation Intersect in Y-axis
I.
Introduction
Single Input Fuzzy Logic Controller (SIFLC) was first introduced by Choi et al. [1]. The authors implement SILFC via computer simulations using two nonlinear plants that is the inverted pendulum and the magnetismlevitation system. The authors also prove the SIFLC to be absolutely stable using Popov criterion. In this study the explanation of an improved SIFLC will be covered and also can refer to [2]-[8]. The explanation from a Conventional Fuzzy Logic Controller (CFLC) simplified into SIFLC but difference system to be controlled. Based on [2] – [5] the application of SIFLC is different from each other such as applied in manipulator robot and boost converter. Only [9] – [11] reported using SIFLC in unmanned underwater robot called it as Deep Submergence Rescue Vehicle (DSRV).
Manuscript received and revised October 2013, accepted November 2013
728
Copyright © 2013 Praise Worthy Prize S.r.l. - All rights reserved
Aras M. S. M., S. S. Abdullah, Aziz M. A. A., A. F. N. A. Rahman
this project is for depth control, where overshoot in the system response is particularly dangerous. Obviously an overshoot in the ROV vertical trajectory (depth motion) may probably cause damage to both the ROV and the inspected structures. The motivation of this research is to improve system performance in term of overshoot, rise time and settling time in system response. By sharing the same control objectives where the objective is to design a controller that can guarantee the limitations of overshoot in the system response. This paper is organized as follows. In section 1, the short brief for introduction to SIFLC are described where the background of SIFLC and current studies. The advantages also discussed in this section. Next, section 2 will be described an improved Single Input Fuzzy Logic Controller (SIFLC) in term of the signed distance method and look-up table. Also covered in this section is the modelling of ROV using system identification toolbox. While section 3 will describe the field testing results and comparisons with other simulation. Finally, the final remarks are elucidated in Section 4.
II.
In SIFLC, the signed distance method will be represented as parameter gain K1 and K2 and FLC will be represented in look-up table as shown Fig. 2. Fig. 3 shows an improved SIFLC for ROV system. Block diagram inside an improved SIFLC as shown in Fig. 2. Based on derivation from [17] so we can compute the Look-up Table using Eq. (5):
d
TABLE I THE REDUCED RULE TABLE USING THE SIGNED DISTANCE METHOD d
s 3 4.911s 2 8.309 s 76.09
(6)
Table I shows that reduced rule table using a Signed distance method wherein [9] the rules table will be 7 data but improved on rule table to 5 data. Slope of zero diagonal line is equal to “1”, as both membership functions for input in Table II are same. By using equation (5), five input values for corresponding seven diagonal lines in Table II are calculated below. The derived SISO table is given in Table II and Table III.
The stability of SIFLC will be analyzed where SIFLC operates as the general nonlinear controller. The relationship between input and output of the SIFLC is nonlinear. The ROV system can be written as equation (1) [16]: 0.4871s 2 1.37 s 67.31
(5)
1 2
̇ (k) = ̇ ( ) ∙
An Improved Single Input Fuzzy Logic Controller
TF
w Ze
uo
LNL
LNS
LZ
LPS
LPL
NL
NS
Z
PS
PL
(1) Fig. 1. SIFLC structural
and also the ROV system can be written as continuous time-invariant as in Eqs. (2) and (3). By using MATLB command transfer function equation can change to state-space model as written in Eq. (4): ̇( ) =
( )+
( )
(2)
( )=
( )+
( )
(3)
Fig. 2. SIFLC in block diagram
5.835 9.826 0.6262 x t 285.8 159.3 588.9 x t 286.8 87.12 326 3.621 105.8 u t 38.18 y t 5.358 0.1272 0.02792 x t
Fig. 3. Simulink for SIFLC for ROV system TABLE II THE REDUCED SISO RULE TABLE
(4) d
u o
Fig. 1 shows the SIFLC structure where signed distance method and FLC. Copyright © 2013 Praise Worthy Prize S.r.l. - All rights reserved
LNL
LNS
LZ
LPS
LPL
-0.7
-0.353
0
0.353
0.7
NL
NS
PS
PL
-0.99
-0.5
Z 0
0.5
0.99
International Review of Automatic Control, Vol. 6, N. 6
729
Aras M. S. M., S. S. Abdullah, Aziz M. A. A., A. F. N. A. Rahman
TABLE III LOOK- UP TABLE PARAMETER Row
d
uo
1 2 3 4 5 6 7
-0.707 -0.707 -0.353 0 0.353 0.707 0.707
-1 -0.99 -0.5 0 0.5 0.99 1
Fig. 5. Single Input FLC is applied to control the ROV
Simulink for an improved SIFLC and ROV system as shown in Fig. 3. The output of SIFLC used Eq. (6). As shown in Table III is look- up table and plotted as shown in Fig. 4. Based on look-up table, linear equation represented as decision making of FLC. This improved SIFLC will laminate or totally reduced the overshoot in system response. The ROV system as stated in Eq. (4). From [18] several factors of tuning variable parameter for Single Input Fuzzy Logic Controller (SIFLC) to improve the performances of system response for depth control of the underwater Remotely Operated Vehicle (ROV) as shown in Fig. 5. This study and investigates will focus on the number of rules in SIFLC, lookup table, slope of a linear equation, and also model reference to give optimum performances of depth control without overshoot in system response and faster rise time and settling time. The variable parameter for SIFLC is tuned by Particle Swarm Optimization (PSO) algorithm. The optimum parameter will be obtained and more or less no more variable parameter can be tuned because the PSO algorithm will yield optimum parameter. So the investigation focused on the number of rules will be reduced, SIFLC parameter reduced, represented lookup table as a linear control surface method to represent the inference engine of FLC. Figure 6 shows the Simulink of SIFLC is applied to control the ROV using Microbox 2000/2000c. The analogue output is motor thruster for the both sides for vertical motion where the analogue input comes from pressure sensor will gives a feedback for the controller to follow the set point.
Fig. 6. Single Input FLC is applied to control the ROV using Microbox 2000/2000c
This Simulink will be interfaced with hardware to test the functionality but with limited space for testing the Real ROV that was developed by UTeRG, the virtual simulation is one solution of this problem to imitate a real testing as shown in Fig. 7 where the sensor represented as input ramp and the motor thruster represented as an ROV model as used before in Fig. 5.
Fig. 7. Simulation of an improved SIFLC
II.1.
Input Ramp
Based on Eq. (8), the pressure may also be represented as ramp input. Instead of using dummy pressure, the other alternative to give ramp input based on the relationship between pressures versus water depth is as shown in Fig. 8 [19]. In [19] the details about dummy pressure are discussed. Ramp input parameters will be set based on Equation (7) as shown in Fig. 9. The slope of the ramp input in Figure 9 is 0.1901 almost same with the relationship between pressure and water depth. In [19] are discussed the comparison between ramp input and the data sheet. The converter will be used to convert from voltage to water depth based on the data sheet of the pressure sensor.
Fig. 4. Plotted graph using Look-Up Table for a control surface
Fig. 8. Input Ramp
Copyright © 2013 Praise Worthy Prize S.r.l. - All rights reserved
International Review of Automatic Control, Vol. 6, N. 6
730
Aras M. S. M., S. S. Abdullah, Aziz M. A. A., A. F. N. A. Rahman
The control objective is to develop a controller that can guarantee the suppression or at least the limitations overshoot in the system response as explained before this. Figs. 13 (a) and (b) shows the system response of Single Input Fuzzy Logic Controller for depth control using Microbox 2000/2000c with 5 meter and 1 meter set point respectively. The results for the both simulation almost give the same response where no overshoot occurred. The reason is the both ROV modeling and the controller is same. Fig. 14 and Fig. 15 show the system response for experiment of SIFLC for 0.5 m and 1 m respectively. The experiment was done with the depth is set to 0.5 meter and 1 meter. The small overshoot occurred of this system response is in term of different power supply to each thruster and IMU sensor in this research is ignored to simplify this experiment. The percentage overshoot can be calculated based on Eq. (10). The overshoot for real time experiment for depth control is about ± 2 % as shown in Eq. (11). The IMU sensor will act as stability for ROV platform:
Fig. 9. Ramp parameters set‐up
Based on the data sheet it can be summarized that the output of the pressure sensor is: =
+
= 0.1901 − 0.0973 =
+ 0.0973 0.1901
(7)
−
=
× 100
(10)
(9) ℎ
II.2.
(%) =
ℎ
(8)
ROV Model
(%) =
0.51 − 0.5 × 100 = ±2% 0.5
(11)
Other design should be considered for virtual simulation is an ROV model as shown in Fig. 10. This ROV model will be represented as motor thrusters that move to vertical motion as set. The ROV is modelled as explain before and stayed in Eq. (4). Block diagram based on Eq. (4) as shown in Fig. 11.
Fig. 10. MATLAB block diagram of ROV
Fig. 12. System response of an improved SIFLC
Fig. 11. ROV block diagram based on Eq. (4)
Figures 16 (a) and (b) show the comparison between simulation and real time of an improved SIFLC for depth control of the ROV for different set point. Of course the simulation results are much better than real time even if the simulation is based on modeling of ROV using system identification (based on experimental of open loop system of ROV). The results for the both simulation almost give the same response where no overshoot occurred between the simulation of an improved Single Input Fuzzy Logic Controller and the simulation of Single Input Fuzzy Logic Controller for depth control using Microbox 2000/2000c.
III. Result Fig. 12 shows the simulation of an improved Single Input Fuzzy Logic Controller for depth control. The depth is set at 5 meters. No overshoot occurred in this simulation that will be priority for control design. Copyright © 2013 Praise Worthy Prize S.r.l. - All rights reserved
International Review of Automatic Control, Vol. 6, N. 6
731
Aras M. S. M., S. S. Abdullah, Aziz M. A. A., A. F. N. A. Rahman
(b) 1 meter set point
(a) 5 meter set point
Figs. 13. System response of SIFLC using Microbox 2000/2000c
Fig. 14. Experiment for Depth Control for Set point 0.5 m
Fig. 15. Experiment for Depth Control for Set point 1 m
(a)
(b) Figs. 16. Comparison between Simulation and real time of SIFLC
IV.
using Microbox 2000/2000c. The virtual simulation is one solution to imitate a real testing where the sensor feedback represented as input ramp and the motor thruster represented as an ROV model. The experiment result are small overshoot occurred of this system response (about ± 2% overshoot) where the reason is in term of different power supply to each thruster and IMU sensor in this research is ignored to simplify this experiment. The next research, ROV simulator will be developed to test a control system using Microbox without having an outdoor experiment. This simulator will be functioning to imitate the underwater environment with noise or disturbance can be controlled.
Conclusion
This paper an analysis of an improved designed of Single Input Fuzzy Logic Controller (SIFLC) for Depth Control using Microbox 2000/2000c are successfully designed. An improved design for SIFLC based on two parameters for SIFLC using the linear equation method. An improved Single Input Fuzzy Logic Controller (SIFLC) is designed for underwater Remotely Operated Vehicle (ROV). Microbox 2000/2000C is an XPC target machine device to interface between an ROV with the MATLAB 2009 software. By using Microbox, the computer programming can be avoided can make the interface easier. The results for the both simulation almost give the same response where no overshoot occurred between the simulation of an improved Single Input Fuzzy Logic Controller and the simulation of Single Input Fuzzy Logic Controller for depth control
Acknowledgements Special appreciation and gratitude to the University (Universiti Teknikal Malaysia Melaka, UTeM and
Copyright © 2013 Praise Worthy Prize S.r.l. - All rights reserved
International Review of Automatic Control, Vol. 6, N. 6
732
Aras M. S. M., S. S. Abdullah, Aziz M. A. A., A. F. N. A. Rahman
[16] Aras, M.S.M, S.S. Abdullah, Rashid, M.Z.A, Rahman, A. Ab, Aziz, M.A.A, Development and Modeling of underwater Remotely Operated Vehicle using System Identification for depth control, Journal of Theoretical and Applied Information Technology (In-press), Vol. 56, 2013. [17] Aras, M.S.M, S.S. Abdullah, Rashid, M.Z.A, Rahman, A. Ab, Aziz, M.A.A, Robust Control of An improved Single Input Fuzzy Logic Controller for Unmanned Underwater Vehicle, Journal of Theoretical and Applied Information Technology (In-press), Vol. 57, 2013. [18] Aras, M.S.M, S.S. Abdullah, Rashid, M.Z.A, Rahman, A. Ab, Aziz, M.A.A, Tuning Process of Single Input Fuzzy Logic Controller Based On Linear Control Surface Approximation Method for Depth Control of Underwater Remotely Operated Vehicle, Journal of Engineering and Applied Sciences, 2013 [19] Mohd Aras, Mohd Shahrieel, Shahrum Shah Abdullah, Siti Saodah Shafei, Investigation and Evaluation of Low Cost Depth Sensor System Using Pressure Sensor for Unmanned Underwater Vehicle, Majlesi Journal of Electrical Engineering, Volume 6, Issue 2, 2012.
Universiti Teknologi Malaysia, UTM) especially to the both Faculties of Electrical Engineering for providing the financial as well as moral support to complete this project successfully.
References [1]
[2]
[3]
[4]
[5]
[6]
[7]
[8]
[9]
[10]
[11]
[12]
[13]
[14]
[15]
Choi, B. J., Kwak, S. W., and Kim, B. K. Design and Stability Analysis of Single-Input Fuzzy Logic Controller. IEEE Transaction on Systems, Man and Cybernetics-Part B: Cybernetics. 2000. 30(2): 303-309. Taeed, Fazel; Salam, Zainal; Ayob, Shahrin M., FPGA Implementation of a Single-Input Fuzzy Logic Controller for Boost Converter With the Absence of an External Analog-toDigital Converter, IEEE Transactions On Industrial Electronics, Volume: 59 Issue: 2, pp: 1208-1217 , 2012. Amer, Ahmed F.; Sallam, Elsayed A.; Elawady, Wael M.Quasi sliding mode-based single input fuzzy self-tuning decoupled fuzzy PI control for robot manipulators with uncertainty, International Journal Of Robust And Nonlinear Control, Volume: 22 Issue: 18 pp: 2026-2054 , 2012. Lee, Shih-Chih; Shih, Ching-Long Optimal single input PID-type fuzzy logic controller, Journal Of The Chinese Institute Of Engineers, Volume: 35 Issue: 4 , pp: 413-420 , 2012 . Lee, Shih-Chih; Shih, Ching-Long, Enhancement of a single-input fuzzy logic control system using a novel method, Journal Of The Chinese Institute Of Engineers, Volume: 35 Issue: 2 Pages: 151-163 , 2012. Ibrahim, H.E.A., Elnady, M.A., A comparative study of PID, fuzzy, fuzzy-PID, PSO-PID, PSO-fuzzy, and PSO-fuzzy-PID controllers for speed control of DC motor drive, (2013) International Review of Automatic Control (IREACO), 6 (4), pp. 393-403. Laoufi, C., Abbou, A., Sayouti, Y., Akherraz, M., Self tuning fuzzy logic speed controller for performance improvement of an indirect field-oriented control of induction machine, (2013) International Review of Automatic Control (IREACO), 6 (4), pp. 464-471. Sabri, N., Aljunid, S.A., Salim, M.S., Badlishah, R.B., Kamaruddin, R., Abd Malek, M.F., Fuzzy inference system: Short review and design, (2013) International Review of Automatic Control (IREACO), 6 (4), pp. 441-449. Kashif ishaque, S.S. Abdullah, S.M. Ayob, Z. Salam, Single Input Fuzzy Logic Controller for Unmanned Underwater Vehicle. In: Journal Intelligence Robot System, volume 59: pp: 87 -100, 2010. K. Ishaque, S.S. Abdullah, S.M. Ayob, Z. Salam. A simplified approach to design fuzzy logic controller for an underwater vehicle, Ocean Engineering, Elsevier Amsterdam, the Netherlands.; pp 1 –14, 2010. Kashif Ishaque, Intelligent Control of Diving System of an Underwater Vehicle. Master Thesis. Universiti Teknologi Malaysia, 2009. Mohd Shahrieel Mohd Aras, Fadilah binti Abdul Azis,Syed Mohamad Shazali b Syed Abdul Hamid, Fara Ashikin binti Ali, Shahrum Shah b Abdullah, Study of the Effect in the Output Membership Function When Tuning a Fuzzy Logic Controller, 2011 IEEE International Conference on Control System,Computing and Engineering (ICCSCE 2011). F.A.Azis, M.S.M. Aras, S.S. Abdullah, Rashid, M.Z.A, M.N. Othman, Problem Identification for Underwater Remotely Operated Vehicle (ROV): A Case Study, Procedia Engineering; Volume 41, pp: 554-560, 2012. Mohd Shahrieel Mohd Aras, Shahrum Shah Abdullah, Azhan Ab Rahman, Muhammad Azhar Abd Aziz, Thruster Modelling for Underwater Vehicle Using System Identification Method, International Journal of Advanced Robotic Systems, Vol. 10, issues 252, pp 1 – 12, 2013. M. S. M. Aras, F.A.Azis, M.N.Othman, S.S.Abdullah. A Low Cost 4 DOF Remotely Operated Underwater Vehicle Integrated With IMU and Pressure Sensor. In: 4th International Conference on Underwater System Technology: Theory and Applications 2012 (USYS'12), 2012 Malaysia, pp 18-23.
Authors’ information Mohd Shahrieel b Mohd Aras is a lecturer at Faculty of Electrical Engineering, Universiti Teknikal Malaysia Melaka UTeM. He currently pursues his PhD in Control and Automation, Faculty of Electrical Engineering, Universiti Teknology Malaysia. His current research is focusing on control system design of underwater technology. His primary interests related to underwater robotics and Artificial Intelligence. Dr. Shahrum Shah b Abdullah is a senior lecturer at Faculty of Electrical Engineering, Universiti Teknologi Malaysia.14 Years of experience in this university .He got Ph.D in Artificial Neural Networks, Department of Electrical and Electronic Engineering, Faculty of Engineering, Imperial College of Science, Technology and Medicine, University of London. Thesis: Experiment Design for Deterministic Model Reduction and Neural Network Training. Currently he is Deputy Dean, Malaysia – Japan International Institute of Technology (MJIIT). website http://ac.utm.my/web / shahrum Muhammad Azhar Abd Aziz received the B. Eng. In Mechatronic from Universiti Teknikal Malaysia Melaka. He currently pursues his Masters in Electrical Engineering in Malaysia – Japan International Institute of Technology (MJIIT), Universiti Teknologi Malaysia. His primary interests related to control system and underwater robotics. Ahmad Fadzli Nizam Abdul Rahman was born in Perak, Malaysia. He received his MSc in Information Technology in 2004 from Universiti Teknologi MARA, Shah Alam and his Bachelor of Applied Science (Computer modelling) from Universiti Sains Malaysia, Pulau Pinang. His research interests including modelling and simulation, estimation, AI, control and estimation techniques.
Copyright © 2013 Praise Worthy Prize S.r.l. - All rights reserved
International Review of Automatic Control, Vol. 6, N. 6
733
International Review of Automatic Control (I.RE.A.CO.), Vol. 6, N. 6 ISSN 1974-6059 November 2013
Design of Hybrid PWM Algorithm for the Reduction of Common Mode Voltage in Direct Torque Controlled Induction Motor Drives V. Anantha Lakshmi, V. C. Veera Reddy, M. Surya Kalavathi Abstract – This paper presents a novel hybrid pulse width modulation (HPWM) technique for the reduction of common mode voltage (CMV) in direct torque controlled induction motor drives based on the concept of imaginary switching times. In the proposed approach, different active zero state PWM (AZPWM) sequences are considered in which the actual switching times are calculated based on the instantaneous values of phase voltages. Moreover AZPWM sequences utilize active voltage vectors for composing the reference voltage vector instead of using zero voltage vectors. But these sequences suffer from steady state ripples. To reduce the ripples in steady state, a HPWM technique is developed in which stator flux ripple analysis is done for all the AZPWM sequences in terms of actual switching times, dc link voltage (Vdc), sampling time period (Ts). To validate the proposed PWM algorithm, numerical simulation studies have been carried out using MATLAB-Simulink and results are presented and compared. Copyright © 2013 Praise Worthy Prize S.r.l. - All rights reserved.
Keywords: Direct Torque Control, Induction Motor Drives, Hybrid PWM, PWM Inverter
Many studies for reducing the CMV have been progressed. These studies however focused on the design of common mode choke, active noise canceller, 4-phase inverter and various types of active filters [1]-[4]. Since these methods require additional hardware and has drawbacks of increase in inverter weight and volume which are unavoidable. To get instantaneous electromagnetic torque-control of AC drives used for high performance a simple and fast response technique known as DTC was developed which achieves bang-bang torque and flux control by directly modifying the stator voltage in accordance with the torque and flux errors. It controls both electromagnetic torque and flux of the machine simultaneously by the selection of optimum inverter switching states. It is simple, robust to parameter variation and gives fast dynamic response compared to FOC [5]-[6]. Though DTC is efficient, it generates high level CMV variations [7]. To reduce steady state ripple and to get constant switching frequency operation, several PWM techniques have been developed. PWM techniques can be classified as Continuous PWM (CPWM) and Discontinuous PWM (DPWM). One of such CPWM technique is conventional space vector PWM technique (SVPWM). In this approach, actual switching times can be produced by the recombination of effective voltage vectors using the information of the reference voltage vector s location. The reference voltage space vector (Vref) or sample is obtained by substituting the various sampled voltage vectors at each time interval, Ts, referred to as sub cycle
Nomenclature Lm, Lr, Ls Te P λs λr Ts T1, T2 Tz M Vno Vdc
Self and mutual inductances, ohms Electromagnetic torque, N m Number of poles Stator flux linkage space vector, V s Rotor flux linkage space vector, V s Sampling time period, s Active vector switching times, s Zero vector switching time, s Modulation index Common mode voltage, V DC link voltage, V
I.
Introduction
Of all the modern power electronics converters, the voltage source inverter (VSI) is the simplest and most widely used device with power ratings ranging from fractions of kilowatt to megawatt level. It converts fixed DC voltage to AC voltage with controllable frequency and magnitude. With the advent of fast switching semiconductor devices like IGBT, has brought high frequency switching operations to power electronic equipments thereby improving the dynamic performance of PWM inverter fed ac motor drives. Moreover, this rapid development has created several unexpected problems such as conducted EMI, shaft voltages, bearing currents and breakdown of motor insulation. The direct cause of above mentioned problems presented is CMV which is generated in the inverter itself.
Manuscript received and revised October 2013, accepted November 2013
734
Copyright © 2013 Praise Worthy Prize S.r.l. - All rights reserved
V. Anantha Lakshmi, V. C. Veera Reddy, M. Surya Kalavathi
in the average sense. This technique reduces the steady state ripples, but it generates high level CMV variations due to the presence of zero voltage vectors [8]-[9] and suffers from draw backs like computational burden and increase in memory size. DPWM method such as DPWM1 popularly known to reduce switching losses of inverter also suffers from high CMV variations due to presence of zero voltage vectors [10]. Hence to reduce the complexity involved in calculation of sector and angle determination, space vector approach using the concept of imaginary switching times is proposed in [11]. Various PWM methods for the reduction of CMV have been developed for inverter control. Though these methods reduce CMV, the performance characteristics of these methods are not well understood when compared with standard methods [12]-[14]. Performance characteristics of Active Zero State PWM (AZPWM) and Remote State PWM (RSPWM) methods for reduced CMV are considered with standard PWM methods employing open loop v/f control algorithm. Though these methods reduce CMV variations, they still require angle information for calculation of switching times and also steady state ripples in torque, current and flux are high for these methods [15]. So, these methods increase the complexity of PWM algorithm. To avoid the complexity involved in calculation of sector and angle determination in this paper different AZPWM sequences are considered using the concept of imaginary switching times. In these AZPWM sequences actual switching times are calculated based on the instantaneous phase voltages. So, it does not require sector identification and angle information. Moreover for the reduction of CMV, AZPWM sequences utilize active voltage vectors for composing the reference voltage vector instead of using zero voltage vectors, So that the CMV changes from +Vdc/6 or -Vdc/6 due to application of active voltage vectors. Though AZPWM methods reduce the computational burden involved in calculations, suffer from steady state ripples in torque, flux and current [18]. The main objective of this paper is to present an imaginary switching times based HPWM algorithm for reduced current ripple and CMV in DTC induction motor drives. In the proposed HPWM technique, stator flux ripple analysis is done for all the AZPWM sequences in terms of actual switching times, dc link voltage (Vdc), sampling time period (Ts). As AZPWM2, AZPWM3 exhibit same ripple characteristics only AZPWM3 is considered in this paper. Then by comparing AZPWM1, AZPWM3, AZPWM4 sequences with respect to each other sequences at various modulation indices the sequence with minimum flux ripple is obtained. This sequence is then fed to DTC based induction motor drive. As all the sectors are symmetric, the mean square flux ripple characteristics for a period of 600 are plotted.
II.
Conventional SVPWM
The goal of SVPWM is to approximate the reference voltage vector Vref in a sampling period by time averaging the voltage vectors. Voltage vectors that can be used to generate any sample are the zero voltage vectors and the two active voltage vectors forming the boundary of the sector in which the sample lies. Suppose assume that sample lies in first sector, Vref at α angle can be generated by using two zero voltage vectors V0 and V7 in combination with two adjacent active voltage vectors V1 and V2 for time durations T1, T2 and Tz respectively within the sampling time period Ts. Construction of reference voltage vector is shown in Fig. 1, from which the actual switching times can be deduced as: T1
Sin 60 3 M Ts Sin 60
(1)
3 Sin M Ts Sin 60o
(2)
T2
where M is the modulation index and given by Vref . To keep the switching frequency constant, M 2 Vdc the remainder of the time is spent on the zero states, that is: Tz Ts T1 T2 (3) In SVPWM strategy, the total zero voltage vector time is equally distributed between the two zero voltage vectors. V3 (-1,1,-1)
V2 (1,1,-1)
2 T2
3
1 Vref V1 (1,-1,-1)
V4 (-1,1,1)
v0, v7T1
q 6
4 5
V5 (-1,-1,1)
V6 (1,-1,1)
d Fig. 1. Construction of reference voltage vector
The voltage vector V7 is applied at the end of sampling time whereas, the voltage vector V0 is applied at the beginning of the sampling time in sector I. Due to the presence of zero voltage vectors common mode voltage variations of conventional SVPWM is very high and also the complexity involved in calculation of angle and sector division is also high.
Copyright © 2013 Praise Worthy Prize S.r.l. - All rights reserved
International Review of Automatic Control, Vol. 6, N. 6
735
V. Anantha Lakshmi, V. C. Veera Reddy, M. Surya Kalavathi
periods proportional to the instantaneous values of the reference phase voltages and can be defined as:
III. Proposed PWM III.1. Common Mode Voltage
T T T Tas s Vas ; Tbs s Vbs ; Tcs s Vcs (8) Vdc Vdc Vdc
According to a 3- voltage source inverter, the CMV can be expressed as:
Vno
Vao Vbo Vco 3
TABLE I COMMON MODE VOLTAGES FOR DIFFERENT INVERTER SWITCHING STATES States Vao Vbo Vco V0 -Vdc/2 -Vdc/2 -Vdc/2 V1 Vdc/2 -Vdc/2 -Vdc/2 V2 Vdc/2 Vdc/2 -Vdc/2 V3 -Vdc/2 Vdc/2 -Vdc/2 V4 -Vdc/2 Vdc/2 Vdc/2 V5 -Vdc/2 -Vdc/2 Vdc/2 V6 Vdc/2 -Vdc/2 Vdc/2 V7 Vdc/2 Vdc/2 Vdc/2
(4)
where Vao, Vbo and Vco are the inverter pole voltages. CMV is different from zero, when the drive is fed from an inverter employing PWM technique. DC-link voltage (Vdc) and the switching states decide the common mode voltages. Table I indicates common mode voltages for different inverter switching states. From Table I it can be observed that the CMV changes from one switching state of the inverter to the other, if only even or only odd vectors are used there will be no change in Vno, if a transition from an even voltage vector to an odd voltage vector occurs, a Vno variation of Vdc/3 is generated, if a transition from an odd (even) voltage vector to the zero (seventh) voltage vector occurs a Vno of 2Vdc/3 is generated which is a worst case. So, in order to avoid CMV variations of the drive neglect or eliminate the zero vectors.
Thus in sector-I a-phase has maximum value, c-phase has minimum value b-phase is neither maximum nor minimum. so, in general maximum and minimum values of imaginary switching times can be calculated in every sampling time as: Tmax= Max (Tas, Tbs, Tcs) Tmin= Max (Tas, Tbs, Tcs)
The SVPWM involves the estimation of angle and sector information for the calculation of active vector switching times T1 and T2 which increases the complexity of algorithm. To reduce the computational burden involved in conventional SVPWM, different AZPWM sequences are proposed which uses the concept of imaginary switching times for the calculation of active vector switching times. The transformation from 2- to 3- voltages can be obtained by using d-q transformation theory as given in (5):
0
3 2 3 2
Vqs V ds
where TX ∊ Tas ,Tbs ,Tcs and is neither a maximum nor a minimum imaginary switching time. The zero voltage vector time is calculated as: Tz=Ts- T1- T2
III.3.
T2 Tbs Tcs
(7)
Proposed AZPWM Sequences
In the proposed approach, different AZPWM sequences are considered in which the actual times are calculated using imaginary switching times concept, hence the complexity involved in SVPWM can be eliminated. From Table II in sector-I, consider AZPWM1, AZPWM4 sequence, two active opposite voltage vectors V3 - V6 are used with the two adjacent voltage vectors V1- V2 to compose the reference voltage vector. Similarly in case of AZPWM2 sequence, two active opposite voltage vectors V1-V4 are used with the two adjacent voltage vectors V1 - V2 to compose the reference voltage vector, for AZPWM3 two active opposite voltage vectors V2 - V5 are used with the two adjacent voltage vectors V1 - V2 to compose the reference voltage vector.
where Vas, Vbs, Vcs are the instantaneous phase voltages. From Fig. 2 it can be observed that Vqs=Vref cos , and Vds=-Vref sin .Suppose if the reference vector lies in first sector as shown in Fig. 1 then actual switching times can be deduced as given in [11]: (6)
(11)
Thus the active vector switching times and zero voltage vector time can be calculated without determining the angle and sector information with the help of imaginary switching times.
(5)
T1 Tas Tbs
(9)
Then active vector switching times T1 and T2 may then be expressed as: T1=Tmax-TX (10) T2=TX-Tmin
III.2. Imaginary Switching Times
1 Vas 1 Vbs 2 Vcs 1 2
Vcom -Vdc/2 -Vdc/6 Vdc/6 -Vdc/6 Vdc/6 -Vdc/6 Vdc/6 Vdc/2
where Tas, Tbs, Tcs are the imaginary switching time Copyright © 2013 Praise Worthy Prize S.r.l. - All rights reserved
International Review of Automatic Control, Vol. 6, N. 6
736
V. Anantha Lakshmi, V. C. Veera Reddy, M. Surya Kalavathi
From the table it can be observed that in sector-I, AZPWM1 method involves 600 jump in the output voltage vectors during commutation from adjacent active voltage vectors (V1, V2) to the active opposite voltage vectors (V3.V6), whereas AZPWM4 method involves 1200 jumps in the output voltage vectors during commutation from adjacent active vectors to the active opposite voltage vectors V3 and V6 acting as zero vectors. With the usage of active voltage vectors CMV changes from +Vdc/6 or -Vdc/6, this indicates that there is a significant reduction in CMV variations using different AZPWM sequences when compared with SVPWM.
TZ T 2 Vdc sin 600 Z 2 3 2 T 2 j Vdc cos 600 Vref Z 3 2 P jQ3
Vrip 3
TZ 2 T Vdc sin 600 Z 2 3 2 2 T j Vdc cos 600 Vref Z 3 2 P jQ6
Vrip 6
(14)
(15)
III.4. Expressions for RMS Flux Ripple The terms given in (12)-(15) contain angle ‘α’, this has to be eliminated to reduce the complexity in calculations. From (1)-(3) the values of sinα, cosα, cos(600- α), cos(600+α), sin(600- α), sin(600+ α) can be obtained as given in (16)-(21):
The rms stator flux ripple is a measure of current ripple in the line current. The time integral of error between the applied voltage vector and the reference voltage vector is defined as the stator flux ripple vector. The instantaneous voltage ripple vectors in the synchronously revolving d-q reference frame corresponding to the active vector 1, active vector 2 and the zero voltage vectors are shown in Fig. 2. The q-axis is in the direction of the reference voltage vector while the d-axis is 90° behind the q-axis. At any instant within a sub cycle, when an active voltage vector is applied, the voltage ripple vector is the vector originating from the tip of the reference voltage vector and ending at the tip of the active voltage vector applied. As the voltage ripple vector remains constant when any given vector is applied, the ripple flux vector changes at a uniform rate. The application of any active voltage vector results in variation of the both the d-axis and q-axis components. The error volt-seconds corresponding to ripple voltage vectors of AZPWM1 sequence are given in (12)-(15):
2 Vrip1T1 Vdc sin T1 3 D jQ1
2 j Vdc cos Vref 3
2 F3216
cos
T1 0.5T2 3M Ts
(17)
T1 2 3M Ts
(18)
T2 0.5T1 3M Ts
(19)
cos 600
T1 T2
T1 T2
sin 600
cos 600
2 3M Ts
2 3M Ts
(13)
T T T 1 T 1 1 1 2 T 0.5 Q32 z Q1 Q2 Q3 1 P 2 z 3P 2 D 2 3PD 1 2 3 Ts 3 Ts 3 Ts 3 Ts
T 1 1 2 Tz Q32 2 0.5 Q1 Q3 q2 3 Ts 3 Ts
(20)
(21)
By substituting these values in (12)-(15) the values of Q1, Q2, Q3, Q6, P and D can be obtained in terms of switching times, without angle which are required for estimation of stator flux ripple. From Fig. 2 the expression for mean square ripple over a sampling interval for AZPWM1 sequence can be obtained as given in (22) using the values of d-axis and q-axis ripple at the switching instants. Similarly, final expressions for mean square ripple for other AZPWM sequences can be derived in the same manner and are given in (23)-(25):
(16)
sin 600
T1 (12)
2 Vrip 2T2 Vdc sin 600 T2 3 2 j Vdc cos 600 Vref T2 3 D jQ2
T2 2 3M Ts
sin
(22)
Copyright © 2013 Praise Worthy Prize S.r.l. - All rights reserved
International Review of Automatic Control, Vol. 6, N. 6
737
V. Anantha Lakshmi, V. C. Veera Reddy, M. Surya Kalavathi
2 F1124
2 F2215
T 1 1 0.5Q72 z .3Q72 Q12 3Q7 Q1 3 Ts 3
2
T1 1 2 Tz S Ts 3 Ts
T T 1 1 2 Tz 3S 2 D 2 3SD 1 2 0.5 Q1 Q7 Q2 3 Ts 3 Ts
T 1 2 3 Q7 Q1 3 Q7 Q1 Q2 Q22 2 3 Ts
(23)
1 1 2 Tz 2 0.5Q22 .3Q22 Q22 3Q22Q2 3 Ts 3
2
T T T2 1 3R 2 D 2 3RD 1 2 Ts 3 Ts
T 1 1 2 Tz 2 0.5 Q22 Q1 Q2 3 Q22 Q2 3 Q22 Q2 Q1 Q12 1 3 Ts 3 Ts
2 F6213
T T T 1 T 1 1 1 2 T 0.5Q62 z Q1 Q2 Q6 1 P 2 z 3P 2 D 2 3PD 1 2 3 Ts 3 Ts 3 Ts 3 Ts
1 2 T2 1 2 Tz Q6 0.5 Q1 Q6 Q2 3 Ts 3 Ts
(25)
(24)
TABLE II SWITCHING SEQUENCES OF PWM ALGORITHMS PWM METHOD AZPWM1 AZPWM2 AZPWM3 AZPWM4
S-I
S-II
S-III
S-IV
S-V
S-VI
3216-6123 1124-4211 2215-5122 6213-3126
1234-4321 5322-2235 6233-3326 4231-1324
5432-2345 3346-6433 4431-1344 2435-5342
3456-6543 1544-4451 2455-5542 6453-3546
1654-561 5562-2655 6653-3566 4651-1564
5612-2165 3166-6613 4611-1164 2615-5162
1 2
6 Q1+Q2-Q3
V3
V2
q-axis
3
VRip3
q-axis ripple
VRip2 VRef
T2
T1
2
1
0.5TZ
-Q3
VRip1
α
0.5TZ
V1 d-axis ripple
VRip6
3
-P
V6
-D-P
6 -P
d-axis AZPWM1 Fig. 2. Variations of stator flux ripple vector over a sampling period and its corresponding d-axis and q-axis components of AZPWM1 sequence
IV.
Hence in this paper a new hybrid PWM technique is proposed for DTC based induction motor drive for reduced current ripple. In the proposed hybrid algorithm, the expressions for RMS ripple obtained from (22)-(25) for AZPWM sequences are compared with respect to each other , the corresponding sequence which gives the minimum mean square ripple than other sequences for a given modulation index is then obtained.
Hybrid PWM
Though these AZPWM methods reduce CMV variations they still suffer from steady state ripples in torque, flux, current. To reduce these ripples, HPWM technique for the reduction of stator flux ripple is proposed in [16]-[17] but still they suffer from high CMV due to usage of zero voltage vectors.
Copyright © 2013 Praise Worthy Prize S.r.l. - All rights reserved
International Review of Automatic Control, Vol. 6, N. 6
738
V. Anantha Lakshmi, V. C. Veera Reddy, M. Surya Kalavathi
(a) M=0.4
(c) M=0.72
(b) M=0.55
(d) M=0.8
(e) M=0.9 Figs. 3. Variations of rms stator flux ripple at various modulation indices
As AZPWM2 and AZPWM3 both exhibiting similar ripple characteristics only AZPWM3 is considered. From Figs. 3(a)-3(e) it can be observed that at lower modulation indices (M=0.4) AZPWM2 exhibits superior performance characteristics over other sequences whereas at M=0.55, M=0.72, M=0.8 AZPWM4 has superior performance and at M=0.9 AZPWM2 exhibits superior performance characteristics over other sequences (near the edges AZPWM4 is better). While comparing the harmonic distortion factor characteristics of various AZPWM methods, equal number of switching’s (Nc) per sub cycle must be considered. Except AZPWM4 all methods have the same Nc. In order to obtain the same Nc in each method, the switching frequency of each method must be divide by 5/3.
V.
Proposed PWM Algorithms Based DTC
The block diagram of proposed PWM algorithms based DTC is shown in Fig. 4. In this method, reference values of d-axis and q-axis stator fluxes are compared with actual values of fluxes which are obtained from adaptive motor model and an error in flux is obtained which when divided by the sampling Time period gives a reference voltage vector used for direct control of torque and flux. The errors are given as follows:
Copyright © 2013 Praise Worthy Prize S.r.l. - All rights reserved
ds ds* ds
(26)
qs qs* qs
(27)
International Review of Automatic Control, Vol. 6, N. 6
739
V. Anantha Lakshmi, V. C. Veera Reddy, M. Surya Kalavathi
Vdc V*ds * Te
PI
e
e
PI
+
Reference Speed
+
sl
+ _
_
Te
r
+
Reference Voltage Vector Calculator
V*qs
* s
Vds, Vqs Calculation
+ s
Motor Speed
P W M
Adaptive Motor Model
3 2 IM
Fig. 4. Block diagram of proposed PWM algorithms based DTC
The reference voltage vectors can be obtained as follows: ds (28) V *ds R si ds Ts
distortions. The simulation results under various conditions such as starting, steady state, step change in load, Locus of stator flux and speed reversal for the proposed hybrid PWM based DTC are given in Fig. 20Fig. 26. From Fig. 8, Fig. 10, Fig. 14, Fig. 17, it can be observed that in the proposed AZPWM methods the ripples in torque, flux, current are more in steady state. In order to reduce ripples in steady state hybrid PWM method is proposed and from Fig. 20, it can be observed that the ripples in torque, flux, current in steady state are very much reduced when compared with AZPWM methods.
and:
V *qs R si qs
qs
(29)
Ts
These d-axis and q-axis reference voltage vectors are then fed to the PWM block. The PWM block first converts these two-phase reference voltages into threephase reference voltages. Then by using above PWM algorithms procedure, the actual gating pulses can be generated by using the instantaneous phase voltages. The generated pulses are then fed to the inverter.
VI.
Simulation Results and Discussion
To validate the proposed PWM algorithms, numerical simulation studies have been carried out by using Matlab /Simulink. For the simulation, the reference flux is taken as 1wb and starting torque is limited to 45 Nm. For the simulation studies, a 3-phase, 400V, 4 kW, 4-pole, 50 Hz, 1470 rpm induction motor has considered. The parameters of the given induction motor are as follows: Rs=1.57ohm, Rr=1.21ohm, Lm= 0.165H, Ls= 0.17H, Lr= 0.17 H and J= 0.089 kg m2. To mitigate the common mode voltage variations different PWM methods are proposed in which only active vectors are used in each sector. The steady results of conventional SVPWM algorithm based DTC are given in Fig. 5 - Fig. 7 along with their common mode voltage variations and total harmonic distortion. The steady results of proposed AZPWM algorithms based DTC are given in Fig. 8 - Fig. 19 along with their common mode voltage variations and total harmonic
Fig. 5. Steady state plots in Conventional SVPWM based DTC algorithm
Copyright © 2013 Praise Worthy Prize S.r.l. - All rights reserved
International Review of Automatic Control, Vol. 6, N. 6
740
V. Anantha Lakshmi, V. C. Veera Reddy, M. Surya Kalavathi
Fig. 6. Total harmonic distortion of stator current in Conventional SVPWM based DTC
Fig. 10. Steady state plots in AZPWM1 based DTC algorithm Fig. 7. Common mode voltage variations in Conventional SV PWM based DTC
Fig. 11. Common mode voltage variations in AZPWM1 based DTC
Fig. 8. Steady state plots in AZPWM1 based DTC algorithm
Fig. 12. Total harmonic distortion of stator current in AZPWM2 based DTC
Fig. 9. Total harmonic distortion of stator current in AZPWM1 based DTC
Fig. 13. Common mode voltage variations in AZPWM2 based DTC
Copyright © 2013 Praise Worthy Prize S.r.l. - All rights reserved
International Review of Automatic Control, Vol. 6, N. 6
741
V. Anantha Lakshmi, V. C. Veera Reddy, M. Surya Kalavathi
Fig. 18. Total harmonic distortion of stator current in AZPWM4 based DTC
Fig. 14. Steady state plots in AZPWM3 based DTC algorithm
Fig. 19. Common mode voltage variations in AZPWM4 based DTC
Fig. 15. Total harmonic distortion of stator current in AZPWM3 based DTC
Fig. 16. Common mode voltage variations in AZPWM3 based DTC
Fig. 20. Steady state plots in HybridPWM based DTC algorithm
Fig. 21. Total harmonic distortion of stator current in HybridPWM based DTC
Fig. 17. Steady state plots in AZPWM4 based DTC algorithm
Copyright © 2013 Praise Worthy Prize S.r.l. - All rights reserved
International Review of Automatic Control, Vol. 6, N. 6
742
V. Anantha Lakshmi, V. C. Veera Reddy, M. Surya Kalavathi
Fig. 22. Common mode voltage variations in HybridPWM based DTC
Fig. 25. Speed Reversal in Hybrid PWM based DTC algorithm
Fig. 23. Starting Transients s in Hybrid PWM based DTC algorithm
Fig. 26. Locus of Stator flux in Hybrid PWM based DTC algorithm
From Fig. 9, Fig. 12, Fig. 15, Fig. 18 and Fig. 21, it can be observed that, the total harmonic distortion of Hybrid PWM method is less when compared with AZPWM methods. From Fig. 11, Fig. 13, Fig. 16, Fig. 19 and Fig. 22, it can be observed that, the common mode voltage changes from +Vdc/6 or -Vdc/6 for all the proposed PWM methods. From the simulation results, it can be observed that the proposed hybrid PWM method reduce the steady state flux, torque, current ripples of direct torque controlled induction motor drive when compared with AZPWM methods.
VII.
Conclusion
To reduce the steady state ripples and CMV variations, simple and novel AZPWM algorithms are proposed to DTC using the concept of imaginary switching times. AZPWM algorithms uses only active voltage vectors in each sector to compose the reference voltage vector. Though these methods reduce the CMV variations but
Fig. 24. Load change in hybrid PWM based DTC algorithm
Copyright © 2013 Praise Worthy Prize S.r.l. - All rights reserved
International Review of Automatic Control, Vol. 6, N. 6
743
V. Anantha Lakshmi, V. C. Veera Reddy, M. Surya Kalavathi
Standard PWM Methods for Three-Phase Voltage-Source Inverters” IEEE Trans. Power Electron., vol. 24, no.1, Jan, 2009, pp. 241-252. [16] G.Narayanan, V. T. Ranganathan“Analytical Evaluation of Harmonic Distortion in PWM AC Drives Using the Notion of Stator Flux Ripple” IEEE Trans on Power Electronics, vol. 20, No. 2, March 2005. [17] G.Narayanan, Di Zhao, H. Krishnamurthy and Rajapandian Ayyanar, “Space vector based hybrid techniques for reduced current ripple” IEEE Trans.Ind. Applic., Vol. 55, No.4, pp.16141626, April 2008. [18] Anantha Lakshmi, V., Bramhananda Reddy, T., Surya Kalavathi, M., Veera Reddy, V.C., Direct torque controlled induction motor drives using space vector based PWM techniques for reduced common mode voltage, (2011) International Review on Modelling and Simulations (IREMOS), 4 (2), pp. 575-584.
suffer from steady state ripples. So, in order to reduce the ripples a new hybrid PWM algorithm proposed to DTC based induction motor drive. In the proposed hybrid PWM algorithm flux ripple analysis of each AZPWM sequence is derived and the flux ripple characteristics of AZPWM sequences are compared for different modulation indices. The proposed PWM algorithm employs the best algorithm, which gives less ripple for a given modulation index. The simulation results show that the total harmonic distortion (THD) with the proposed method is less when compared with AZPWM methods.
References [1]
[2]
[3]
[4]
[5]
[6]
[7]
[8]
[9]
[10]
[11]
[12]
[13]
[14]
[15]
Authors’ information
D. S.Ogasawara, H.Ayano, and H.Akagi, “An active circuit for cancellation of common –mode voltage generated by a PWM inverter,” IEEE Trans. Power Electron., vol. 13, no.5,pp. 835841, Sep. 1998 Alexander L. Julian, Giovanna Oriti, Thomas A. Lipo “ Elimination of Common mode voltage in Three-Phase Sinusoidal Power Converters” IEEE Trans. on Power Electron., vol. 14, no.5, Sep, 1999 Satoshi Ogasawara, Hirofumi Akagi “Suppression of Commonmode Voltage in a PWM Rectifier/Inverter System” IEEE Trans, Ind. Applicat. ,vol. 3, pp. 2015-2021,Sep.-Oct 2001 Yaxiu Sun, Abdolreza Esmaeli , Li Sun, Erliang Kang“Investigation and Suppression of Conducted EMI and Shaft Voltage in Induction Motor Drive System” IEEETrans, on Int. Con. & Aut. , Jun 21-23, 2006 Domenico Casadei, Francesco Profumo, Giovanni Serra, and Angelo Tani, “FOC and DTC: Two Viable Schemes for Induction Motors Torque Control” IEEE Trans. Power Electron., vol. 17, no.5, Sep, 2002, pp. 779-787 Isao Takahashi and Toshihiko Noguchi, “A new quick-response and high-efficiency control strategy of an induction motor,” IEEE Trans.Ind. Applicat., vol. IA-22, no.5, Sep/Oct 1986, pp. 820-827. Marcello Pucci, Gianpaolo Vitale and Giansalvo Cirrincione, “A new direct torque control strategy for the minimization of common-mode emissions” IEEE Trans. Ind. Appl.,vol.4, no.2,Mar/Apr, 2006. Thomas G. Habetler, Francesco Profumo Michele Pastorelli and Leon M. Tolbert , “Direct Torque Control of Induction Machines Using Space Vector Modulation”, IEEE Trans. Ind. Appl., Vol. 28, No.5, pp. 1045-1053, Sep/Oct, 1992. Heinz Willi Van Der Broeck, Hans-Christoph Skudelny, Member, IEEE, and Georg Viktor Stanke “ Analysis and Realization of a Pulsewidth Modulator Based on Voltage Space Vectors “IEEE Trans. Ind. Appl.,vol.24, no.1,Jan/Feb, 1998. Ahmet M.Hava, R.J. Kerkman, Lipo, “Simple analytical and graphical methods for carrier-based PWM-VSI drives,” IEEE Trans. Power Electron., vol. 14, no.1,pp. 49-61, Jan. 1999 Joohn-Sheok Kim and Seung-Ki Sul, “A novel voltage modulation technique of the space vector PWM” in Proc. IPEC, Yokohama, Japan, pp. 742-747, 1995 Mario Cacciato, Alfio Consoli, Giuseppe Scarcella, Antonio Testa “Reduction of Common Mode Currents in PWM Inverter Motor Drives” IEEE Trans. On Ind. Applicats., vol.35, no 2, pp. 469476. March-April 1999. Lee-Hun Kim, Nyon-Kun Hahm, Chung-Yuen Won, Kyung-Hee Han, Young-Real Kim “A New PWM Method for Conducted EMI Reduction in Inverter Fed Motor Drive,” IEEE proc. On APEC 2005, Vol.3, March 2005, pp.1871-1876. Yen-Shin Lai , P.S. Chen, H.K. Lee, J. Chou, “Optimal Common –Mode Voltage Reduction PWM Technique for for Inverter Control with Consideration of the Dead- Time Effects-part II:applications to IM drives with diode front end,” IEEE Trans, on Ind. Applicat. , vol. 40, no 6, pp. 1613-1620. Nov.-Dec.2004. Ahmet M.Hava and Emre Un, “Performance Analysis of Reduced Common-Mode Voltage PWM Methods and Comparison With
V. Anantha Lakshmi received her B.Tech degree fromNagarjuna university, Vijayawada in the year 2002.She received M.Tech degree from DR.M.G.R University, Chennai in the year 2005. She is presently working as Assistant Professor in the Electrical and Electronics Engineering Department at G.Pulla Reddy Engineering college, Kurnool, Andhra Pradesh, India. She is currently pursuing Ph.D at J..N.T.University, Hyderbad. Dr. V. C. Veera Reddy graduated from J.N.T. University,Hyderabad in the year 1979, M.Tech from S.V.University Tirupathi in the year 1981and Ph.D from S.V.University Tirupathi in the year 1999.He is presently professor of the Electrical and Electronics Engineering Department, S.V.University Tirupathi, India.He presented more than 25 research papers in various national and international journals. His research area include Power systems, Power systems and control, Electric drives. Dr. M. Surya Kalavathi obtained her B.Tech degree from S.V. U. in 1988 and M.Tech from S.V.U. in the year 1992. Obtained her doctoral degree from JNTU, Hyderabad and Post Doctoral from CMU, USA. She is presently the Professor (EEE) in JNTUH College of Engineering, Kukatpally, Hyderabad. Published 25 Research Papers and presently guiding 5 Ph.D. Scholars. She has specialised in Power Systems, High Voltage Engineering and Control Systems. Her research interests include Simulation studies on Transients of different power system equipment. She has 18 years of experience.
Copyright © 2013 Praise Worthy Prize S.r.l. - All rights reserved
International Review of Automatic Control, Vol. 6, N. 6
744
International Review of Automatic Control (I.RE.A.CO.), Vol. 6, N. 6 ISSN 1974-6059 November 2013
LMI Design of a Direct Yaw Moment Robust Controller Based on Adaptive Body Slip Angle Observer for Electric Vehicles L. Mostefai1, M. Denai2, Khatir Tabti3, K. Zemalache Meguenni3, M. Tahar3 Abstract – A stabilizing observer based control algorithm for an in-wheel-motored vehicle is proposed, which generates direct yaw moment to compensate for the state deviations. The control scheme is based on a fuzzy rule-based body slip angle (β) observer. In the design strategy of the fuzzy observer, the vehicle dynamics are represented by local models. Initially, local equivalent vehicle models have been built using linear approximations of vehicle dynamics respectively for low and high lateral acceleration operating regimes. The optimal β observer is then designed for each local model using Kalman filter theory. Finally, local observers are combined to form the overall controlled system by using fuzzy rules. These fuzzy rules consequently represent the qualitative relationships among the variables associated with the nonlinear and uncertain nature of vehicle dynamics, such as tire force saturation and the influence of road adherence. An adaptation mechanism has been introduced within the fuzzy design and incorporated to improve the accuracy and performance of the controlled system. The controller can then be robustly synthesized based on Linear Matrix Inequalities and using the deviation states model. The controller-observer pair gives good performances in term of stability and presents convincing advantages regarding the real-time implementation issues. The effectiveness of this design approach has been demonstrated in simulations and using real-time experimental data. Copyright © 2013 Praise Worthy Prize S.r.l. All rights reserved.
Keywords: Slip Angle Estimation, Electric Vehicles, Kalman Filter, Local Models, LMI Design
It has been commonly recognized that electric vehicles (EVs) are inherently more suitable to realize active safety stability control over conventional Internal Combustion engine Vehicles (ICVs), and also they have a bright future regarding to the fact that they can cope with new technologies [1]. In EVs, the motor torque can be measured and controlled quickly and accurately [2][3]; and an improved topology can result by using In-wheel motors which can be installed in each EVs' rear and front tires [4]. Based on these structural merits, vehicle motion can be stabilized by additional yaw moment generated as a result of the difference in tire driving or braking forces between the right and left side of the vehicle, which is known as ‘Direct Yaw-moment Control’ (DYC) [5]. Fig. 1 shows an example of the main concept of the chassis control system utilizing Direct Yaw Control based on the model matching control approach combined with an optimal control method [6], this general scheme is supposed to ensure robustness versus uncertainties in a complex model representing the lateral dynamics which lead to a more stable vehicle chassis maneuvering at a certain level. The limitation of such an approach has to be checked experimentally in very special careful conditions.
Nomenclature β v ay δf f
lf lr
,
r
Yaw angle Car-body sideslip angle Yaw rate Absolute car-body velocity at center of gravity Vehicle lateral acceleration Steering angle of the front wheel Tire slip angle of the front and rear wheels Distance from the vehicle center of gravity to the front axle Distance from the vehicle center of gravity to the rear axle Total mass of the vehicle Yaw inertia of the vehicle
m Iz Fxf , Fxr Longitudinal force of the front and rear tires
Fyf , Fyr Lateral forces of the front and rear tires Cf, Cr Front and rear tire cornering stiffness g Constant of gravity
I.
Introduction
This paper focuses on the design of control strategies to enhance the performance and the safety of electric vehicles in critical driving situations.
Manuscript received and revised October 2013, accepted November 2013
745
Copyright © 2013 Praise Worthy Prize S.r.l. - All rights reserved
L. Mostefai, M. Denai, Khatir Tabti, K. Zemalache Meguenni, M. Tahar
paper to construct a fuzzy model-based control system for estimation and control. Optimal observer is designed for each local model using Kalman filter theory [10]. The proposed system is a combination of local linear observers and controllers with varying switching partition. The overall control scheme is applied to the Electric vehicle “UOT MARCH II”. In reference to Fig. 1, we can clearly distinguish the parts which have developed where: first, the observer already implemented and tested previously in [4] and treated in section 3 , and then the LMI based robust control using local modeling approach and under the existence of uncertainties and disturbances. This can be a start point for a gain-scheduling control strategy according to each local model of the vehicle for better performances. According to the configuration the vehicle using 4 InWheels motors, an optimal driving/braking force distribution system has been developed in former research to be applied with the DYC Control Unit. Results of simulations are presented in section 4.
Fig. 1. General Scheme of lateral stability control applied to an electric vehicle
This system is aimed to maintain the driver’s handling ability at the physical limit of adhesion between the tires and the road by making the vehicle easily controllable even well below that limit. The dynamics of the 2-DOF (Degree Of Freedom) vehicle model can describe the driver’s familiar characteristics under normal driving conditions. The body slip angle ( ) and yaw rate ( ) calculated from the model are taken as the desired behavior of the vehicle. By applying Model Matching Control, the yaw moment optimal decision can be derived from the deviations of the state feedback compensator of and from their desired values. Using LMI design tools [7], the control can guarantee robustness versus uncertainties and varying dynamics affected by the state of the road, and more than that, this approach can lead to a gainscheduled control which is meant to be more appropriate to cope with the local dynamics at each situation. Since sensors for the direct measurement of are very expensive, the construction of an observer for its estimation is quite desirable and recommended. The main complexity from vehicle dynamics comes from the nonlinear aspect of the tire force that exhibit a saturation equivalent to the limits of tire adherence, which makes response change considerably if the vehicle cornering is more severe than usual, not mentionning the fact that a inevitable variation in the speed of the vehicle can lead to a highly nonlinear dynamics. In other words, the model structure or model parameters should vary according to the different operating regimes for a more practical controller design. In addition, the nonlinear nature of vehicle dynamics is further complicated by the influence of other characteristics part of the chasis elements (tires, suspensions and steering system…etc). So, it is hard to determine the physical model parameters theoretically. Therefore, an effective modeling/identification methodology is the key for the design of such systems. To deal with the difficulties associated with nonlinearity modeling, as well as to make good use of the linear observer advantages such as simplicity in the design as well as the practical realtime implementation, the nonlinear vehicle dynamics are represented in terms of Takagi-Sugeno (T-S) local models [8][9]. Local approximation of the nonlinear vehicle model and a dynamical interpolation method is introduced in this
II.
System Modeling and Local Approach
The system modeling approach is based on an inwheel-motored electric vehicle dynamics model (Fig. 2). The main difference with common vehicle dynamics is that the direct yaw moment is an additional input variable, which is caused by individual motor torque acting between each wheel. The vehicle dynamics are described by a 2 degree of freedom model given by the following system of equations:
ma y Fxf sinδ f Fyf cosδ f Fyr I z γ l f Fxf sinδ f l f Fyf cosδ f lr Fyr N
(1)
where a y denotes the vehicle lateral acceleration, is the yaw rate, f is the steering angle of the front wheel, N is the direct yaw moment, m represents the mass of the vehicle, I z is the yaw inertia moment, l f denotes the distance between the centre of the mass and the front axle, lr is the distance between the centre of mass and the rear axle, Fxf is the longitudinal force of the front tires, Fyf and Fyr are the lateral forces of the front and rear tires respectively. Let the body slip angle and yaw rate represent the system state variables. By defining the kinematics relationship as a v and
y
assuming that f is relatively small for high speeds, the vehicle’s state equations are obtained as:
1 ˆ β mv Fyf Fyr ˆγ ˆγ 1 l f Fyf lr Fyr N Iz
Copyright © 2013 Praise Worthy Prize S.r.l. - All rights reserved
(2)
International Review of Automatic Control, Vol. 6, N. 6
746
L. Mostefai, M. Denai, Khatir Tabti, K. Zemalache Meguenni, M. Tahar
III. Side Slip Angle Optimal Estimation with Adaptation Mechanism The first step in the estimation design is concerned with the derivation of the system state equations from the vehicle dynamics and local approximation of nonlinear tire model. After that, a local modeling approach is used to get a hybrid-like vehicle model which is calculated as a weighted sum of the outputs of two local linear models. These modeling techniques are considered more appropriate for on-line control system design. An adaptation mechanism of the fuzzy membership functions has been included to make the model fit for different running conditions and road friction changes, Fig. 3. The membership functions of the weighting factors are chosen to be dependent on the lateral acceleration and the road friction coefficient, the varying parameters that affect directly the model dynamics. Two local linear observers will be considered for the description of the local dynamics of the tire, and they seem to be sufficient to cover the whole domain and give a satisfying results in term of estimation, moreover it inherently leads to a relatively simple design, have been combined into a single overall observer by means of fuzzy rules as a interpolating mechanism [3].
Fig. 2. Vehicle 2 Degree of Freedom Modeling
The model of Eq. (2) is nonlinear due to the tire lateral force dynamics. By using local operating regime approximations, the model can be simplified into an equivalent linear 2DOF model by adopting the equivalent tire cornering stiffness C defined by: C
Fy
(3)
α
where Fy is the tire lateral force and α is the tire slip angle at its operating point. By adopting the value of C given from (3), the nonlinear vehicle dynamic state Eqs. (2) can be transformed into an equivalent linear state space equation for a certain operating point: x Ax Bu
(4)
In which the matrices are defined as follow: State matrix:
-
a A 11 a21
-
Fig. 3. Structure of the proposed observer for estimation with adaptation mechanism
2C f 2Cr 2l C 2l C f f r r 1 2 a12 mV mV 2 2 a22 2l f C f 2lr Cr 2l f C f 2lr Cr Iz I zV
In Fig. 4, Lsa means large tire slip angle, Ssa: small tire slip angle, Lfr: large adhesion coefficient, and Sfr: small adhesion coefficient. We should note that the design of the observer, as well as the controller are performed under a constant velocity assumption. Since the main nonlinearity in the model comes from the tires contacts to the road and their physical complicated aspects, the cornering stiffness of the tires will play an important role in the formulation of the mathematical model used in the estimator design. Therefore, the nonlinear hybrid like formalism of the part describing the tire-road contact will be simplified by a local modelling approach. According to Fig. 3, these coefficients are identified to be large when the tire slip angle assumes small values, which are equivalent to the low lateral acceleration regimes; on the other hand, the stiffness coefficients become small when the tire slip angle increases which leads to a vehicle running at high lateral accelerations. Hence, to describe the vehicle
Input matrix:
b B 11 b21
2C f b12 mV b22 2l f C f Iz
the states of the system: xT
0 1 Iz
, and the inputs
T
u f N , where, C f ~ Cr are the cornering stiffness values of the front and rear tires respectively. The variable V is the longitudinal velocity of the vehicle.
Copyright © 2013 Praise Worthy Prize S.r.l. - All rights reserved
International Review of Automatic Control, Vol. 6, N. 6
747
L. Mostefai, M. Denai, Khatir Tabti, K. Zemalache Meguenni, M. Tahar
dynamics by an equivalent linear 2-DOF model, local models with different C value should be considered, for both low and high lateral accelerations at a constant velocity.
the vehicle generates, so, the desired state variables of and are determined by a 2-DOF linear model with front wheel steering angle as input according to (4) and are expressed as follows: d d b11 A f d b21 d
(5)
In addition, there is a constraint on the parameter given by its adhesion saturation value given by the following inequality:
d
g V
(6)
Note that this constraint is subject to many changes in case of the variation in the vehicle velocity. The state deviations variable between the desired value X d and actual value X is assumed to be as follows: Fig. 4. Local modeling approach applied to the tire lateral force characteristics devided into 4 local dynamics and the membership functions using a y as an adaptation coefficient
IV.
d E X Xd d
According to (4) and (5), the differentiation of the above equation leads to the error dynamics which will include this time the external disturbances and uncertainties, necessary for the robust design:
Side Slip Angle Optimal Estimation with Adaptation Mechanism
The first step in the estimation design is concerned with the derivation of the system state equations from the vehicle dynamics and local approximation of nonlinear tire model. After that, a local modeling approach is used to get a hybrid-like vehicle model which is calculated as a weighted sum of the outputs of two local linear models. These modeling techniques are considered more appropriate for on-line control system design. An adaptation mechanism of the fuzzy membership functions has been included to make the model fit for different running conditions and road friction changes, Fig. 4. The membership functions of the weighting factors are chosen to be dependent on the lateral acceleration and the road friction coefficient, the varying parameters that affect directly the model dynamics. Two local linear observers will be considered for the description of the local dynamics of the tire, and they seem to be sufficient to cover the whole domain and give a satisfying results in term of estimation, moreover it inherently leads to a relatively simple design, have been combined into a single overall observer by means of fuzzy rules as a interpolating mechanism [6].
V.
(7)
w b E X X d A E 12 N b 22 w
(8)
Eq. (8) describes the dynamic relationship between the direct yaw moment and vehicle motion state deviations. It shows that when a vehicle motion deviations appears, exerting a direct yaw moment can reduce them to make the vehicle regain stability. Our objective is to design an optimal state feedback controller to achieve high tracking performance under the assumption of the existence of bounded uncertainties and external disturbances applied to the dynamics of the lateral dynamics. For such requirements to be fulfilled, and given the uncertain nature of the plant already described by 2 local models, LMI control tool represents a suitable approach to deal with these multi-models uncertainties. The control problem can be stated as follow: Design a stabilizing control law that guarantees performance for the system while taking into account all variations in the friction model parameters, observer gains and uncertainties resulting LMI based convex optimization procedure and stated as follows [7]. Find:
LMI-Based Lateral Dynamics Control Design and Results
N * k1 d k2 d
As shown in Fig. 1, the control scheme is applied for DYC system design by using the model matching control method. The reference model is chosen to avoid any dangerous behavior compromising the lateral stability of
-
That minimize T
2
(9)
which is the closed loop H2 norm
of the transfer function T from w to 1 E 2 N * ,
Copyright © 2013 Praise Worthy Prize S.r.l. - All rights reserved
International Review of Automatic Control, Vol. 6, N. 6
748
L. Mostefai, M. Denai, Khatir Tabti, K. Zemalache Meguenni, M. Tahar
2
where 1 , 2 are weighting coefficient of position and input signal respectively, and their choice is known to be related to performances criteria as well as to the control signal that achieves such performances, this is termed the LQG (Linear Quadratic Gaussian) cost problem. - All closed loop poles lie inside the stable region with a maximum damping value decided according to the limits of the uncertainties and disturbances which can affect the existence of a solution. - subject to the dynamics given by (8) for all operating conditions. Once the LMI problem is solved, the state feedback gains can be determined. Therefore, The norm of T 2 can be guaranteed not to exceed
Body slip angle (deg)
1.5
Q T P C' D' K u*
P
0
0 -0.5
Observer1 Observer2 Hybrid observer Real value by sensor
-1.5 20
22
24 26 Time(s)
28
30
Lateral acceleration (m/s2)
4
Bi1 0 I
C' D' Ku* P
0.5
-1
some predefined performance value if there exist two symmetric matrices P and Q such that the general form of the Matrix Inequalities are stated as follow:
A B K P P A B K T 2i u* i 2i u* i T B1i
1
3 2 1 0
ay by hybrid observer ay by acc-meter
-1 20
(10)
22
24 26 time(s)
28
30
Fig. 5. Field test results from UOT MARCH II, and validation of the proposed observer (steering angle=90°, v=40km/h) [6]
Trace Q 2
An extension to this work can be taking into account the variation of the velocity of the vehicle, which will result in the use of more local models in the estimation/control design.
where the LMI elements ensuring a robust local design are chosen to be as follow: Since we are using one model ranging between two bounds i = 1, Ai has already been defined in (4):
-5
2
Impulse responses input -> x1 and x2 states for the proposed robust design
x 10
1 0 -1
( d )
C' 1 0 , D' 2
.( d )
EBETA
-2
b 1 B1i , B2i 12 1 b22
-3 -4 -5 -6
Amplitude
-7 -4 -8 x 10 6
5 4
EGAMMA
3 2 1 0 -1
To evaluate the efficiency of the proposed estimation scheme as well as the robust control design under more realistic conditions, field tests are conducted on our experimental Electric Vehicle “UOT March II”. UOT March II is equipped with an acceleration sensor, a gyro sensor and a noncontact speed meter which provide measurements of the vehicle state variables. The parameter used in simulations can be found in [6]. Fig. 5 depicts the results of field tests of the observer in moderate cornering situations. The experiments demonstrate that the observer gives quite satisfying performances in term of estimation and noise elimination compared to the signal coming from the sensor, adding to that its suitability for real time applications due to its high on-board computational speed, it can make a very adequate solution to the estimation problem in lateral dynamics control in vehicles in general. Furthermore, the nonlinear global system results show high estimation capabilities and good adaptation in case of a changing road adhesion.
-2
0
0.5
1
1.5
Time (sec)
Time (s) Fig. 6. Test of robustness and error states convergence
Fig. 6 shows the results of the test of robustness of the proposed controller. Considering the uncertainty and the disturbances in the vehicle dynamics, we can say that the proposed controller is able to achieve quite good performances translated by the fact that the real vehicle will behave as the reference model vehicle without losing the ideal trajectory when cornering. Theoretically, it is verified, but still a considerable work to merge the controller into the vehicle architecture and use the gain-scheduling version which will give naturally better performances.
VI.
Conclusion
This paper presented an algorithmic solution to the
Copyright © 2013 Praise Worthy Prize S.r.l. - All rights reserved
International Review of Automatic Control, Vol. 6, N. 6
749
L. Mostefai, M. Denai, Khatir Tabti, K. Zemalache Meguenni, M. Tahar
nonlinear vehicle dynamic control problem which has been validated both in a simulation environment and realtime. A state observer has been designed for an in-wheelmotored electric vehicle with Direct Yaw-moment Control (DYC) using local modeling techniques. Local models were used for approximating the complex vehicle dynamics by mean of simpler linear local models. An adaptation mechanism was introduced to adjust the switching functions in response to cope with changes in road friction conditions. The local observers design was based on Kalman filter theory and was combined with an interpolating fuzzy mechanism which provided the link between the underlying local dynamics. We have shown that the LMI based designed controller rely critically on the estimated value of , and can give a very satisfying results in term of robustness and state tracking. A special effort will be devoted into the implementation of a full dynamic stability control of the UOT MARCH II for eventual experimental tests. A gain-scheduled version of the proposed controller can be adopted to ensure better dynamical performances of the vehicle in local domains and for different extreme situations.
Authors’ information 1
Laboratoire Genie Electrotechnique, Univ. Tahar Moulay Saida, Saida, Algeria. 2
Teesside University, Middlesbrough, UK. 3
School
Of
Sciences
and
Engineering,
Univ. Of Sciences and Technology Mohamed Boudiaf, Oran, Algeria.
L. Mostefai received his master degree in Control Engineering in 2002, and a PhD degree in 2010 in Automatic at at Mohamed Boudiaf University of Science and the Technology of Oran (U.S.T.M.B). He has been giving lectures on “Control Engineering”, “Microprocessors and Microcontrollers in Industrial applications” and “Instrumentation in Biomedical Engineering” since 2002 at the University Moulay Tahar in Saida (U.T.M.S.), Algeria. He is currently a member of Genie Electrotechnics Laboratory in U.T.M.S. His interests are mainly on: optimal and robust control, motion control systems, smart materials and their application, automotive engineering and renewable energies. M. Denaï received his Bachelor in Electrical Engineering in 1982 from de university of Algiers (Algeria) and his PhD in Control Engineering from the University of Sheffield (UK) in 1988. He is Professor at the University of Science and the Technology of Oran (USTO). Currently he is on a research leave at the Dept of Automatic Control and Systems Engineering, University of Sheffield (UK). His main field of interest are intelligent control design, intelligent fault detection in power systems, advanced control of power devices, modeling and control of electric power systems, modeling, simulation and control design for efficiency optimisation in the field of renewable energies such as solar, wind, investigation of power electronics interface for renewable energy systems, modeling and control of life science systems, data mining and knowledge discovery for system modeling.
References [1]
Larbi, B., Alimi, W., Chouikh, R., Guizani, A., Geometrical parameters influence on PEM fuel cell performance, (2013) International Review on Modelling and Simulations (IREMOS), 6 (4), pp. 1363-1370. [2] Ibrahim, H.E.A., Elnady, M.A., A comparative study of PID, fuzzy, fuzzy-PID, PSO-PID, PSO-fuzzy, and PSO-fuzzy-PID controllers for speed control of DC motor drive, (2013) International Review of Automatic Control (IREACO), 6 (4), pp. 393-403. [3] Allirani, S., Jagannathan, V., Field programmable gate array based direct torque control of induction motor drive, (2013) International Review of Automatic Control (IREACO), 6 (4), pp. 373-380. [4] Yoichi Hori, “Future Vehicle Driven by Electricity and Control Research on 4 Wheel Motored “UOT March II” ”, in AMC2002 Proc. (7th International Workshop on Advanced Motion Control Proceedings), pp.1-14, 2002. [5] M. Canale, L. Fagiano, A. Ferrara, C. Vecchio, "Vehicle Yaw Control via Second-Order Sliding-Mode Technique," IEEE Trans. on Industrial Electronics, vol. 55, no. 11, pp. 3908-3916, Nov 2008. [6] Cong Geng, Lotfi Mostefai, Mouloud Denai, and Yoichi Hori, “ Direct Yaw-Moment Control of an In-Wheel-Motored Electric Vehicle Based on Body Slip Angle Fuzzy Observer ”. IEEE Trans. on Industrial Electronics, Vol.56, No.5, pp.1411-1419, May 2009. [7] P. Gahinet, A. Nemirovski, A. J. Laub, and M. Chilali, LMI Control Toolobox for Use With Matlab, The Mathworks Inc. 1995. [8] P. T. Takagi and M. Sugeno, ‘‘Fuzzy identification of systems and its applications to modeling and control,’’ IEEE Trans. Syst. Man. Cyber., Vol. 15, pp. 116_132,1985. [9] R. Babuska and H. Verbruggen, “An Overview of Fuzzy Modeling for Control”, Control Engineering Practice, vol. 4, no. 11, pp. 1593 – 1606, 1996. [10] J. Th. Paul, Venhovens, K. Naab, “Vehicle Dynamics Estimation Using Kalman Filters”, Vehicle System Dynamics, Vol.32, pp. 171-184, 1999.
Khatir Tabti was born in Saida (Algeria) in 1975. He obtained a diploma of engineer in Electrotechnics in 1998. He received his master degree in electrical control engineering at University of Sciences and Technology of Oran (Algeria) from 2004 at 2006. He is currently working toward the PhD degree at Mohamed Boudiaf University of Science and Technology of Oran. He works currently in an industrial company in Algeria as Head of Sustainable Development department. He is an associate lecturer at the University Moulay Tahar, Saida. His fields of interest include: Electrical drives control, Traction control system, dynamics control of electric vehicle. Kadda Zemalache Meguenni received the Dipl.-Ing. Degree in Electrical Engineering from University of Sciences and Technology of Oran M-B (USTO), Algeria, in 1998, Master Degree from USTO in 2001 and received the PhD from Evry University, France, in 2006. His research interests include nonlinear control of mechanical systems, robotics, control system analysis and design tools for under-actuated systems with applications to aerospace vehicles. Tahar Mohamed received both his electrotechnics engineer and ME from the Electrotechnical Institute, University of Sciences and Technology, Oran (USTO). He was a head of the Electrotecnic Institute in Oran. He is currently a researcher in nonlinear control in LDEE laboratory at the University of Sciences and Technology of Oran M-B (USTO), Algeria.
Copyright © 2013 Praise Worthy Prize S.r.l. - All rights reserved
International Review of Automatic Control, Vol. 6, N. 6
750
International Review of Automatic Control (I.RE.A.CO.), Vol. 6, N. 6 ISSN 1974-6059 November 2013
Intelligent Control of a Small Climbing Robot A. Jebelli, M. C. E. Yagoub, N. Lotfi, B. S. Dhillon Abstract – In this paper, a fuzzy logic-based control system is proposed, which lays emphasis on the functionality of the system rather than developing a mathematical model. Applied to a climbing robot, it can achieve precise motion control along with power consumption minimization and produce versatile behaviors based effective computational method in behavior-based control paradigm to implement robot behaviors. Experimental results prove the validity of the proposed methods. The proposed fuzzy logic-based control scheme is capable to automatically change the stickiness of hands and feet based on surface slope of unsupervised systems, thus keeping the control of the motion at a predefined stable level. The effectiveness of the proposed approach is demonstrated through experimental results. Copyright © 2013 Praise Worthy Prize S.r.l. - All rights reserved.
Keywords: Climbing Robot, Behavior-Based Control, Fuzzy Logic Controller, PID Control, Pulse Width Modulation
I.
The robot owns seven electrical motors, i.e.: Zed. Shoulder. Elbow. Yaw. Pitch. Roll. Stick. These geared motors keep track of movements through encoder, which relates counts measured by the robot with distance, angular or linear, covered by the joint.
Introduction
It is a challenging task to design robot systems able to achieve precise motion control, minimize power consumption, and produce versatile behaviors. Gravity compensation is essential for accurate control of climbing robot motion. From the robot dynamic model, it could be found that the gravitational effect at each joint depends on the robot configuration, and the place where the robot is staying. So it is very hard to exactly compensate the gravitational effect for each joint. In this paper, a control scheme consisting of a PD controller and a fuzzy compensator was proposed. Experimental results show that the controller with a fuzzy compensator can significantly improve the tracking performance. On the other hand, reducing power consumption is very important for a miniature robot with limited resources. An optimal control law is developed to minimize the energy usage when vacuuming the suction foot. Primitive behaviors were implemented to provide the robot with basic competences with the help of a finite state machine driven by signals from robot sensors representing the status of the robot. The effectiveness of the proposed approach is demonstrated through experimental results.
X2
X1 Z2
Y2 l2 Z1 Xo
Zo
II.
l1
System Description
Y1
In recent years, Fuzzy logic-based control methodology has emerged as very promising tool that allows human description of physical systems and the way the related required control strategy should be simulated. Let us consider a robot with six degrees of freedom, a minimum number for artificial arms able to reach any position in the space (three related to positions and three related to orientation in space).
Yo
Fig. 1. Robot Joints and Links Modeling
Manuscript received and revised October 2013, accepted November 2013
751
Copyright © 2013 Praise Worthy Prize S.r.l. - All rights reserved
A. Jebelli, M. C. E. Yagoub, N. Lotfi, B. S. Dhillon
III. Electronics Parts
0 l2C12 l1C1 C12 0 l2 S12 l1S1 0 1 0 0 0 1 C2 S 2 0 l2 C 2 S C2 0 l2 S2 1 A2 2 0 0 1 0 0 0 1 0 C1 S1 0 C1 S1 0 1 R1 S1 C1 0 , R0 S1 C1 0 0 0 1 0 C2 S 2 0 C2 S 2 2 1 R1 S2 C2 0 , R2 S2 C2 0 0 0 1 0 C12 S12 0 A2 0 0
A. Microprocessor We first designeda control system based on a ATMEGA16L microcontroller to perform all codes and tasks. This Microcontroller uses a JTAG interface for onchip-debug and up to 8 MIPS throughput at 8MHz. Operating frequency with a 3V supply; it integrates PWM outputs for controlling light and a serial RS232 port for communication with other devices. With its small size and weight, the proposed control system is cost-effective, involving minimum number of components. B. Sensors The four legs of the robot are supported by the Smart Robot Feet. Each foot is self-contained, consisting of a suction cup, a vacuum pump motor, a micro valve, a pressure sensor, an Arduino Sharp GP2D12 Infrared IR Range Sensor, and MPR121 Capacitive Touch Sensor. The robot foot uses a diaphragm type vacuum pump as it provides large pumping speeds for small suction volumes. The pump motor (T2-02) with high capacity pumps (air/gas) operates at 12/24 VDC and draws approximately 24.2/28.5 lpm-flow. The pressure sensor monitors the pressure level inside the suction cup to ensure that the foot is firmly attached to the object surface without leakage. The IR sensor is used to detect the existence of objects, and to measure the distance between the sensor and the objects. Also, touch sensors have beeninstalled on the suction cup in radial directions to provide tactile feedback. They are used to adjust the foot orientation. In order to distinguish between different motion modes, a contact switch is installed on each leg to determine whether the leg and rack are locked together. Some exteroceptivesensors (e.g. omni-directional camera, inclinometer, etc.) can be also installed to further monitor the environment.
IV.
0 0 1 0 0 1
with:
C12 C1C2 S1S 2
0
C12 R2 S12 0
S12 C12
S12 S1C2 C1S 2
0 C12 2 0 , R0 S12 0 1
0
S12 C12 0
0 0 1
and: ci= cosθi, si = sinθi cij= cos(θ1 +θ2), sij= sin(θ1 +θ2) TABLE I KINEMATICS PARAMETERS Link i i di ai 1 0 0 l1 1 2 0 0 l2 2
The initial conditions are assumed as (with g the gravitational acceleration):
Newton-Euler Dynamics Algorithm and Robot Dynamic Model
o o vo 0 t
vo g g x
From Fig. 1, we can determine the frame of the origin and subsequently the successive frame after that. Let d be the moving distance and l the length of the link and let α and θ be the twist and rotation angles, respectively. Using Table I, we can obtain the kinematics parameters of the links using the Denavit-Hartenberg convention:
C1 S 0 A1 1 0 0
S12
t
0 0 , zo 0 0 1
A. Forward Iterations Compute the angular velocity: i
R0i i Ri 1
i 1
R0i 1 z0 qi
# for i=1,
S1 0 l1C1 C1 0 l1S1 0 1 0 0 0 1
1
Copyright © 2013 Praise Worthy Prize S.r.l. - All rights reserved
1
R01 R0
0
R00 z0 q0
0 0 1 1
International Review of Automatic Control, Vol. 6, N. 6
752
A. Jebelli, M. C. E. Yagoub, N. Lotfi, B. S. Dhillon
# for i=2,
2
2
R02 2 R1 1R01 z0 q2
0 0 1 2 1
l2 2 2 2 1 2 C2 l11 gC1 S2 l11 gS1 l2 S2 l112 gC1 C2 l11 gS1 2 1 2 0
i
0 i
i
0 i
i 1
* 0 i
i
2
t
0 0 :
R0 F2 m2 2 R0 a2 2 R0 F2
l 2 C l 2 gC 2 1 1 1 2 1 2 S2 l11 gS1 2 l2 1 2 S2 l11 gC1 2 R0 v2 C2 l11 gS1 0
R0 F1 m1 1R0 a1
and: l1 2 2 m11 gm1C1 1 R0 F1 l1 m11 gm1S1 2 0
1
Compute the linear acceleration at the center of mass:
# fori = 1,
R0 Fi mi i R0 ai
# fori = 2,
l2 2 2 2 m2 1 2 m2 C2 l11 gC1 m2 S 2 l11 gS1 l2 2 2 m2 1 2 m2 S2 l11 gC1 m2 C2 l11 gS1 0
l112 gC1 1 R0 v1 l11 gS1 0
# fori = 2,
0 i 1
# for i = 1 and vo g g x
i
i 1
i
B. Backward Iterations: Assuming no load conditions (f3=n3 = 0), compute the force exerted on link 1 and 2.
R R R p R R v
R0 vi i R0 i i R0 p*i i
Compute the linear acceleration: i
R0 a2
R0 ai i R0 i i R0 si i i R0i R0i i R0 si i R0 vi
Assuming no load conditions:
i
R0 fi i Ri 1
i 1
R0 fi 1 i R0 Fi
Compute the force exerted on link 1 and link 2:
# for i=1,
# fori = 2, f3 = 0
l1 2 2 1 gC1 1 R0 a1 l1 gS1 2 1 0
2
R0 f 2 2 R3
3
R0 f3 2 R0 F2 2 R0 F2
l2 2 2 2 m2 1 2 m2C2 l11 gC1 m2 S2 l11 gS1 2 R0 f 2 l2 2 2 m2 1 2 m2 S2 l11 gC1 m2C2 l11 gS1 0
# for i=2,
l2 2 2 R0 s2 0 0
Copyright © 2013 Praise Worthy Prize S.r.l. - All rights reserved
International Review of Automatic Control, Vol. 6, N. 6
753
A. Jebelli, M. C. E. Yagoub, N. Lotfi, B. S. Dhillon
# fori = 1,
i
i
i
i
0 i
0 i
0
0 i
Ri
R R R I
R0 Ni i R0 I i 0 Ri
Compute the moment exerted on link 1 and link 2: i
R0 p*i i 1R0 fi 1
i 1
0 0 1 2 1 2 l2 m21 l2 m22 3 3 1 2 2 l1l2 m2 C21 S21 1 l m gS 2 2 2 12 l2 2 m2 1 2 1 R0 n1 l C m S l 2 gC 2 2 1 1 1 1 2 m C l gS 2 2 1 1 1 2 l 2 2 m2 1 2 l1S2 m2C2 l112 gC1 m S l gS 1 2 2 11 1 1 2 1 2 l m l gm S m l 4 1 1 1 2 1 1 1 12 1 1 1
i R0 p*i i R0 si i R0 Fi i R0 Ni
l2 2 2 m2 1 2 m2C2 l11 gC1 C2 2 m2 S2 l11 gS1 l2 2 2 m2 1 2 m2 S2 l11 gC1 S2 m2C2 l11 gS1 l11 gS1 l1 2 m11 gm1C1 2 l 2 2 m2 1 2 m2 C2 l112 gC1 S2 2 m S l gS 1 2 2 1 1 l2 m S l 2 gC m 2 1 2 2 2 1 1 1 C2 2 m2C2 l11 gS1 l 1 m11 gm1S1 2 0
R0 ni i Ri 1 i 1R0 ni 1
R i
0 i
# fori = 2, Compute the joint torques applied to each of the joint: 2
R
R0 N 2
2
2
0
R0 I 2 0 R2
2
2
2
0
R0 I 2 R2
R0 2
2
R02
0 2 R0 N 2 0 1 m2 l22 1 2 12
i
1
1
1
0 1
1
0 1
0 1
i 1 z0
b q
i i
0
R1
1
R0 n1
T
1
R0 z0 b1q1
R R R I
i
0 i
1 1 1 1 l22 m21 l22 m22 l1l2 m2 C21 S212 3 3 2 1 l2 m2 gS12 2 l2 2 2 m2 1 2 m2 S2 l11 gC1 l1C2 m2 C2 l11 gS1
# fori = 1,
R0 N1 1R0 I1 0 R1
i
Torque 1: # fori = 1 and b1 = 0:
0 2 R0 n2 1 l22 m21 1 l22 m22 1 l1l2 m2 C21 S212 3 2 3 1 2 l2 m2 gS12
1
T
Rn R
l2 2 2 2 m2 1 2 m2 C2 l11 gC1 l1S2 m2 S2 l11 gS1 1 2 1 l1 m11 l1 gm1S1 3 2
R 1
0 1
0 0 1 R0 N1 1 2 m1l1 1 12
Copyright © 2013 Praise Worthy Prize S.r.l. - All rights reserved
International Review of Automatic Control, Vol. 6, N. 6
754
A. Jebelli, M. C. E. Yagoub, N. Lotfi, B. S. Dhillon
Torque 2: # fori = 2and b2 = 0:
2
2
R0 n2
T
2
numerical variables. In a closed loop control system, Let E be the error between the desired balance and the surface slope. According to the above mentioned eleven linguistic labels, the rate of error change (∆E) can be also labeled as Zero (ZR),Negative Large(NB), Negative Medium(NM), Negative Small (NS), Positive Small (PS), Positive Medium (PM),and Positive Large(PB). In practice, measured quantities are real numbers (crisp). The process of converting a numerical variable (real number) into a linguistic label (fuzzy number) is called fuzzification. Figure 3 shows the membership functions used to fuzzify the inputs [7].
R1 z0 b2 q2
1 1 2 l22 m21 l22 m22 3 3 1 1 l1l2 m2 C21 S212 l2 m2 gS12 2 2
V.
Design of the Fuzzy Controller VII.
The fuzzy design process for embedded controller can be detailed into three main steps including fuzzifying the inputs, inferencing the rule based knowledge, and defuzzifying the output (Fig. 2).
Membership Function
To further design the microprocessor fuzzy controller, input/output membership functions as well as fuzzy rules were first setup. Then, labels were determined for the membership functions. The numbers of labels correspond to the number of regions that the universe should cover. A scope must be assigned to each membership function to numerically identify the range of input values that correspond to a label.
Fig. 2. Steps involved for output computation [2]
Forward and backward controllers use the whole range of their universe. Therefore, the maximal values of the error should be equal to the limit of the universe. In this work, the universe is in a range of -45o to +45o. The retained antecedent MFs are triangular and trapezoidal with a specific overlap of 50% to ensure that each value of the universe is a member of at least two sets, except possibly for elements at the extreme ends. The number of the input/output fuzzy sets was set to four with the balance sensor as input and four sticky suctions and four open blowers as outputs. For each of the input/output variables, the following eleven linguistic labels are assigned to the membership functions:
Membership functions when the robot moves on a flat surface
Membership functions when the robot climbs up on a 90°ramp
VNL = Very Negative Large, NB= Negative Large, NM = Negative Medium, NS = Negative Small, VNS = Very Negative Small, ZR = Zero, VPS = Very Positive Small, PS = Positive Small, PM = Positive Medium, PB = Positive Large VPL = Very PositiveLarge, In the premise parts, these variables are fuzzy, while in the consequence part they are singletons with values between 0 and 1 [3]. Thus, the Mamdani fuzzy system approach was chosen [4], by using MFs in the input and singletons in the output control system. Note that for real-time fuzzy control applications, using singletons in the output allows simpler and faster control [5], [6].
VI.
Fig. 3. Membership Functions of the Fuzzy Logic Controller
The shape of the membership function should be representative of the variable. However due to available computing resources related to the 8-bit microcontroller, triangular shapes and singletons are preferred. Therefore, singletons and triangular shapes can be represented by point-slope format. Singletons require one byte and triangular three bytes; two point locations on the variable axis and one slope or grade values.
Fuzzifier
Fuzzy logic uses linguistic variables instead of Copyright © 2013 Praise Worthy Prize S.r.l. - All rights reserved
International Review of Automatic Control, Vol. 6, N. 6
755
A. Jebelli, M. C. E. Yagoub, N. Lotfi, B. S. Dhillon
VIII Construction oof the Rule Base VIII.
X.
In conventio conventional nal controllers, there are control laws, which are combinations of numerical values that govern the controller feedback. feedback In fuzzy logic control, the equivalent term is rules (Table II). Rules are linguistics in nature and allow the operator to develop a control decision in a more familiar human environment [8 [ ]:
PID Control
For feedback control in industrial processes, proportional proportional-integral integral-derivative integral derivative controller (PID (PID) PID) has been used. It is described by [11] [11]. We thus have: 1 u t k e t T i
IF E > 0 Turn On the sticky suction IF E < 0 Turn On the open blower ∆E = |E(K)| - |E(K-1)| |E(K 1)| IF ∆E > 0 Away from the desired balance IF ∆E 0 Max suction
t
0 e d T d
de t dt
X XI. Experiments in Robot Using Balance Sensor and Fuzzy PI Control The steady-state steady state error is one of the main factors to consider in dynamic systems. However, since such systems are unpredict unpredictable able, one of the drawbacks of using simple fuzzy P control is that it takes time to reach a desirable situation. One of the solutions to solve this issue is to use fuzzy PI to reduce steady steady-state state error. For this work, rules were set as follow: f llow: Fuzzy P rules:
TABLE II FUZZY LOGIC RULE TABLE FOR THE TEMPERATURE
IF Error is Low THEN Open pen Blower lower and P-Pwm Pwm is Max. IFError is Low AND Error rate is Zero THEN P P-Pwm is Medium. IF Error is Zero THEN P P-Pwm Pwm is Zero. IF Error is Low AND Error rate is Zero THEN P P-Pwm is Medium. IF Error is high THEN Sticky ticky Suction uction is Max and andP-Pwm is Max. Fuzzy I rules:
After setting the rules, each output membership function will contain a corresponding membership. From these memberships, a numerical (crisp) value must be produced. This pr process ocess is called defuzzification [2], [9].
IF Error rate is Low THEN I-Pwm Pwm is Max. IF Error rate is Low AND Error is Zero THEN II-Pwm is Medium. IF Error rate is Zero THEN II-Pwm Pwm is Zero. IF Error rate is Low AND Error is Zero THEN II-Pwm is Medium. IF Error rate is High THEN II-Pwm Pwm is Max.
IX IX.. Defuzzification Defuzzification plays an important role in a fuzzy logic-based logic based control system. It is the process in which the fuzzy quantities defined over the output membership functions are mapped into a nonnon -fuzzy fuzzy (crisp) number. There are a variety of methods to achie achieve ve this; however this discussion is confined to the process used in this research design. Singleton fuzzy output is chosen due to its quick processing speed [10]: [10]
The values for P and I membership functions are: P: P:Min= Min= -45 45,, Zero = 0, Medium = 20,, High = 45. 45 I: Zero = 00, Low = 15, High = 45.. Fig. 4 shows the related Fuzzy PI surface. The PWM output is based on PI controller equation as Pwm=P+I [12]. The response of tthe he robot with predefined values is depicted in Figure 5..
n
Bn Kn Z
t 1 n
X XII. I. Substitution of the Numerical Design Values
Bn t 1
The simulated values are summarized in Table III ((for for a mass of 1 kg). kg
with ith Bn the weight of the rule which is fired and Kn the singleton output value for that specific rule rule.
Copyright © 2013 Praise Worthy Prize S.r.l. - All rights reserved
International Review of Automatic Control, Vol. 6, N. 6
756
A. Jebelli, M. C. E. Yagoub, N. Lotfi, B. S. Dhillon
Fig. 4. Fuzzy output surface
Joint i
Position Position(o)
1 2
45 --45
TABLE III SIMULATED VALUES Velocity Acceleration (o/s2) (o/s)) 60 70 80 120
Length (mm mm) 100 100
Fig Fig. 6. 6 Output waveforms of the microcontroller
Torque 1
1 2 2 1 0.1 3.3161 1.2217 3 4 2 2 2 2 0.1 1.0472 1 0.12 2.4435 2 4 4 2 2 0.1 9.8062 , 4 2 1 0.3841Nm/rad
When the robot is subject to a dip (about 45°), it is able to change from a critical ccondition ondition to a stable condition. This condition happened because of high value of Pwm value in output membership function for a sudden change in engine speed, as in Fig. 5,, so this part of the fuzzy program has the maximum effect on the response of the robot.
Torque 2
1 1 1 2 l22 m21 l22 m22 l1l2 m2 C21 S212 3 3 2 1 l2 m2 gS12 2 1 2 2 0.1 1 2 0.12 1 12 3 4 1 2 2 0.1 3.3161 0.12 1.2217 1.0472 2 , 3 4 2 0.0115 Nm/rad 11.5 10 3 Nm/rad
Fig atlab Fig. 5. 5 Plotting the output values of simulation using Matlab
As can be seen, the robot is able balance its position relative to the tilt rapidly, at about 68% (250W) Sticky Sticky Suction and engine power, Fig. 6 and T Table able IV show the microcontroller output values using fuzzy logic approach 45 to 45o rotation is approach.. The fuzzy output for -45 equal to 3.3161. 3.3161. Note that the microcontroller integrates many useful capabilities like Pulse-Width Pulse Width Modulation (PWM PWM) outputs PWM) for controlling the pump motor or pressure sensor. sensor. An illustration of this temperature control system is shown in Fig. 6..
Joint i 1 2 1+2
TABLE IV OUTPUT VALUES FROM MICROCONTROLLER (FOR A LENGTH OF 10CM) Position, Velocity, Acceleration, degree rad/s rad/s2 45 1.0472 1.2217 -45 45 1.3963 2.0944 0 2.4435 3.3161
XIII. Conclusion Conclusion The purpose of this work was to fulfill a need for new sensing and control technologies for remote exploration of unknown, unstructured environments using small robots. Thus, simulations simulation and results were carried out to study the implementation of a fuzzy llogic ogic based ogic-based controller for small climbing robot robots. The proposed fuzzy logic logic-based based control scheme is capable to automatically change the stickiness of hands and feet based on surface slope of unsupervised system systems, s, thus keeping keeping the control of the motion at a predefined stable level. The effectiveness of the proposed approach is demonstrated through experimental results. results
Torque 0.384 0.0115
Copyright © 2013 Praise Worthy Prize S.r.l. - All rights reserved
International Review of Automatic Control, Vol. 6, N. 6
757
A. Jebelli, M. C. E. Yagoub, N. Lotfi, B. S. Dhillon
department. From 1999 to 2001, he was a visiting scholar with the Department of Electronics, Carleton University, Ottawa, ON, Canada, working on neural networks applications in microwave areas. In 2001, he joined the School of Information Technology and Engineering (SITE), University of Ottawa, Ottawa, ON, Canada, where he is currently a Professor. His research interests include RF/microwave CAD, RFID design, neural networks for high frequency applications, planar antennas, and applied electromagnetics. He has authored or coauthored over 300 publications in these topics in international journals and referred conferences. He authored Conception de circuits linéaires et non linéaires micro-ondes (Cépadues, Toulouse, France, 2000), and coauthored Computer Manipulation and Stock Price Trend Analysis (Heilongjiang Education Press, Harbin, China, 2005). Dr. Yagoub is an Editorial Board member of the International Journal of RF and Microwave Computer-Aided Engineering, a senior member of the IEEE, and a registered member of the Professional Engineers of Ontario, Canada. E-mail:
[email protected]
References [1] [2] [3]
[4]
[5]
[6] [7]
[8]
[9] [10] [11] [12]
[13] [14]
[15]
[16]
[17]
A. J. P. Heck: Introduction to Maple, 2nd edition, Springer Verlag, 1996. K.S. Fu, R.C. Gonzales and C.S.G. Lee, Robotics: Control, Sensing, Vision and Intelligence, 1987. M. J. GonzA,lez-LApez and T. Recio: The ROMIN inverse geometric model and the dynamic evaluation method, A.M. Cohen, editor, Computer Algebra For Industry: Problem Solving in Practice, pages 117-141. JohnWiley and Sons, 1993. Wall´en, J.On robot modeling using Maple. Technical Report LiTH-ISY-R-2723.Dept.Electr.Eng.,Link¨opingsuniversitet, Sweden, 2006. Brock J. LaMeres, Design and implementation of a fuzzy logic based voltage controller for voltage regulation of a synchronous generator, Montana State University Bozeman, MT 59717. D. Necsulescu, Mechatronics, Prentice Hall, 2000. Jebelli, A., RuzairiAbdul Rahim “Intelligent exhaust fan controller system”, Progress in Process Tomography & Instrumentation System, Chapter 13, University Teknology, Malaysia, 2011. Panda, D.,Ramanarayanan, V.,“Fuzzylogic based control of switched reluctance motor”, Int. Conf. on Signal Processing Applications and Technology, 1998. Jebelli,A., Intelligent Exhaust Fan Controller System, University Technology Malaysia, 2009. Wakami, N., Araki, S., Nomura, H., “Recent applications of fuzzy logic to homeappliances”, Int. Conf.IECON, 1993, pp. 155-160. Lixin Wang, Adaptive Fuzzy System and Control, Guofang Industrial Press, Changsha, China, 1995. Habibi,M., Tehrani, A.,Awouda, E.A., “Microcontroller-based fuzzy logic controller for a small Autonomous Underwater Robot”, Int. Review of Automatic Control, Vol.3, n.1, pp. 60-65, 2009. Ronald C. Arkin, Behavior-Based Robotics, The MIT Press, 1998. Occhipinti, L., Nunnari, G., Synthesis of a greenhouse climate controller using AI-based techniques, 8th Mediterranean Electrotechnical Conf., 1996, pp. 230-233. Caponetto, R., Fortuna, L., Nunnari, G., Occhipinti, L., “A fuzzy approach to greenhouse climate control” Proceedings of the American Control Conference, 1998, vol.3, pp.1866-1870. Jizhong Xiao, “Development of Miniature Climbing Robots --Modeling, Control and Motion Planning”, Ph.D. dissertation, Dept. of Electrical and Computer Engineering, Michigan State University, 2002. Jizhong Xiao, Hans Dulimarta, Ning Xi, R. LalTummala, Motion planning of a bipedal miniature crawling robot in hybrid configuration space”, IEEE/RSJ Int. Conf. on Intelligent Robots and Systems, 2002.
Nafiseh Lotfi received the Bs.c. degree in Psychology from Iran and degree in 2008. She is currently working on several research projects involving behavioral neuroscience. E-mail:
[email protected] Balbir S. Dhillon has served as Chairman/Director/Acting Director of the Mechanical Engineering Department/Engineering Management Program for over 10 years. He is the founder of the probability distribution named Dhillon distribution by statistical researchers in their publications around the world. Dr. Dhillon has published over 369 {i.e., 222(70 single authored + 152 co-authored) journal + 147 conference proceedings} articles and 40 books: Wiley (1981), Van Nostrand (1983), Marcel Dekker (1984), Pergamon (1986), etc. His books are being used in over 100 countries. He is /has been on the editorial boards of 10 international scientific journals. Dr. Dhillon is recipient of many awards/honours including Austin J. Bonis Award (American Society for Quality Control), Merit Award (Society of Reliability Engineers), and Glinski Award (Faculty of Engineering). He is listed in many Who's Who documents and has served as consultant to various organizations. Professor Dhillon has lectured in over 50 countries including keynote addresses at various scientific conferences held in North America, Europe, Asia, and Africa. In March 2004, Dr. Dhillon was a distinguished speaker at the Conf./Workshop on Surgical Errors (sponsored by White House Health and Safety Committee and Pentagon), held at the Capitol Hill(One Constitution Avenue, Washington, D.C.) E-mail:
[email protected]
Authors’ information Ali Jebelli received the Bs.c. degree in Electrical Engineering from Iran and degree in 2004 and the Master degree in Electrical Mechatronic & Automatic Control from University Technology Malaysia in March 2010. He is currently a Ph.D. student at the University of Ottawa, Canada. E-mail:
[email protected] Mustapha C. E. Yagoub received the Dipl.Ing. degree in Electronics and the Magister degree in Telecommunications, both from the École Nationale Polytechnique, Algiers, Algeria, in 1979 and 1987, respectively, and the Ph.D. degree from the Institut National Polytechnique, Toulouse, France, in 1994. After few years working in industry as a design engineer, he joined the Institute of Electronics, Université des Sciences et de la Technologie Houari Boumédiene, Algiers, Algeria, first as an Lecturer during 1983-1991 and then as an Assistant Professor during 1994-1999. From 1996 to 1999, he has been head of the communication
Copyright © 2013 Praise Worthy Prize S.r.l. - All rights reserved
International Review of Automatic Control, Vol. 6, N. 6
758
International Review of Automatic Control (I.RE.A.CO.), Vol. 6, N. 6 ISSN 1974-6059 November 2013
Design and Comparison of a PI and PID Controller for Effective Active and Reactive Power Control in a Grid Connected Two Level VSC Rajiv Singh, Asheesh Kumar Singh Abstract – In this paper a PI and a PID controller is designed for active and reactive power control of a grid connected two level voltage source converter. Active and reactive power control in a grid connected VSC is desired for proper accomplishment of the local grid code requirements. VSCs are normally used for grid connection of renewable energy based power plants like wind and solar plants. Simulink control design tool in Matlab software is used for designing the controllers. The controllers are designed to satisfy design parameters in frequency domain. Controller gains were automatically tuned using the robust tuning algorithms in Matlab. Several controllers were designed similarly near the desired frequency domain parameters and the best design of PI and PID controller was selected and compared. Copyright © 2013 Praise Worthy Prize S.r.l. - All rights reserved.
Keywords: Frequency Domain Design, Pulse Width Modulation, Robust Control, Time Domain Design, Voltage-Source Converter, Variable-Speed Wind Generators
Kd N
Nomenclature Ya, Yb and Yc Yα, Yβ Vtvsc Vtgrid Vdc Vpcc Vabc Vα, Vβ Idc Iabc Iα, Iβ Iαref, Iβref P and Q Pref and Q ref Rig Lig Vfwd Vce Rd Ld Vd Cpid(S) Kp Ki
Three phase variable of balanced three phase system Transformed variables in alpha-beta reference frame Voltage source converter terminal voltage Grid terminal voltage Input d.c voltage to VSC Voltage at point of common coupling Balanced three phase voltage Transformed voltages in alpha-beta reference frame D.c. side current in a VSC Three phase currents Transformed currents in alpha-beta reference frame Reference commands for current control Active and reactive powers Reference active and reactive powers IGBT on state resistance IGBT on state inductance IGBT forward voltage drop Collector to emitter voltage in IGBT Diode resistance in forward bias Diode inductance in forward bias Voltage drop in a diode between anode and cathode during forward bias PID controller transfer function Proportional gain of controller Integral gain of controller
Derivative gain of PID controller Filter coefficient of PID controller
I.
Introduction
Power generation based on renewable energy sources is increasing rapidly around the world. Wind and Solar power plants have become demand of the day for meeting the growing power crunch. The obvious advantage of renewable sources is pollution free power. However, intermittent nature of renewable energy sources causes serious problems in integrating them with conventional sources of energy. In order to increase reliability and quality of power, the renewable energy based power plants are connected with the grid through power electronic controllers [1]-[13]. The power electronic controllers generally used are single stage (d.c. –a.c.) converters in PV generation or two stage (a.c.-d.c.-a.c) converters in wind generation. The purpose of these converters is to provide a reliable connecting link to the wind or solar power plants connected with the grid of constant voltage and frequency. For reliable operation of grid connected wind and solar power plants it is required to control the voltage, frequency, active and reactive power according to the demand and requirements of the local grid code. Hence it is required that the controllers performing the control action must be fast, reliable and robust in achieving the desired objectives. In this paper a comparative analysis and design of PI and a PID controller for grid side active and reactive power control in a two level voltage source converter is
Manuscript received and revised October 2013, accepted November 2013
759
Copyright © 2013 Praise Worthy Prize S.r.l. - All rights reserved
Rajiv Singh, Asheesh Kumar Singh
illustrated. The design is performed by using the Simulink control design tool box in Matlab software. It provides handy GUI tools for interactive and easy design of controllers. The gains of PI and PID controllers are tuned using the robust tuning algorithm in Matlab. The best design amongst a set of PI and PID controller is chosen and compared. Most of the literature available regarding control of power converters lacks the illustrations about control design. Although they have discussed various effective control schemes for power control in a VSC but they have either blinked off or given little importance to the credible design of controllers. Many of them have presented analytical approach of design which is rather tedious and time taking. In [1] modeling and control of converters is discussed but there is no precise idea about the calculation of controller gains. In [2] advance methods of controlling the converters is discussed but there is no insight about controller design. Similarly [3], [4] and [8] also contains control strategies used in voltage source converters but lacks controller design methodology. In [9] however analytical methods of control design have been discussed that are lengthy and tedious. The method used in this work is easier as it involves the use of control system design tool in simulink. The interactive GUIs present in the tool aid in easy and robust design.
II.
mode control and current mode control respectively.
Fig. 1. Grid connected voltage source converter
VSC P-Q Control in α-β Stationary Reference Frame
II.1.
A set of three phase variable in stationary frame of reference can be transformed into another stationary reference frame of two phase variables called α-β frame of reference. The three phase variables to be transformed into α-β frame of reference must be the components of a balanced three phase system represented by Eq. (1) below: (1) + + =0 where Ya, Yb and Yc are the three phase variables. The transformation of three phase variables from abc reference frame to α-β frame of reference is governed by Eq. (2) given below [2]:
System Description
Fig. 1 below represents the system in focus of study. Here a three phase two-level voltage source converter is connected with a three phase constant voltage and frequency source representing the grid. The grid represents a balanced three phase a.c. supply. The power ratings of VSC grid and other parameters are given in appendix. The VSC has d.c. and a.c. sides as shown in the Fig. 1. The d.c. side contains a fixed d.c voltage source and a d.c. link capacitor. The a.c side is connected with the grid through resistances and inductances. These are generally the resistances and inductances of transmission lines and transformers connected in the path between the grid and VSC. The purpose of VSC is to regulate the active and reactive power flow to the grid. It also regulates its terminal voltage magnitude and frequency to match it with the grid voltage and frequency. The purpose here is to study active and reactive power control methods in grid connected inverters and design reliable controllers for fulfilling the control objectives. The point of interconnection between the grid and VSC is called point of common coupling (PCC) [1]. The exchange of power between VSC and grid occurs across PCC. The direction and magnitude of power flow across PCC can be controlled by controlling the magnitude and phase angle of the VSC terminal voltage in reference to the PCC voltage. The power exchange can also be controlled by controlling the phase currents. These methods of control are called voltage
1 =
2⎛ 3⎜
0
⎝
−
1 2 3 2
1 2⎞ 3⎟ − 2⎠ −
(2)
The active and reactive power control of a grid connected VSC can be modeled in α-β (stationary) frame of reference and d-q (rotational) frame of reference. Here the current mode control scheme modeled in α-β (stationary) frame of reference is used and represented in Fig. 2. In the current mode control scheme represented in Fig. 2, the reference control commands Iαref and Iβref are calculated by the reference current generator modeled on the basis of Eq. (3): =
2 +
3(
·(
+
· ) ) (3)
= ·(
Copyright © 2013 Praise Worthy Prize S.r.l. - All rights reserved
2 +
3( −
· ) )
International Review of Automatic Control, Vol. 6, N. 6
760
Rajiv Singh, Asheesh Kumar Singh
For generating the current reference commands, the grid terminal voltage (Vtgrid) is measured and converted into α-β components. For control action the three phase currents at VSC terminals is measured and converted into corresponding α-β components. The measured current signals are compared with the reference current signals and error output is fed into the controllers for generating actuating commands. The controller outputs are again converted into abc reference frame on the basis of equation (4) and given as input to a pulse width modulator for generating the switching commands for the VSC [3]: 1 −1 ⎛ =⎜ 2 −1 ⎝2
0 √3 ⎞ 2 ⎟ −√3 2 ⎠
switches on each leg. The switches in VSC are bidirectional switches that can conduct and interrupt currents in both directions. The bidirectional switch used for creating VSC model used in this work is IGBT connected anti-parallel with a diode as shown in Figure 4 [4]-[5]. The IGBT and diode models are presented in Figures 5(a) and (b) respectively. Here the IGBT is modeled as a switch connected in series with a resistance (Rig), inductance (Lig) and a d.c. voltage source (Vfwd). The operation of switch is controlled by the applied gate signal. If the applied gate voltage is positive and the voltage Vce between emitter and collector is greater than Vfwd, then the IGBT will be in ‘ON’ state. However it will go to ‘OFF’ state when no gate signal is applied. The model also contains a snubber containing a series R-C branch connected in parallel between collector and emitter. The diode connected in antiparallel with the IGBT is modeled as switch connected in series with resistance (Rd), inductance (Ld) and a d.c. voltage source Vd. The diode is controlled by voltage and current between the anode and cathode of the device. So when the diode is forward biased with a positive voltage between anode and cathode, it conducts with a small drop equal to Vd across its terminals. But in reverse bias it turns off and current through diode becomes zero [6]-[7]. The values of Rig, Lig and Vfwd, Rd, Ld and Vd used in this work for simulation purpose are given in Appendix.
(4)
Fig. 2. Current mode α-β control in VSC Fig. 3. Three phase voltage source converter
II.2.
Voltage Source Converter Model
The three phase two level voltage source converter used in this study is modeled as three half bridge converters. Each half bridge converter is for power conversion in individual phases of a three phase a.c. system. Each half bridge leg contains two switches. Hence each leg in a three phase VSC bridge contains two bidirectional switches, thereby making a total of six switches in a three phase VSC as shown in Fig. 3. The input to a three phase VSC operating as inverter is a fixed or varying d.c. voltage and the output is a controlled three phase a.c. voltage. The output can be controlled by controlled switching of the individual
Fig. 4. IGBT-diode bi-directional switch
Copyright © 2013 Praise Worthy Prize S.r.l. - All rights reserved
International Review of Automatic Control, Vol. 6, N. 6
761
Rajiv Singh, Asheesh Kumar Singh
III. Control Design Aspects The objective here is to design reliable controllers for tracking the current reference commands Iαref, Iβref obtained by equation (3) for reference values of active power (Pref) and reactive power (Qref). The controllers to be designed are a PI and a PID controller. The relative performance of these two controllers is to be compared. The design approach adopted here is frequency domain approach. The Simulink control design tool provides interactive GUI tools for control design. Using this tool the gains of controllers can be tuned automatically to obtain robust designs. Here the frequency domain design parameters like phase margin and closed-loop bandwidth of the system were adjusted to tune the controller gains. In time domain phase margin indicates the resonant peak of the system and band width indicates the rise time and settling time for the system to be designed. The numerical values of design parameters are given in the bode plot and step response plot in Figs. 9 and 10 respectively. They are also mentioned in the appendix.
Fig. 5(a). IGBT model
III.1. PID Controller Model
Fig. 5(b). Diode model
II.3.
Both the PID and PI controllers designed here are in parallel form as represented in Figs. 7(a) and (b) respectively. The input to PID controller is multiplied by a proportional gain, differentiated and integrated individually and finally the output is obtained by summing each response components. The integration and derivative components are also multiplied with proportional and integral gains (kp and ki) respectively. The derivative output is multiplied with a filter coefficient (N) and fed back through a filter. The filter coefficient N sets the location of the pole in the derivative filter. Similarly, the PI controller contains only proportional and integral components and lacks the derivative and filter components. The transfer function of a PID and PI controller are given in Eqs. 5(a) and (b):
Pulse Width Modulation
Pulse width modulation is a method of generating modulated pulses for deciding the firing sequence of switches in a VSC. In this method a triangular carrier wave is compared with a reference modulating signal as shown in Fig. 6. If the modulating signal is higher than the carrier signal then a firing pulse is generated to turn ‘ON’ a switch and turn ‘OFF’ the other on the leg of a half bridge. Depending on the amplitude, frequency and phase of the reference signal the pulse width modulator generates pulses for firing the bidirectional switches such that the a.c. voltage generated has same amplitude, frequency and phase as the reference signal. The switching sequence adopted for firing is complementary. So if one switch on a bridge leg is ‘ON’ the other switch must be ‘OFF’ [8]-[9]. Va
( )=
( )=
Sa
+ -
1
+
+
+ 1
(5a)
(5b)
where Kp, Ki , Kd and N are the proportional integral and derivative gains of the controller and N is the derivative filter coefficient.
Sb Vb
+
+ Sc
Vc
+
III.2. Design Approach -
The transfer function of a half bridge VSC used here was obtained by using the parameters of the bidirectional switches and the line parameters [9]. The half bridge transfer function is given in appendix. Controller was designed for single phase system and later on implemented for three phase VSC.
Carrier wave
Fig. 6. Pulse width modulation scheme
Copyright © 2013 Praise Worthy Prize S.r.l. - All rights reserved
International Review of Automatic Control, Vol. 6, N. 6
762
Rajiv Singh, Asheesh Kumar Singh
Fig. 8. Current mode control of a half bridge VSC Step Response 1.4 Rise time=0.000236s
Peak=1.03
1.2
A m p litu d e
1
0.8 Settling time=0.000685s
0.6
Fig. 7(a). Parallel PID controller model
0.4
0.2
0
0
0.5
1
1.5
2
2.5
3
Time (sec)
x 10
-3
Fig. 9. Step response of the closed loop system Open-Loop Bode plot 150
M a g n itu d e ( d B )
100
Fig. 7(b). Parallel PI controller model
The controllers were designed separately for each control loop shown in Fig. 2. The control design problem for each control loop was formulated according to the Fig. 8. Simulink control design tool was used for interactively tuning the controller gains according to the required design criteria. The gains of both PI and PID controller were tuned for approximately same values of bandwidth and phase margins. The time domain parameters corresponding to the required frequency domain criteria were also obtained automatically by using the simulink control design tool. The step response and open loop bode plot of the system are represented in Figs. 9 and 10 respectively. The obtained gains Kp, Ki, Kd and filter coefficients for tuned PI and PID controller is given in Tables I and II.
50
0 G.M.: Inf Freq: NaN Stable loop
Ph a se (d e g )
-50 -90
-135
P.M.: 77 deg Freq: 7.28e+003 rad/sec
-180 -1 10
10
0
10
1
2
10 Frequency (rad/sec)
10
3
10
4
10
5
Fig. 10. Open loop bode plot TABLE II VALUES OF TUNED CONTROLLER GAINS FOR PI CONTROLLER Design Summary for PI controller Tuned Block – Iacntrol /PI Controller Parameter Value Controller PI Time Domain Continuous-time Form Parallel Integrator Method Forward Euler P 0.364810170003555 I 2.36905170869252 Sample Time 0
TABLE I VALUES OF TUNED CONTROLLER GAINS AND FILTER COEFFICIENT FOR PID CONTROLLER Design Summary for PID controller Tuned Block – Iacntrl/PID Controller Parameter Value Controller PID Time Domain Continuous-time Form Parallel Integrator Method Forward Euler Filter Method Forward Euler P 8.65582150264471 I 556.085694599761 D -0.000429333544753783 N 7280.33726687915 Sample Time 0
IV.
Results Discussion and Comparison
Here two different cases of power control by the PID and PI controllers designed in section III are discussed. The first case is when both the active and reactive power demand is positive and hence the flow of power is from the d.c. side of voltage source converter to the grid.
Copyright © 2013 Praise Worthy Prize S.r.l. - All rights reserved
International Review of Automatic Control, Vol. 6, N. 6
763
Rajiv Singh, Asheesh Kumar Singh
The second case is when both the active and reactive power demands are negative and the flow of power is from grid to voltage source converter. The first case is represented in Figs. 11-14 and the second case is represented in Figs. 15-17.
In this case of study, as both the active and reactive power is positive, the currents are regulated in such a way that flow of power is directed from voltage source converter to the grid. Current at PCC 2000
1500
IV.1.
Flow of Power from Voltage Source Converter to Grid
Ia Ib Ic
1000
Current (amp)
500
Figs. 11-14 give voltages, currents, instantaneous active power and reactive power of the voltage source converter at PCC. From the active power curve in Figure 13 it can be seen that the active power demand till 0.1 second is zero and at 0.1 seconds it increases suddenly as a step function to the rated power of 1 MW and remains constant thereafter. Similarly the reactive power demand remains to zero till 0.1 seconds and suddenly changes as step function to 500 kVAr at 0.1 seconds and remains constant thereafter. From Fig. 13 it is seen that the PI controller works with better accuracy in tracking the reference signal than the PID controller having same design specifications. The reference tracking by PI controller is faster and free from oscillations but the PID controller tracks the reference with some initial oscillations that die out after some time. Similarly the reactive power tracking characteristics of both the controllers is represented in Fig. 14. The reactive power command is followed in a better way by the PI controller but the response of PID controller is manifested with initial oscillations for step change in reference. From the current curves represented in Fig. 12 it can be seen that currents in all the three phases remains zero till 0.1 seconds in order to meet the reference demand of the active and reactive power which lies to zero value till 0.1 seconds. After 0.1 seconds an increase in values of three phase currents can be seen for satisfying the reference commands as mentioned earlier. From Figs. 11-12 it can be observed that there is no change in the values of three phase voltages but the regulation of power is accomplished only by changing the magnitude and phase angles of the three phase currents. It is because the control strategy adopted here is current mode control.
0
-500
-1000
-1500
-2000
0
0.02
0.04
0.06
0.08
0.1
0.12
0.14
0.16
0.18
0.2
Time (Seconds)
Fig. 12. Voltage source converter phase currents at PCC Active Power at P.C.C.
5
12
x 10
Reference PI controller response PID controller response
10
Active Power (watts)
8
6
4
2
0
-2
0
0.02
0.04
0.06
0.08
0.1
0.12
0.14
0.16
0.18
0.2
Time (seconds)
Fig. 13. Voltage source converter active power at PCC 5
7
Reactive Power at P.C.C
x 10
6 Reference PI response PID response
Reactive Power (KVAR)
5
4
3
2
1
0
-1
0
0.02
0.04
0.06
0.08
0.1
0.12
0.14
0.16
0.18
0.2
Time (Seconds)
Fig. 14. Voltage source converter reactive power at PCC
IV.2.
PCC Voltage
Flow of Power from Grid to Voltage Source Converter
500
In Figs. 15-17 the PCC current, active power and reactive power are represented. In this case the active and reactive power demand is in negative direction to the case considered in previous section. There is a sudden increase in the value of active power demand from 0 to -1 MW at 0.1 seconds while the reactive power demand increases from 0 to -500 kVAr at 0.1 seconds. Here the PCC voltage is equal in magnitude and phase as the voltage in section IV.1, but the PCC currents are 180 degrees out of phase as can be seen from Figs. 12 and 15. The change in phase of currents is to regulate the active and reactive powers in negative direction i.e. from grid to voltage source converter.
Va Vb Vc
400
300
200
V o lta g e (V o lts)
100
0
-100
-200
-300
-400
-500
0
0.02
0.04
0.06
0.08
0.1
0.12
0.14
0.16
0.18
0.2
Time (Seconds)
Fig. 11. Voltage source converter voltage at PCC
Copyright © 2013 Praise Worthy Prize S.r.l. - All rights reserved
International Review of Automatic Control, Vol. 6, N. 6
764
Rajiv Singh, Asheesh Kumar Singh
It can be seen from active and reactive power curves in Figs. 16 and 17 that the controllers perform satisfactorily well in regulating the power from grid to voltage source converter. Like the previous case the performance of PI controller is better than PID controller in tracking both the active and reactive power reference commands. Oscillations in PID controller response in both the active and reactive power control for sudden change in reference command is evident from the curves in Figs. 16 and 17.
this tool more precise and accurate design of controllers can be obtained using the interactive GUI tools provided. Moreover it also provides easy tools for designing a set of controllers for operating a voltage source converter at different operating points. Those controllers use gain scheduling technique for changing the gains with the change in operating point of the voltage source converter. So in this work the design and performance of PI controller is relatively more accurate than the PID controller.
Current at PCC 2000
1000
Current (amps.)
Appendix
Ia Ib Ic
1500
(1) Voltage source converter parameters: Rated power= 1MW, Rated voltage=480V (L-L), Rated frequency= 50 Hz, VDC = 1450 V, Rfwd. =0.88×10⁻³ ohm, Vfwd. =1 V, Vd = 1 V. (2) Line parameters between voltage source converter and grid terminals: R=0.75×10⁻³ohms, L=90×10-5 ohms. (3) Grid parameters: Rms voltage (L-L) = 480V, frequency= 50 Hz X/R ratio=7, Short circuit level=100×106 VA. (4) Controller design parameters: Phase margin=77degrees, Closed loop band width=7.27×10³rad/s, Controller response time=0.000275 seconds, Rise time=0.000236 seconds, Settling time=0.000685 seconds, Peak=1.03, Overshoot=3.09%. (5) Tuned controller gains: Presented in Tables I and II. (6) Half bridge transfer function: 1/(100×10-5S+1.6×10-3)
500 0 -500 -1000 -1500
-2000
0
0.02
0.04
0.06
0.08
0.1
0.12
0.14
0.16
0.18
0.2
Time (seconds)
Fig. 15. Voltage source converter phase currents at PCC for negative power flow Active Power at PCC
5
x 10
2
Reference PI response PID response
Active Power(Watts)
0
-2
-4
-6
-8
-10
-12
0
0.02
0.04
0.06
0.08
0.1
0.12
0.14
0.16
0.18
0.2
Time (seconds)
Fig. 16. Voltage source converter active power at PCC for negative power flow 5
1
Reactive Power at PCC
x 10
Reactive Power (VARs)
Acknowledgements
Reference PI response PID response
0
Authors acknowledge the contribution of Amirnaser Yazdani and Reva Iravani for technical data and voltage source converter model.
-1
-2
-3
-4
-5
-6
0
0.02
0.04
0.06
0.08
0.1
0.12
0.14
0.16
0.18
References
0.2
Time (Seconds)
[1]
Fig. 17. Voltage source converter reactive power at PCC for negative power flow
[2]
V.
Conclusion
From the curves presented in section IV, it can be inferred that both the PI and PID controllers designed in section III work satisfactorily well in controlling the active and reactive powers in positive and negative directions. The PID controller response exhibits some initial oscillations for a step change in the reference command while the PI controller tracks the reference signals extremely well in both the positive and negative directions of power flow at PCC. Most of the literature available for design of controller has used analytical method of design which is time taking. The method used in this work involves robust design using the control design tool in Matlab. By using
[3]
[4]
[5] [6]
[7] [8]
Copyright © 2013 Praise Worthy Prize S.r.l. - All rights reserved
Nolan D. Calio., Dynamic modeling and control of fully rated converter wind turbines; Renewable Energy, vol.36, 2011, pp. 2287-2297. Tarek Ahmed, Katsumi Nishida and Mutsuo Nakaoka, Advanced control of PWM Converter with variable speed induction generators, IEEE Transactions on industry applications, August 2006, vol .4, pp. 934-945. Y. Ye, M. Kazerani and V.H.Quintana, A novel modeling and control method for three phase PWM converters, IEEE international conference Canada, 2001, pp 102-107. Ruben Pena, Roberto Cardenas, Ramon Blasco, Greg Asher and Jon Clare, A cage induction generator using back to back PWM converters for variable speed grid connected wind energy system , IECON, 2001, pp. 1376-1381. T. Ackerman, Wind power in power systems, John wiley and sons limited. Cherifi, D., Miloud, Y., Tahri, A., New fuzzy luenberger observer for performance evaluation of a sensorless induction motor drive, (2013) International Review of Automatic Control (IREACO), 6 (4), pp. 381-392. Erich Hau, Wind turbines-Fundamentals, Technologies, Application, Econonics, Springer, 2005. Bin Wu, Yongquiang Lang, Navid Zargari and Samir Kouro,
International Review of Automatic Control, Vol. 6, N. 6
765
Rajiv Singh, Asheesh Kumar Singh
[9]
[10]
[11]
[12]
[13]
Power conversion and control of wind energy systems, John wiley and sons limited. Amirnaser Yazdani and Reva Iravani, Voltage sourced converters in power system modeling, control and applications, John wiley and sons limited. Maskani, H., Ashouri, M., Bakhshideh Zad, B., Alishahi, S., Optimal sizing of photovoltaic/wind-generator system using gravitational search algorithm, (2012) International Review on Modelling and Simulations (IREMOS), 5 (1), pp. 214-222. Chan, W.Z., Ramachandaramurthy, V.K., The application of a SVPWM STATCOM for voltage regulation in wind power integration, (2011) International Review on Modelling and Simulations (IREMOS), 4 (5), pp. 2417-2424. Yuan, B., Zhou, M., Zong, J., Li, G., Coordinated dispatch of power generation and spinning reserve in power systems with high wind penetration, (2012) International Review of Electrical Engineering (IREE), 7 (6), pp. 6275-6284. Muthuselvan, N.B., Devesh Raj, M., Somasundaram, P., Cauchy Gaussian infused particle swarm optimization for economic dispatch with wind power generation, (2011) International Review of Electrical Engineering (IREE), 6 (1), pp. 387-395.
Authors’ information Rajiv Singh is with College of Technology, G.B. Pant University of Agriculture & Technology, Pantnagar, Uttarakhand . He has done his B.Tech. from R.E.C. Hamirpur, Himachal Pradesh, India and M.E. from MLNREC Allahabad, India. Presently he is pursuing P.hd. from MNNIT Allahabad, U.P., India. His research areas include wind power, ANN, Fuzzy, Multiagents and their applications in Electrical Engineering. Dr. Asheesh Kumar Singh is with Electrical Engg. Department MNNIT Allahabad (U.P.), India. He has done his Ph.D. from IIT Roorkee, India. His research interests include Power quality, Power system harmonics, Voltage unbalance, Energy audit etc.
Copyright © 2013 Praise Worthy Prize S.r.l. - All rights reserved
International Review of Automatic Control, Vol. 6, N. 6
766
International Review of Automatic Control (I.RE.A.CO.), Vol. 6, N. 6 ISSN 1974-6059 November 2013
Introduction to the Discrete LSDP Controller and the Performance by Exploiting the Gap Metric Theory Ali Ameur Haj Salah, Tarek Garna, Hassani Messaoud Abstract – This paper describes the introduction to the discrete LSDP (Loop Shaping Design Procedure) controller in order to develop a robust controller which guarantees the stability for the family of uncertain systems. To determine the validity domain of the discrete LSDP (DLSDP) we propose to use the gap metric theory for studying robustness properties as a function of the stability margin provided by the DLSDP controller with respect to parameter uncertainties. The latter are modeled by using the left normalized coprime factors (NCFs) representation. The effectiveness of the DLSDP controller is validated on a second-order electrical linear system. Copyright © 2013 Praise Worthy Prize S.r.l. - All rights reserved.
Keywords: Discrete Loop Shaping, DLSDP Controller, Robust Control, Gap Metric
LSDP DLSDP NCFs NLCF
Nomenclature u(t) y(t) Gc s
Continuous system input Continuous system output Nominal plant
Vc s
Continuous filter
Gc,sh s u(k) y(k) Vc Gc z
Continuous shaped plant Discrete system input Discrete system output Z-transform of Gc,sh s
Vd z
Discrete weighting filter
Gd ,sh z
Discrete shaped system
Te
D
Sampling time Unit disk The left NCFs of Gd ,sh z
sh, M , sh, N
Represent the parametric uncertainties
Gd,sh z
Uncertain shaped plant
M d-1,sh , N d ,sh
g Gd ,sh , Gd,sh
I.
Gap metric between Gd ,sh z and
Family of uncertain systems
max
Maximum stability margin T
u y P Fl P,K
Performance vector
K ,opt
Generalized system Lower linear fractional transformation Robust controller
Kd , f
Final controller
Introduction
Robustness is of crucial importance in control-system design because real engineering systems are vulnerable to external disturbance and measurement noise and there are always differences between mathematical models used for design and the actual system. Indeed a mathematical model of any real system is always just an approximation of the true, physical reality of the system dynamics [1]-[22]. The differences or errors between the mathematical models and the physical system are generally called uncertainty. There are different methods to model the uncertainty region. Here we use additive perturbations to the nominal plant coprime factors [16]. This representation of uncertainty has no restriction on the number of right half plane poles and is capable of representing a wider class of systems. Also coprime factorizations are widely used in H∞ optimal control theory for the LSDP approach which was firstly developed by McFarlane and Glover [13]-[14] and has been used successfully in many practical applications [1], [6], [11], [12], [17]. This approach is a simple and efficient robust multiinput multi-output (MIMO) controller synthesis technique that produces a controller that guarantees robust stability against normalized coprime factor uncertainty. The idea of the LSDP design is firstly to use well known loop shaping principles to introduce performance and robustness trade-offs and then to allow
Gd,sh z
max ,sh
Loop Shaping Design Procedure Discrete LSDP Left normalized coprime factors Normalized left coprime factorization
Manuscript received and revised October 2013, accepted November 2013
767
Copyright © 2013 Praise Worthy Prize S.r.l. - All rights reserved
Ali Ameur Haj Salah, Tarek Garna, Hassani Messaoud
the robustness optimization process to guarantee closedloop stability. The LSDP approach has been thoroughly investigated in continuous time case, however, in practical applications one is often concerned with discrete time case. Indeed one major reason is that to control a continuous time system we often apply a digital computer on which we can implement a discrete time controller. Therefore, we propose the synthesis of a robust controller for the uncertain discrete single-input single-output (SISO) systems. The synthesis method of a such robust controller is the extension and the generalization of the LSDP approach of McFarlane and Glover [13]-[14] in the discrete case. We exploit the bilinear transform known as Tustin's method in order to formulate the discrete loop shaping technique. A discrete weighting filter and a discrete shaped plant result from this technique. By taking into account the coprime factor uncertainty representation to define the uncertain shaped plant and by applying the small gain theorem, we define the concept of the robust stabilization of the discrete LSDP approach. This concept is based on the resolution of an optimization problem characterized by the maximum stability margin for the synthesis of the robust controller. To calculate the controller we transform this problem to a standard robust H∞ controller design based on the resolution of the Riccati equations [7]. Also, we present the gap metric theory to characterize the controller's robustness with respect to the parameter uncertainties. We note that the resulting final controller is the combination of the discrete weighting filter and the robust controller. The paper is structured as follows. The DLSDP approach is introduced in Section 2. For this introduction we present the discrete loop shaping technique, the coprime factor uncertainty representation and the robust stabilization. Section 3 develops the formulation for an optimal robust controller and the construction of the final controller by combining the weighting filter with the robust controller. The gap metric theory is detailed in section 4 in order to study the performance of the robustness of the robust controller with respect to the parametric uncertainties. In section 5 we present the validity domain of DLSDP controller as function of the effectiveness of the robust controller for the regulation of a 2nd order electrical linear system.
II. II.1.
u(t)
r(t) Vc (s)
Gc (s)
y(t)
Fig. 1. Principle of closed loop control in the continuous case
This filter has the objective to improve the performance of Gc s in a frequency response. Typically is to ensure high gain at low frequency for good tracking and low gain at high frequency for noise and disturbance rejection. The nominal model Gc s and the continuous filter
Vc s are then combined to form the continuous shaped plant Gc,sh s (see Fig. 2):
Gc,sh s Vc s Gc s
(1)
Gsh u(t)
y(t)
Vc (s)
G c (s)
Fig. 2. The shaped plant in the continuous case
Our objective is to exploit the loop shaping technique in the discrete case to identify the discrete weighting filter Vd z characterizing the discrete shaped system
Gd ,sh z defined as follows: Gd ,sh z Vd z Gd z
(2)
where Gd z Z Gc s is the Z-transformation of
Gc s . The use of the loop shaping technique in the discrete case is based on the knowledge of the functions Vc s and Gc s because we are interested to their frequency response. So we propose to calculate the discrete weighting filter Vd z such as the frequency domain of
Vd z Gd z is similar to that of
DLSDP Controller
Vc s Gc s
in
order to guarantee the same performance. This can be treated by applying the bilinear transform known as Tustin's method by projecting the frequency behavior of Vc s Gc s in the complex plane via its Z-
Discrete Loop Shaping Technique
The closed loop control of a SISO continuous linear system is illustrated as follows. Here u(t) is the input, y(t) is the output and r(t) the reference with Vc s and Gc s are the continuous-time
transformation Vc Gc z Z Gc,sh s . This is obtained by the following change of variable:
controller and the open loop system transfer function respectively. The continuous-time controller can be synthesized using the loop shaping (LS) technique [14], [15], [18] which may consist in choosing a weighting filter for nominal plant Gc s .
s
Copyright © 2013 Praise Worthy Prize S.r.l. - All rights reserved
2 z 1 Te z 1
z
1 s Te 2 1 s Te 2
(3)
International Review of Automatic Control, Vol. 6, N. 6
768
Ali Ameur Haj Salah, Tarek Garna, Hassani Messaoud
II.2.
where Te is the sampling time and z e j wTe . We note that with this transformation, the stability property of the poles is preserved. Indeed, we have the following equivalence z D Re al s 0 with D the unit
D z :
disk
The discrete shaped plant Gd ,sh z defined by (2) can be described by the state-space equations:
z 1 . This transformation provides
x k 1 Ash x k Bsh u k y k Csh x k Dsh u k
for z e j wTe :
Vc j 2 Te tan w Te 2
(7)
where x(t) is the n-dimensional state vector and A nn , B n×1 , C 1×n and D are the matrices such as the pairs (A, B) and (A, C) are assumed to be, respectively, controllable and observable. In this case the transfer matrix of the discrete shaped plant Gd ,sh z can be derived as:
Vc Gc z Vc Gc e j wTe Gc,sh j 2 Te tan w Te 2
Coprime Factor Uncertainty Representation
(4)
Gc j 2 Te tan w Te 2 We have that the discrete-time filter behaves at frequency w the same way that the continuous-time filter behaves at frequency wa 2 Te tan w Te 2 .
A Gd ,sh sh Csh
Bsh H Dsh
D
(8)
1
Dsh Csh z I n Ash Bsh
This means that for every feature that one sees in the frequency response of the analog filter for wa , , there is a corresponding feature, with
where H D denotes the Hardy space of stable,
identical gain and phase shift, in the frequency response of the digital filter for w Te , Te
proper and real rational transfer functions analytic in D [18]. Moreover, H D is the closed subspace of
( f f e 2 , f e 2 where f e 1 Te ). We note that for
L∞( D ) which is the Banach space of essentially bounded matrix functions with norm:
low frequencies (that is, when w 2 Te ) we have w wa . In this case, we choose a corner frequency
F
wc 2 Te , that is to say a natural frequency f c f e / , in order to obtain:
F e j 0 ,2 sup
(9)
with F z the largest singular value of F z . We note that according to Zhou and al. [18] the function Gd ,sh z have the following normalized left
Vc Gc z Vc j w Gc j w w ,wc (5) Therefore, in order for the frequency response performance of Vd z Gd z to be similar to the one of
coprime factorization (NLCF):
Gd ,sh z M d-1,sh z N d ,sh z
Vc Gc z w ,wc Te , Te , we deduce
(10)
from (2) and (5) that the discrete weighting filter Vc z where M d-1,sh
is as follows:
Vd z
Vc Gc z
the left NCFs of
(6)
Gd z
Gd,sh(z)
H V
H
D
are
-1/ 2
Bsh H Dsh V -1/ 2 Dsh
(11)
y(t)
u(k)
Vd (z)
Ash H Csh M d ,sh -1/ 2 Csh V Ash H Csh N d ,sh -1/ 2 Csh V
We can represent the discrete loop shaping in Fig. 3 for the digital control of a continuous system.
r(k)
D and N d, sh Gd ,sh z such as:
H
D/A
Gc (s)
with:
T H Bsh Dsh Ash Y Csh V 1 n1
y(k) A/D
(12)
T 2 V R1 Csh Y Csh , R1 1 Dsh (13)
Fig. 3. The shaped plan in the discrete time
Copyright © 2013 Praise Worthy Prize S.r.l. - All rights reserved
International Review of Automatic Control, Vol. 6, N. 6
769
Ali Ameur Haj Salah, Tarek Garna, Hassani Messaoud
and Y ( nn ) is the unique positive definite solution of the following algebraic Riccati equation:
Y I n n
R11 Csh
T Csh
Y
1
T
input L and the performance vector u y :
u TL z L y
T
(14)
T – Y Bsh R11 Bsh 0
(19)
K z TL z 1 Gd,sh z K z 1
where:
Ash Bsh Dsh R11 Csh nn
TL
[14] we consider the difference between the shaped representation Gd ,sh z and the shaped uncertain model
sh, M sh, N
representation. Indeed, from (10) each uncertain shaped plant Gd,sh z can be described by:
N
d ,sh
where sh, M H D
and sh, N
1
(21)
sh, N e j
sup 0 ,2
sh, N sh, M
2
sh, M e j
2
(22)
(16)
z sh, N z
-1 M sh z (20)
since:
can be modeled by using the NLCF
-1
sh, M sh, N
models. Similarly for the shaped plant Gd ,sh z and in
Gd,sh z M d ,sh z sh, M z
1
From small gain theorem we obtain the sufficient condition for stability of Gd,sh z :
(15)
In the presence of parametric uncertainties in the transfer function Gd z , we can obtain a set of uncertain
Gd,sh z
and from (17) the condition (21) becomes:
H
TL
D
are stable unknown transfer functions which represent the parametric uncertainties on the left NCFs in the shaped plant Gsh s such as:
1
(23)
u(k)
L
[Δsh, N -Δsh, M ] y(k)
sh, N sh, M
(17)
TL (z)
++
In this case the set of uncertain plants ,sh is defined
+
by:
,sh
/
II.3.
Robust Stabilization
Gd,sh
sh, N sh, M
1 M d,sh
(18)
K
N d, sh
Given the family of the uncertain plants ,sh defined Fig. 4. Stability robustness
by (18), the robust stabilization problem [14] based on the H∞ optimization is to find a realizable, robust output feedback controller K∞ which stabilizes all perturbed shaped plant Gd ,sh . In this case we can deduce a
Thus, by applying the small gain theorem for the representation of Gd,sh z in Fig. 4 and taking into relations (20) and (23) we can obtain the following theorem:
representation illustrated in Fig. 4. According to this Figure we can exploit the small gain theorem to study the robust stability of the controller K∞ against parametric uncertainties in NLCF. From Fig. 4 we consider the transfer function TL z between the
Theorem 1: Consider the NLCF of the shaped plant Gd ,sh z M d-1,sh z N d ,sh z and stable norm-
Copyright © 2013 Praise Worthy Prize S.r.l. - All rights reserved
International Review of Automatic Control, Vol. 6, N. 6
770
Ali Ameur Haj Salah, Tarek Garna, Hassani Messaoud
Lemma 1: N *d ,sh and M *d ,sh are the left NCFs such
bounded left NCFs uncertainties sh sh, N sh, M
that:
and 0 . A robust sh, N sh, M controller K stabilizes the uncertain shaped plant with
-1
Gd,sh M d ,sh sh, M
N
d ,sh
sh, N
N *d ,sh M *d ,sh
1
1 M sh
From [14] we have:
N *d ,sh U M *d ,sh V
inf
1
(24)
U ,V
▄
where
The inequality of Theorem 1 implies that there is a minimum value 1 below which there is not a K∞
H
K
1
M d1,sh
(25)
-1
sh, N
d ,sh
K 1 1 Gd ,sh K and max
1
1
2
(32)
H
III. Synthesis of the Robust Controller The synthesis problem of robust controller K∞ stabilizing Gd,sh can be solved by considering a general method of formulating control problems introduced by Doyle [3]-[4]. The concept of this method is to consider the generalized feedback interconnection scheme where signal L represents all exogenous inputs, which may include plant disturbances, sensor noise and reference signals. In fact by considering Fig. 4 and the performance
if:
M d-1,sh
(31)
H
max 1 N d ,sh M d ,sh
the sh, N sh, M stabilize the uncertain shaped plant
N
2
By comparing the inequality of (26) this result allows to define the maximum stability margin max :
Proposition 1: For
Gd,sh M d ,sh sh, M
(30)
1 N d ,sh M d ,sh
As a result, we note that the maximum value max is the maximum stability margin. Then we have the following proposition:
robust controller K
H
into account the inequality (29) we have:
This amounts to finding the maximum value max of the quantity for which the controller K∞ exists as follows:
K 1 1 Gd ,sh K
N d ,sh M d ,sh
is the Hankel norm. From (28) and taking
controller which guarantees the stability of Gd,sh system.
1 max inf
(29) ▄
for all such
sh if: K 1 1 Gd ,sh K
1
T
vector u y , the feedback system using the
(26)
complete system concept is then depicted in the following Figure 5.
▄ L
For the calculation of the value of the maximum stability margin max we exploit the following theorem and lemma of McFarlane and Glover [14].
K Fig. 5. Generalized feedback interconnection
1
M d-1,sh
1
(27)
Here P is called the generalized system. From Fig. 5 we have:
if and only if K U V 1 such as U and V verify:
N *d ,sh U * M d ,sh V
y
u
Theorem 2: The controller K satisfies:
K 1 1 Gd ,sh K
P
1 2
1/ 2
Y z M d1,sh z L z Gd ,sh z U z
(33)
(28)
with Y z , L z and U z are the Z-transforms of
▄
y(k), L(k) and u(k) respectively. From (11) the function M d1,sh z is defined as follows:
Copyright © 2013 Praise Worthy Prize S.r.l. - All rights reserved
International Review of Automatic Control, Vol. 6, N. 6
771
Ali Ameur Haj Salah, Tarek Garna, Hassani Messaoud
H V 1/ 2 V 1/ 2
Ash M d1,sh z Csh V
1/ 2
From Fig. 5 we note that the generalized plant P and the robust controller K are characterized by the lower
(34)
1
Csh z I Ash H V
linear fractional transformation Fl P,K . The latter is
1/ 2
the transfer function between the exogenous input L and the performance vector . We note that a general H∞ control problem can be described using the framework of Fig. 5. The design objective is to find an optimal controller K ,opt which minimizes the H∞ norm of
Substituting relations (10) and (34) into (33) we obtain:
L z Y z V 1 / 2 Dsh U z
Fl P,K . This amounts to computing the controller
1 Csh z I Ash H V 1 / 2
L z Bsh U z
K ,opt as:
(35)
Fl P,K
L u
opt
(43)
with:
Therefore, we conclude that the generalized system of Fig. 5 is expressed by the following equation:
y P z
opt inf
Fl P,K
K ,opt
(44)
From Fig. 4 and taking into account the relations (19) and (20) we deduce:
(36)
u K y K Fl P,K 1 Gd,sh K 1
where the generalized system P is defined by the following representation:
Fl P,K
1 max
B2 D12 D22
(38)
Y ( n n ) as follows: T
T X Ash X Ash F R
B1 H V 1 / 2 n 1 , B2 Bsh n 1 01n 2 n C1 , C2 Csh 1 n C sh
(39)
0 1 2 1 D11 1 / 2 2 1 , D12 D V sh
(46)
discrete-time algebraic Riccati equations (DARE) to be solved with respect the unique two stabilizing, feasible X ( n n ) and and non-negative solutions
with:
(45)
It is shown in Green and Limebeer [7] that an internally stabilizing Output Feedback (OF) controller 1 satisfying Fl P,K max exists if there exist two
is defined as follows:
D21
-1 T M sh L
systems described by Gd,sh as:
and from (37) the transfer matrix P z associated with P
B1 D11
1
As a result, comparing relations (25) and (26) with (44) and (43) respectively, we propose to synthesize the robust controller K ,opt that stabilizes all uncertain
x k 1 Ash x k H V 1 / 2 L k Bsh u k 0 01n k 1 x k 1 / 2 L k Csh V P: (37) 1 u k Dsh y k C x k V 1/ 2 L k D u k sh sh
Ash P z C1 C 2
T Y Ash Y Ash M S
D21 V 1 / 2 , D22 Dsh
F Q
T
M B1 B1T
(47) (48)
where F , R , Q , M , S and B1 quantities are defined from the relation (38):
(40)
1
1
F F BT X Ash , R R BT X B
(41)
T Q Csh Csh , M M Ash Y C T
S S C Y C T
(42)
Copyright © 2013 Praise Worthy Prize S.r.l. - All rights reserved
(49)
(50)
International Review of Automatic Control, Vol. 6, N. 6
772
Ali Ameur Haj Salah, Tarek Garna, Hassani Messaoud
with:
DT F 11 C1 2 n , B B1 B2 n 2 DT 12 2 DT D max R 11 11 T D12 D11
T D11 D12 2 2 T D12 D12
V R31 R 2 V 1 1 21 2 2 Dt 12 1 D21 V21 0 0 1 J 2 2 2 0 max
(51)
M t Bt J DtT M t1 M t 2 n 2
(52)
S t1 St Dt J DtT T St 2
T M B1 D11 D21 n 3
C C 1 3 n C2
St 2 2 2 St 3
V R 31 F 2 R 2 1 F 12 Ct C2 D21 1 F
2 D DT max I 22 S 11 11 T D21 D11
T D11 D21 3 3 T D21 D21
(61)
(53)
(62)
C
2 n (63) Ct 2 t1
where: 1
M t1 B1 V212 V12 R 3 R 2 n 1
here, however, due to the structure of P(z) in (38), it can be shown that the solution of the Riccati Eq. (48) is always zero. In this case, the synthesis of the robust controller K ,opt is simplified by taking into account the solution
M t 2 B1 V212 D21 n 1
1
St1 V12 R3 R 2 V211
X of the Riccati Eq. (47). To compute the controller,
St 2
according to the relations (49) the matrices F and R are reformulated as follows:
1 V12 R 3
R 2 V212
2
2 max
(64)
(65)
D 21 1
St 3 D21 V212 V12 R 3 R 2
'
R1 F1 F , R R 2 F 2
R2 R3
St 2 D21 V211
(54)
1
Ct1 V12 R3
such as:
F1 F2
T D11 C1 B1T X T D12 C1 B2T X
Ash
F
2
2
n 1
R 2 1 F R1 n
(66)
(67)
Ct 2 C2 D21 1 F R1 n
(55)
Ash Therefore, the robust controller K ,opt is defined by
R1
T D11
2 D11 max
B1T
X B1
T R 2 D12 D11 B2T X B1 T R3 D12 D12 B2T X B2
the following transfer function [7]:
(56)
A K ,opt K CK
(57)
BK DK
(68)
with:
In addition, the following quantities are defined in order to calculate the robust controller K ,opt :
AK At B2 V121 St 2 St31 Ct 2 B2 V121 Ct1 M t 2 St31 Ct 2
(69)
1
R1 R 2 R 3 R 2 0 F F 1 V12
1 R 2 R3
R3 , V21
At Ash B1 Bt
B1 V211
1
(58)
BK M t 2 St31 B2 V121 St 2 St31
(70)
CK V121 Ct1 V121 St 2 St31 Ct 2
(71)
DK V121 St 2 St31
(72)
F2
2 max
F
(59)
n n
0n1 n 2
Thus, taking into consideration the closed loop control and DLSDP approach, the final controller K d , f z is
(60)
Copyright © 2013 Praise Worthy Prize S.r.l. - All rights reserved
International Review of Automatic Control, Vol. 6, N. 6
773
Ali Ameur Haj Salah, Tarek Garna, Hassani Messaoud
the product between the weighting function Vd z and
margin max . Then the robust controller K∞,opt guarantees the closed-loop stability of uncertain systems
the robust controller K ,opt z . Robust closed-loop
Gd,sh such as g Gd ,sh ,Gd,sh
control can be illustrated by Fig. 6, where the final corrector K d , f z associated with continuous plant
max
. ▄
Gc s is defined as follows:
From theorem 3 and relation (18) we conclude that the discrete robust controller K ,opt obtained by DLSDP
K d , f z Vd z K ,opt z
(73)
approach for the shaped system Gd ,sh with maximum stability margin max , ensures the stabilization of all
Kd,f u(k)
r(k) K, opt (z)
Vd (z)
u(t)
G c (s)
D/A
uncertain systems Gd,sh of the models family max ,sh
y(t)
defined by:
max ,sh Gd ,sh / sh,N sh,M
y(k) A/D
Furthermore, to ensure the similarity between the frequency response of K ,opt z Gd ,sh z and that of Tustin, the value of max must satisfy the following condition [6]: 0.2 max 1 (74)
where Gd ,sh , max
(76)
is the ball of radius max
representing the neighborhood defined by the gap metric between the shaped system Gd ,sh and the uncertain
Suitable Uncertain Region
shaped system Gd,sh :
From authors [2], [5], [8], [9], the gap metric is an algebraic measurement used to quantify the degree of similarity between two models. In the case of the shaped system Gd ,sh and uncertain shaped system Gd,sh this
Therefore,
Gd ,sh , max
Gd ,sh , max Gd,sh , g Gd ,sh , Gd,sh max (78)
can be illustrated by quantifying the distance between these two systems as follows:
is considered as the
suitable uncertainty region defined the robustness of the K ,opt . This region can be illustrated by Fig. 7.
g Gd ,sh , Gd,sh inf Q H D sup inf Q H D
max
K ,opt stabilizes Gd,sh Gd,sh Gd ,sh , max (77) and Gd ,sh max ,sh
Gd ,sh z by applying the bilinear transformation of
Thus it follows from Theorem 3 a robustness property based on gap metric expressed by the following equivalence:
Fig. 6. DLSDP approach
IV.
M d ,sh M d ,sh sh,M Q N d ,sh N d ,sh sh,N
, (75) M d ,sh sh,M M d ,sh Q N d ,sh sh,N N d ,sh
max G d, sh g Gd,sh , Gd,sh max
The computation of the gap aims to solve 2-block H∞ problems. The particular method used here for solving the H∞ problems is based on Green et al. [10]. Consequently, it results from the combination of DLSDP approach with the gap metric theory the following theorem [8].
Fig. 7. Suitable uncertainty region
V.
Theorem 3: Consider a shaped plant Gd ,sh with its
Application to a 2nd Order Electrical Linear System V.1.
NLCF Gd ,sh z M d-1,sh z N d ,sh z and its robust
System Description
We consider a 2nd order electrical linear system represented by the following circuit (Fig. 8).
controller K∞,opt calculated for the maximum stability Copyright © 2013 Praise Worthy Prize S.r.l. - All rights reserved
International Review of Automatic Control, Vol. 6, N. 6
774
Ali Ameur Haj Salah, Tarek Garna, Hassani Messaoud
R2
C1
and we get a corner frequency wc :
wc 9.9762 104 rad/s +5 v
u(t)
For the discrete time the simulations are carried out with a zero order B0 s hold and a sampling interval
+5
+
R1
R
+
R1
Te 10 ms:
y(t)
C1
B0 s Fig. 8. 2nd order electrical linear system
R2 2
R R1 R2 C1 C' s R R1 C1 s R2
Gc s and Gc,sh s respectively: (79)
Gd z Z B0 s Gc s
1 such as k = 1 is the static gain, w0 the R R1 C1 C' R R1 C1 C'
ratio. For the nominal representation G(s) we set:
V.2.
68000 0.01572 s 46.24 s 68000
(81)
2.7
and
pass filter and they are similar for the variation range of wc 2 Te 200 rad/s . This characteristic plays an important role for the regulation by elimination of high frequency disturbances. From (87) and (89), the transfer matrix (8) of G d, sh (z) = Vd (z) G d (z) is defined by the
The filter can increase the gain in low frequencies and reduce the gain at high frequencies. As a result, Gc,sh s
following state matrices Ash, Bsh, Csh and Dsh:
is written:
4.4563 0.8 0.001 1 Ash 104 0.8192 0 0 , Bsh 0 (90) 0 0.0008 0 0
Gc,sh s Vc s Gc s (83)
183600
Gc,sh s
Vd z Gd z . We note that these functions act as a low
(82)
s 0.001
2
z 3 z 2 4.421 107 z 1.685 1013
in Fig. 9 the bode diagrams of
continuous weighting functions Vc s as follows:
3
25.16 103 z 2 18.36 104 z 4.059 1010 (88)
Using the Tustin bilinear transformation by the change of variables z 1 s Te 2 1 s Te 2 we represent
For the shaped representation Gc,sh s we choose the
z 1.685 10
13
0.02516 z 4 18.36 104 z 3 1.218 109 z 2 4.889 1016 z 6.84 1023 (89) z 4 z 3 1.009 106 z 2 4.192 1013 z 9.554 1020
Synthesis of Controller
Vc s
z 4.422 10
7
Vd z
(80)
2
2
Then from relation (6) we deduce:
and Gc s can be written as:
Gc s
(87)
z 5.67 107
Vc Gc z Z B0 s Gc,sh s
the damping
C' C0' 0.5 108 F
(86)
and we deduce the Z-transforms Gd z and Vc Gc z of
s 2 2 m w0 s w02
1 2 R2
(85)
wc 2 Te 200 rad/s
k w02
natural frequency and m
1 eTe s s
We note from (85) that:
Here R1 = R = R2 = 68 k, C1 = 10 nF and C’ a variable capacity. The system is defined by the following transfer function:
Gc s
(84)
C’
Csh 0.0252 1.8801 0.0272 ,Dsh 0
3
0.01572 s 46.24 s 68 10 s 68
Copyright © 2013 Praise Worthy Prize S.r.l. - All rights reserved
International Review of Automatic Control, Vol. 6, N. 6
775
Ali Ameur Haj Salah, Tarek Garna, Hassani Messaoud
Bode Diagram
As a result, the final K d , f z Vd z K ,opt z associated
100 75
Gc, sh(s)
50
Vd (z) Gd (z)
corrector with the
continuous plant Gc s is defined as follows:
25
M a g n itu d e ( d B )
0 -25 -50 -75
Kd , f z
-100 -125
0.002148 z 3 1.566 10 4 z 2 8 15 1.032 10 z 9.166 10 1.886 z 3 0.8858 z 2 z 2.213 104 z 2.73 10 10
(95)
4
-150
/ Te
-175 -200
-4
10
-3
10
-2
10
-1
0
10
10
1
10
2
10
3
4
10
5
10
10
Frequency (rad/sec)
V.3.
Bode Diagram
2.7 2.3 -22.7
Gc, sh(s)
To test the performance of the final controller K d , f
Vd (z) Gd (z)
-47.7
which guarantees via the robust controller K∞,opt the robust stabilization of the closed-loop system with respect to the parametric uncertainties of the function Gc s , we propose to disturb the nominal model Gc s
-72.7 -97.7 P has e (deg)
Robustness Verification
-122.7 -147.7 -172.7
by varying the capacitance value C0' . This variation results from an added parametric uncertainty to the value of C0' as follows:
-197.7 -222.7
/ Te
-247.7 -272.7
-4
10
-3
10
-2
10
-1
10
0
1
10
10
2
10
3
4
5
10
10
10
Frequency (rad/sec)
C' C' C0' C' / C0' 0.033 108 F
Fig. 9. Bode diagrams of Gc ,sh s and Vd z Gd z
(96)
and C' 0
By solving the Riccati Eq. (14) we obtain Y:
As a result, from (79) we get the uncertain system GcC ' s :
-0.0007 -0.0507 -0.0007 Y -0.0507 -3.7855 -0.0548 -0.0007 -0.0548 -0.0008
(91)
GcC ' s
From relation (11) we calculate M d ,sh and N d ,sh :
k w02,C ' s 2 2 mC ' w0 ,C ' s w02,C '
(97)
with:
0.98662 z 1 M d ,sh z 0.9734
w0 ,C '
0.024827 z 0.07296 z 2.211 107 N d ,sh z 0.9734 z 2 4.422 107 z 1.685 1013
mC '
(92)
z 4.915 10
0
C'
GdC ' z Z B0 s GcC ' s C' Gd,sh z Vd z GdC ' z
(99)
In order to assess the degree of stability of the transfer
0.08537 z 2 5.675 106 z 1.251 1012 (94) z 0.8856 z 2.222 10
C'
uncertainty C' :
(93)
K , opt z 4
(98)
R R1 C1
In this case, according to the relations (87) and (2) the
By applying (68) we get the robust controller K , opt ::
2
1 2 R2
C' shaped plant Gd,sh z are in function of the parametric
max 0.6949
3
R R1 C1 C0' C'
uncertain discrete plant GdC ' z and the uncertain
As a result, according to (32) we have:
1
C' function Gd,sh as function of the parametric uncertainty
11
ΔC’, we represent in the Figs. 10 and 11 the evolution of
Copyright © 2013 Praise Worthy Prize S.r.l. - All rights reserved
International Review of Automatic Control, Vol. 6, N. 6
776
Ali Ameur Haj Salah, Tarek Garna, Hassani Messaoud
C' the phase margin Mφ and the gain margin Mg of Gd,sh
1 0.9
depending on ΔC’. Based on these Figures, we find that
0.8
C' the uncertain shaped model Gd,sh becomes unstable for
0.0405
max
= 0.6949
and
0.6
'
F since M
C' Gd,sh
) C g (Gd, sh, G d, sh
C' 0.551 10
5
C' Mg Gd,sh 0 dB . It is therefore important to determine
0.5 0.4 0.3
the variation range of the parameter uncertainty ΔC’ for which the robust controller K∞,opt ensures the robust stabilization for the uncertain shaped system
C' Gd,sh
0.2 0.1
.
0
In this case, using the metric gap theory we propose to quantify from the relation (75) the distance between the shaped system Gd ,sh and the uncertain shaped system C' Gd,sh
0
0.57
1
such as g
as a function of ΔC’
3
3.5
G
C '
d ,sh
,G
C ' d ,sh
as a function of Δ
-5
C’
max
0,45 0,4
C' such as g Gd ,sh , Gd,sh max , while the Fig. 13
0,35
shows the variations of the damping coefficient mC' in
0,3 C'
terms of ΔC’.
m
0,25
100
0,2
80
0,15 0.1
60
0,05 0,0226 0
40 M (°)
2.5
x 10
Fig. 12. Evolution of g Gd ,sh , Gd ,sh
max . This is illustrated by plot in Fig. 12 the variation of
2 C' (F)
with respect to the maximum stability margin
C' the gap metric g Gd ,sh , Gd,sh
1.5
20
0
0.1
0.2
0.3
0.4
0.551
0.7
0.8
0.9
C' (F)
1
x 10
-5
-0.0405
Fig. 13. Evolution of m
-30.0 -40 -60
We note from Fig. 12 that the limit value of the gap 0
0.1
0.2
0.3
0.4
0.551
0.7
0.8
0.9
C' (F)
C ' d ,sh
Fig. 10. Evolution of M G
as a function of Δ
C' g Gd ,sh , Gd,sh max
metric
1
x 10
-5
is
obtained
for
C' 0.57 105 F . This value is greater than the value C' 0.551 105 F that characterizes the instability of
C’
C' the uncertain shaped system Gd,sh . In this case, we
100
summarize in Table I for two values of ΔC’, C' 106 F
90 80
60
C' 0.564 105 F , the performances of the controllers K∞,opt and K d , f which are evaluated by the
50
following criteria:
40
-
C' The gap metric g Gd ,sh , Gd,sh .
-
The
and
70 Mg (dB)
as a function of ΔC’ C'
30 20
phase
margins
M K
, opt
C' Gd,sh
and
and
M K d , f GdC ' .
10 0
0
0.1
0.2
0.3
0.4
0.551 C' (F)
C '
Fig. 11. Evolution of Mg Gd ,sh
0.7
0.8
0.9
as a function of Δ
x 10
1
-
-5
The
gain
margins
C' Mg K , opt Gd,sh
Mg K d , f GdC ' .
C’
Copyright © 2013 Praise Worthy Prize S.r.l. - All rights reserved
International Review of Automatic Control, Vol. 6, N. 6
777
Ali Ameur Haj Salah, Tarek Garna, Hassani Messaoud
4
To control the system we plot in Figs. 14-17 the evolution of the reference and the output signals using the final controller K d , f by considering C' 106 F
3.5 3
TABLE I PERFORMANCES OF THE CONTROLLERS
Voltage (V)
and C' 0.5635 105 F . K , opt AND K d, f
2.5 2 1.5
C '
C
'
C '
M K M K Mg K Mg K
C '
g Gd ,sh , Gd ,sh C '
Gd ,sh
, opt
C '
Gd
d,f
C '
10-6 F 1.005×10⁻⁶ F
0.5635×10⁻⁵ F 0.564×10⁻⁶ F
0.1543
0.6936
259.1 °
259.1 °
259.6 °
259.6 °
0.5 0
Gd , sh
39.3 °
46.3 °
d,f
C ' d
43 °
48.2 °
1
2
3
4
5
6
7 8 9 Time (s)
10 11 12 13 14 15 16
for C ' 0.5635 10
5
4
10 11 12 13 14 15 16
F
4 3.5
3.5
3 Voltage (V)
4
3
Voltage (V)
0
Fig. 16. Signal output y(k) and reference r(k) signals
, opt
G
1
2.5
2.5 2 1.5
2 1
1.5 0.5
1
0
0.5 0
0
1
2
3
4
5
6
F
3
5
6
7 8 9 Time (s)
5
F
sampling instants such as 0 C' k 2 105 F .
4
This variation is illustrated in Fig. 18 and defined by the relation (100). Then we plot in Figs. 19 and 20 the evolution of the reference and the output signals and the control signal for the controller K d , f :
3.5 3 Voltage (V)
2
Furthermore, we propose to test the performance of the controller K d , f for a variation of ΔC’ during the
Fig. 14. Signal output y(k) and reference r(k) signals for C ' 1.005 10
1
Fig. 17. Control signal u(k) for C ' 0.5635 10
7 8 9 10 11 12 13 14 15 16 Time (s)
6
0
2.5 2
C' k 105 1 sin 0.15 k cos 0.6 k (100)
1.5
According to the Figs. 14 and16 relating to the system output for the fixed perturbations C' 1.005 106 F
1 0.5 0
0
1
2
3
4
5
6
and C' 0.5635 105 F respectively and also according to the Fig. 19 for a variable perturbation, we observe that the performance in term of prosecution for the final controller K d, f is similar by pointing out the
7 8 9 10 11 12 13 14 15 16 Time (s)
Fig. 15. Control signal u(k) for C ' 1.005 10
6
correspondence between outputs and the reference signal.
F
Copyright © 2013 Praise Worthy Prize S.r.l. - All rights reserved
International Review of Automatic Control, Vol. 6, N. 6
778
Ali Ameur Haj Salah, Tarek Garna, Hassani Messaoud
2
x 10
system GcC ' s becomes increasingly oscillating and
-5
1.6
approaches the instability. Indeed, from the relation (98) the value of C' passes from 0.7066 for C' =
1.4
4.6775×10⁻⁹ F to 0.05 for C' = 10-6 F and after to
1.8
0.0112 for C' = 2×10⁻⁵ F. In addition, according to Figures 15, 17 and 20 we can note that the control signal does not present saturation. These performances are related to the robust stability which is guaranteed by the discrete LSDP strategy using the Robust H controller design. Indeed, this performance depends on the stability guaranteed by the robust controller K , opt for the final
' (F) C
1.2 1 0.8 0.6 0.4 0.2 0
0
1
2
3
4
5
6
7 8 9 Time (s)
controller K d , f . From a numerical point of view, these
10 11 12 13 14 15 16
performances appear quite remarkable in the Table I if we examine the values of phase margin and gain
Fig. 18. Evolution of C ' k
calculated
Voltage (V)
4
the
instability
area
C' Gd,sh
of
3.5
characterized by C' ≥ 0.551×10⁻⁵ F. Indeed, for C' =
3
0.5635×10⁻⁵ F (> > C0' ) and from Table I we get by the
respectively
2
Mg K
and
0.5
0
1
2
3
4
5
6
7 8 9 Time (s)
259.1°
and
259.6° and the gain margins
C' Gd,sh = 46.3 dB and Mg K d , f GdC ' = 48.2
C' aims to stabilize the uncertain shaped system Gd,sh . This
Fig. 19. Signal output y(k) and reference r(k) signals for 0 C ' k 2 10
the phase margins
dB respectively. This property confirms the stability result of Theorem 1 where the robust controller K , opt
10 11 12 13 14 15 16
5
,opt
Kd , f
C' = M K ,opt Gd,sh
M K d , f GdC '
1
0
K , opt
controllers
2.5
1.5
F
performance is also ensured by the controller K d , f with
4
C' respect the uncertain system Gd,sh . Also, we note that
3.5
these stability performances are immediate taking into account the theory of the gap metric. In fact, when the
3 Voltage (V)
around
C' uncertain shaped system Gd,sh is unstable we have from
2.5
Fig. 12 and for C' = 0.5635 10-5 F a gap metric
2
to the robust controller K , opt which stabilizes the
1
uncertain
0.5 0
C' g Gd ,sh , Gd,sh max . By Theorem 3 this result is due
1.5
0
1
2
3
4
5
6
7 8 9 Time (s)
Fig. 20. Control signal u(k) for 0 C ' k 2 10
C' Gd,sh
C' g Gd ,sh , Gd,sh max
10 11 12 13 14 15 16
5
system
satisfying
the
condition
defining
the
suitable
uncertainty region. Furthermore, according to the Fig. 19 we observe the robustness of the controller K d,f with
F
respect to the temporal variation 0 C' k 2 105 F of the parametric uncertainty
The Figs. 16 and 19 indicate that the control of the system presents for the output signal y(k) some oscillations which are of low amplitude according to the increase in the value of the parametric uncertainty C' . This is explained by the reduction of the damping ratio mC ' due to the increase of the perturbation C'
C' .
VI.
Conclusion
In this paper we have introduced the DLSDP approach
since we note from the relation (97) that the uncertain Copyright © 2013 Praise Worthy Prize S.r.l. - All rights reserved
International Review of Automatic Control, Vol. 6, N. 6
779
Ali Ameur Haj Salah, Tarek Garna, Hassani Messaoud
Verlag, Berlin. 1990. [15] S. Mammar, and G. Duc, A loop shaping Hinfini design: Application to the robust stabilization of a helicopter, Control Engineering Practice, Vol. 1, (Issue 2):349-356, 1993. [16] E. Prempain, and I. Postlethwaite, Static H∞ loop shaping control of fly-by-wire helicopter, Automatica, Vol. 41, (Issue 9):1517– 1528, 2005. [17] A. Tahar, M. N. Abdelkrim, Multimodel H∞ Loop Shaping Control of Uncertain Weakly Coupled Systems, (2011) International Review of Automatic Control (IREACO), 4 (3), pp. 351-361. [18] K. Zhou, J. C. Doyle, K. Glover, Robust and Optimal Control (Prentice-Hall, 1996). [19] Vachirasricirikul, S., Ngamroo, I., Heuristic optimization basedfixed structure robust H∞ loop shaping controller design with automatic weights selection of controllable distributed generations for Microgrid stabilization, (2012) International Review of Electrical Engineering (IREE), 7 (2), pp. 4146-4154. [20] Rajaa Vikhram, G.Y., Latha, S., Robust shunt FACTS controller design for power system damping improvement, (2013) International Review of Electrical Engineering (IREE), 8 (2), pp. 792-801. [21] L. Saidi, S. Benacer, M. Boulemden, A New Sensitivity Function Loop Shaping Design Based on Extended Observers, (2011) International Review of Automatic Control (IREACO), 4 (5), pp. 594-601. [22] Dchich, K., Zaafouri, A., Chbeb, A., Jemli, M., Position sensorless robust control of PMSM using the Extended Kalman Filter algorithm, (2013) International Review on Modelling and Simulations (IREMOS), 6 (2), pp. 380-386.
and shown that, for a linear system, the validity of this approach to maintain the desired robustness depends on a suitable uncertainty domain. The latter is obtained by calculating the gap metric between the shaped nominal linear system and the corresponding shaped uncertain system depending on the stability margin. Indeed a simple and qualitative condition to verify whether the DLSDP controller stabilizes an uncertain system is to check whether the gap between the two systems is smaller than the stability margin which is determined by the DLSDP approach. We note that the only weak point of this approach is the important calculation for the discrete weighting filter and the robust controller. As an extension of this work, we can apply for a nonlinear system the DLSDP approach for each sub-model representing an equilibrium point. Then, the different robust controllers synthesized for the different equilibrium points will be used synthesizing the robust control of the nonlinear system by applying the gain scheduling technique.
References [1]
[2]
[3] [4]
[5]
[6]
[7] [8]
[9]
[10]
[11]
[12]
[13]
[14]
SL. Ballois, and G. Duc, H∞ control of a satellite axis: Loop shaping, controller reduction, and μ-analysis, contr. Eng. Practice, Vol. 4 (Issue 7):1001-1007, 1996. S. M. Djouadi, and L. Yanyan, On the computation of the gap metric for LTV systems, Systems & Control Letters, Vol. 56 (Issue 11-12):753-758, 2007. J. C. Doyle, Advances in Multivariable Control, Lecture Notes at ONR/Honeywell Workshop, Minneapolis, Oct. 8-10, 1984. J. C. Doyle, Synthesis of robust controllers and filters, Proc. IEEE Conf. on Decision and Control, pp. 109-114, San Antonio, Texas, 1983. J. Feng, A study of optimality in the H∞ loop-shaping design method, Ph.D. dissertation, Department of Engineering, University of Cambridge, 1995. K. Glover, and AP. Dowling, Control of combustion oscillations via H∞ loop shaping, μ-analysis and integral quadratic constraints, Automatica, Vol. 39 (Issue 2): 219-31, 2003. M. Green, D.J.N. Limebeer, Linear Robust Control (PrenticeHall, 1995). T.T. Georgiou, and M. Smith, Optimal Robustness in the Gap Metric, IEEE Transactions on Automatic Control, Vol. 35 (Issue 6):673-686, 1990. O. Galan, J. A. Romagnoli, A. Palazoglu, and Y. Arkun, Gap metric concept and implications for multilinear model-based controller design, Industrial Engineering Chemical Research, Vol. 42 (Issue 10): 2189-2197, 2003. M. Green, K. Glover, D. Limebeer, and J.C. Doyle, A J-spectral factorization approach to H∞ control, SIAM J. of Control and Opt., Vol. 28 (Issue 6):1350-1371, 1990. J. Jayender, RV. Patel, S. Nikumb, M. Ostojic, H∞ loop shaping controller for shape memory alloy (SMA) actuators, In: Proceedings of the 44th IEEE Conference on Decision and Control and European Control Conference, Seville, pp. 653-658, Spain, Dec 12-15, 2005. S. Kaitwanidvilai, and M. Parnichkun, Genetic algorithm-based fixed-structure robust H∞ loop shaping control of a pneumatic servo system, J. Robot Mechatron, Vol. 16 (Issue 4): 362-73, 2004. D. McFarlane, and K. Glover, A Loop Shaping Design Procedure Using H∞ Synthesis, IEEE Transactions on Automatic Control, Vol. 37 (Issue 6):759-769, 1992. D. McFarlane, and K. Glover, Robust Controller Design Using Normalized Coprime Factor Plant Descriptions, Vol. 138 of Lecture Notes in Control and Information Sciences, Springer-
Authors’ information Laboratory of Automatic Control, Signal and Image Processing (ATSI), National Engineering School of Monastir (ENIM), 5000, Monastir, Tunisia. Ali Ameur Haj Salah was born in 1977. He received a Master’s degree in 2005 from the faculty of sciences of Monastir (FSM), Tunisia. He is currently preparing the PhD degree in Electrical Engineering in the National Engineering School of Monastir (ENIM), at the laboratory of Automatic Control, signal and Image Processing (ATSI). His research is related to modeling, identification and control of linear and nonlinear system. Tarek Garna was born in 1978. He received a Master’s degree from the National Engineering School of Monastir (ENIM), in 2003 and the Ph.D. degree in Automatic Control from the ENIM, in 2009. He is presently assistant Professor at the Higher Institute of Applied Sciences and Technology of Sousse (ISSATSO) and a member of the laboratory ATSI. Hassani Messaoud was born in 1959. He received a Master’s degree in Electrical Engineering and the Ph.D degree in Automatic Control from the High Normal School of Techniques Education of Tunisia in 1985. In 2001, he received the ability degree from the National School of Engineers of Tunisia. He is presently Professor in the National Engineering School of Monastir (ENIM) and Director of the laboratory ATSI. He has been the supervisor of several PhD theses and he is author or co-author of several Journal articles.
Copyright © 2013 Praise Worthy Prize S.r.l. - All rights reserved
International Review of Automatic Control, Vol. 6, N. 6
780
1974-6067(201311)6:6;1-S Copyright © 2013 Praise Worthy Prize S.r.l. - All rights reserved