Automatic Segmentation and Measurements of Gestational Sac Using Static B-Mode Ultrasound Images Dheyaa Ahmed Ibrahim1, Hisham Al-Assam1, Hongbo Du1, Jessica Farren2, Dhurgham Al-karawi1, Tom Bourne2, Sabah Jassim1 1 Department of Applied Computing, University of Buckingham, Buckingham, UK. 2 Department of Early Pregnancy, Imperial College, Queen Charlotte's and Chelsea Hospital, London, UK. (
[email protected]), (
[email protected]) ABSTRACT Ultrasound imagery has been widely used for medical diagnoses. Ultrasound scanning is safe and non-invasive, and hence used throughout pregnancy for monitoring growth. In the first trimester, an important measurement is that of the Gestation Sac (GS). The task of measuring the GS size from an ultrasound image is done manually by a Gynecologist. This paper presents a new approach to automatically segment a GS from a static B-mode image by exploiting its geometric features for early identification of miscarriage cases. To accurately locate the GS in the image, the proposed solution uses wavelet transform to suppress the speckle noise by eliminating the high-frequency sub-bands and prepare an enhanced image. This is followed by a segmentation step that isolates the GS through the several stages. First, the mean value is used as a threshold to binarise the image, followed by filtering unwanted objects based on their circularity, size and mean of greyscale. The mean value of each object is then used to further select candidate objects. A Region Growing technique is applied as a post-processing to finally identify the GS. We evaluated the effectiveness of the proposed solution by firstly comparing the automatic size measurements of the segmented GS against the manual measurements, and then integrating the proposed segmentation solution into a classification framework for identifying miscarriage cases and pregnancy of unknown viability (PUV). Both test results demonstrate that the proposed method is effective in segmentation the GS and classifying the outcomes with high level accuracy (sensitivity (miscarriage) of 100% and specificity (PUV) of 99.87%). Keywords: Ultrasound image segmentation, Gestational Sac, Miscarriage cases identification, Speckle noise reduction.
1. INTRODUCTION Medical imaging systems play a significant role in modern medicine by using automatic and semi-automatic algorithms to perform image analysis with high levels of accuracy and speed. There are different imagery machines that are used to assist diagnosis of human diseases, such as tumour detection. The objective of such a device is to provide an image of the human body’s internal organs in a way that accurate and non-invasive. The sonogram is one such device that works by sending a high-frequency sound waves through the tissue of the target part of the body and receiving back the sound waves reflected via the transducer. These waves are then turned into electric impulses which in turn produce an image of the internal organ on a computer screen. Ultrasound imagery has been widely used for a long time because this imaging modality of imagery is non-intrusive and safe if it is used correctly [1]. Consequentially, ultrasound scanning is frequently used throughout pregnancy for monitoring the health and growth of the pregnancy. Miscarriage is the most common complication in pregnancy. Approximately 1 out of every five pregnancies are lost before 24 weeks, mostly before 12 weeks (first trimester) [1]. Evaluations of gestation during the first trimester usually confirm the presence and the number of pregnancies, location of the gestational sac (GS) and well-being of the embryo. The size of the GS gives an indication of the likely gestational age of an early pregnancy. It may also give an indication,
Mobile Multimedia/Image Processing, Security, and Applications 2016, edited by Sos S. Agaian, Sabah A. Jassim, Proc. of SPIE Vol. 9869, 98690B · © 2016 SPIE CCC code: 0277-786X/16/$18 · doi: 10.1117/12.2224514 Proc. of SPIE Vol. 9869 98690B-1 Downloaded From: http://proceedings.spiedigitallibrary.org/ on 05/24/2016 Terms of Use: http://spiedigitallibrary.org/ss/TermsOfUse.aspx
or diagnosis, of the viability of the pregnancy. If a large, empty GS is found (>25mm) a diagnosis of miscarriage can be made. Dimensions close to this are also concerning for miscarriage. If a GS is smaller than expected according to the gestational age calculated by last menstrual period (LMP), this may also be indicative or diagnostic of a miscarriage [2]. The Mean Sac Diameter (MSD) is used to measure the size of GS. MSD is calculated from the three diameters of the GS obtained manually from static ultrasound images in sagittal and transverse planes [3]. The manual process involves multiple subjective decisions when the three diameter measurements on the GS are taken. The personal decisions may lead to inter- and intra-observer variations which may eventually result in errors in diagnosis (which is clearly unacceptable in the case of miscarriage, as it could lead to inadvertent termination of a healthy pregnancy), and hence requires a large margin of safety in the diagnostic criteria chosen [4]. Such margins of safety necessarily result diagnostic delays – which may be emotionally difficult for a woman and her partner. There is thus significant value in providing support tools to help increase diagnostic accuracy. A computer-based system for classification of ultrasound images could serve the purpose of such a decision support tool for the diagnosis of pregnancy cases. A computer-based system is an interdisciplinary technology that combines image processing techniques and expert’s domain knowledge for improved accuracy of detection, reducing the false negative/false positive rates and improving sensitivity and specificity. In this paper, we propose an automatic system to segment the sac and measure the diameters of the segmented sac. The system can be divided into various stages. Firstly, ultrasound images are taken through a speckle noise reduction process that outputs clearer images. Secondly, a binary representation of the cleaned image is produced. Then, the binarized image undergoes a filtering process that filters out irrelevant objects and correctly selects the binary image of GS. Finally, accurately segmented GS image is sent to the feature extraction stage to obtain the three measurements of the GS size.
2. BACKGROUND AND LITIRITURE REVIEW The first indication of a pregnancy is a missed menstrual period. Consequently, the woman usually performs a urine pregnancy test. Blastocyst cells start growing during the first three weeks contributing to the formation of the GS as the first sign and measurable element of early pregnancy in scanning terms, usually visible at 28 – 31 days from LMP. An early miscarriage occurs before 12 weeks and a late one between 13 to 24 weeks. A miscarriage occurs when the embryo stops developing and the GS stops growing as usual. Most miscarriages are the result of a chromosomal fault within the cells of the developing pregnancy. Miscarriages are quite common. In the UK, the figure reaches to nearly a quarter of a million each year [1] [5]. A woman with pain, bleeding and previous miscarriage in early pregnancy is usually assessed by her GP, who may refer her to an early pregnancy unit where an ultrasound scan will be performed to assess the health of the pregnancy. One of the critical measurements is of the MSD of the GS. The MSD of GS gives an indication if the pregnancy is PUV or at risk of being a miscarriage. Extensive evidence has shown that 25mm is a safe cut-off for the diagnosis of miscarriage [2] . Previously used lower cut-offs have an unacceptable false positive rate. A false positive diagnosis of miscarriage (sensitivity) is potentially catastrophic and it may lead to the inadvertent termination of a pregnancy. By contrast, a false negative (specificity) diagnosis leads only to a delay in potential intervention where there are not enough criteria to confidently classify an intrauterine pregnancy as an early or as a failed pregnancy, which is labelled PUV case. Therefore, the diagnosis rules aim to achieve 100% specificity. For the reasons as we explained in the introduction, it is desirable to automatically segment the GS, measure the three diameters of the GS and calculate the MSD. Segmenting an ultrasound image is a critical step for identifying the regions of interest (ROI), i.e. GS. However, speckles in an ultrasound image, i.e. the noisy and textured background caused by sound wave reflection and scattering within the tissue, can significantly degrade the image, making successful
Proc. of SPIE Vol. 9869 98690B-2 Downloaded From: http://proceedings.spiedigitallibrary.org/ on 05/24/2016 Terms of Use: http://spiedigitallibrary.org/ss/TermsOfUse.aspx
segmentation of ROI very difficult. It is therefore important to enhance images and reduce the effects of the speckle noises in order to prepare a cleaner image for segmentation. Speckle noise is multiplicative and non-Gaussian which affects the high-frequency areas of the image. Such noise is generally more difficult to remove than additive noise, because the intensity of the noise varies in terms of image intensity. A model of multiplicative noise [6] [7]is given by:
𝐽(𝑖, 𝑗) = 𝐼(𝑖, 𝑗) ∗ 𝑁(𝑖, 𝑗)
(1)
Where the speckled image J is the product of the original image I and a non-Gaussian Noise N. Speckle noise reduces the image contrast and resolution details, degrades tissue textures, and decreases the visibility of small contrast and resolution and makes continuous structures appear discontinuous [7]. Therefore, these primary factors limit the effective application of image processing and image analysis. Many techniques in the existing literature for speckle noise reduction involve using filters such as Wavelet filter, median filter, adaptive weighted median filter and Fourier transform [8] [9] [10] [11] [12]. Over the last decade, many trials and research have been published in ultrasound medical image analysis. In [13], an automated system was proposed to measure the gestation sac size, based on different techniques and use these measurements to predict the age of GS and estimate the due date. In [14], Ling Zhang et al. they proposed a novel methodology to measure the diameter of the early gestational sac in 2D ultrasound video. This approach includes four principal components, training, Detection, indexing and measurement [5] [1]. These papers proposed a new framework for automatic identification of miscarriage cases using new signs to support diagnosis decisions. However, there is no fully automatic identification of signs of miscarriages in early pregnancies using ultrasound images due to the difficulty in automatic segmentation of ROI. On the contrary, segmentation of ROI is normally achieved with manual or semimanual methods. As far as we are aware, this paper is the first to propose a fully automatic framework that does not require any human intervention.
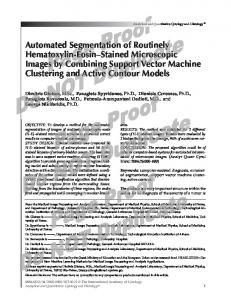
3. THE PROPOSED FRAMEWORK A computer-based system to extract and classify the gestational sac could serve the purpose of a decision support tool for the diagnosis of early miscarriage cases. Such a computer-based system is an interdisciplinary technology combining image processing techniques and experts’ knowledge to improve the accuracy of PUV and miscarriage detections, thus greatly reducing the false negative and false positive rates and improving the sensitivity and specificity. An automatic diagnosis of early miscarriage based ultrasound images is challenging for the following reasons. 1. Depth variation and intervening tissue that is non-homogenous. 2. Speckle noise is a texture noise that can vary depending on the specific characteristics of the biological tissue. This can significantly affect the quality of the ultrasound image. 3. Often, ROI can border other regions with very little contrast, making it difficult to detect. To overcome this limitation, researchers may need to apply some specific assumptions about the ROI. However, these assumptions may not necessarily be true, and this must be taken into consideration when analysing the image. 4. Interpretations of the ultrasound image may also differ between experts. This phenomenon is referred to as inter-observer variability. 5. The same expert may interpret the same ultrasound image differently at different occasions. This may lead the same expert to have a different interpretation of the same ultrasound image. This is referred to as intra-observer variation [7]. Simple solutions do not usually work effectively. Therefore, we are proposing the following multi-stage framework. The process can be divided into six main stages as presented in Figure 1.
Proc. of SPIE Vol. 9869 98690B-3 Downloaded From: http://proceedings.spiedigitallibrary.org/ on 05/24/2016 Terms of Use: http://spiedigitallibrary.org/ss/TermsOfUse.aspx
Input Image Image Enhancement (Speckle Denoise) segmentation High Layer
Image Understanding
Image Segmentation
Middle Layer
Image Analysis
Filtering out non Sac Object
Accurate Sac Segmentation
Low Layer
Image Processing
Feature Extraction on the Segment Sac
Classification (Miscarriage or PUV)
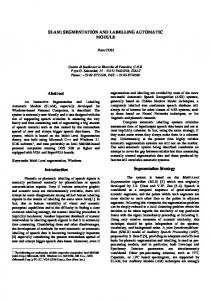
Figure 1: General framework for the automatic diagnosis of the GD Figure 2 illustrates in detail the proposed framework for automatically segmenting and measuring the MSD of the GS from a static B-mode image for identification of miscarriage cases by exploiting the GS’s geometric features. To accurately locate the GS in the image, the proposed solution uses wavelet transformation to suppress the speckle noise by eliminating the high-frequency sub-bands and preparing an enhanced image. This is followed by a segmentation step that isolates the GS through the following stages. First, the mean value is used as a threshold to binarize the image followed by filtering out unwanted objects based on their geometric features. A Region Growing is applied as post-segmentation to identify the GS finally.
Proc. of SPIE Vol. 9869 98690B-4 Downloaded From: http://proceedings.spiedigitallibrary.org/ on 05/24/2016 Terms of Use: http://spiedigitallibrary.org/ss/TermsOfUse.aspx
Step 1
A
B
Start
D
C
GS Ultrasound Image
Applied active contour Separate the image (two side)
Region Growing
Number of Iteration Segmentation methods
Enhancement (Speckle nose
Accurate sac segmentation
reduction)
Morphology operation
Image segmentation ( Mean cut off value)
1
2
1
2
Objects features extraction
Filtering out non sac objects based on object features
Select random pixel inside the right sac
Select the right sac based on features Accurate sac segmentation methods
Check the tow sac on the same line
Measure the mean as threshold for the box
Figure 2: Fully Automatic Segmentation System The following subsections explain the details of every stage of the proposed automatic GS segmentation solutions.
3.1. Image Enhancement It is necessary to enhance the ultrasound images to reduce the speckle noise while retaining the salient tissue boundaries in the image. The purposes of this stage are, to accurately locate structure boundaries, better visualize the position of structures, and to quantify morphology. There are several publications that refer to speckle noise as the major challenge in analysing and segmenting ultrasound images where the underlying techniques are based on the objective of preprocessing [5] [1] [6] [8]. In this work, the wavelet transform is used to reduce the speckle noise. The wavelet transform approach is based on eliminating bands in a single decomposition level with at least one high-frequency component (HL, LH and HH) (see Figure 3). Theoretically, these high-frequency bands, especially the HH band, contain more noises. By closely examining the images, we can see that in the images processed with HL and HH bands appears some white spots that are not in the original image, so this fact deteriorates the metric results. On the other hand, we know that the band LH contains high frequency for horizontal edges, and the tested image has more vertical edges than horizontal (although most of the lines are diagonal), so if we remove this band we remove a lot of noises but not much related to edge information.
Proc. of SPIE Vol. 9869 98690B-5 Downloaded From: http://proceedings.spiedigitallibrary.org/ on 05/24/2016 Terms of Use: http://spiedigitallibrary.org/ss/TermsOfUse.aspx
Different wavelet levels have been tested to establish in which level of decomposition we can remove the speckle noise and still maintain the sac image. As shown in Figure 3, when the GS is small. we can see that the best resulting image is generated at level 3 where the contrast between the sac and background is very high. At level 4, however, we noticed that the sac image is almost disappeared. Similar observations have been made upon other images.
Band Eliminated =HH
Band Eliminated =HL
Band Eliminated =HH & HL
Band Eliminated =LH
Level 1
Level 2
i
Level 3
al...4_.
'vie -4'
;
,,aA7,_
i
4tbiint
1
Level 4
Figure 3: Evaluate the wavelet filter with different levels
3.2. Image Segmentation There are various segmentation techniques used to extract the object from the image such as region-based segmentation, edge-based segmentation, clustering techniques, and threshold-based segmentation [15] [16]. Such techniques do not work well on most ultrasound images because of the huge variations among intensity values from one image to other. Therefore, we proposed a new technique based on a threshold and some geometric features to extract the GS. The stages used to segment the whole sac are explained in the following subsections. A. Image Binarisation
The mean value of the image is used as a threshold. This threshold is adaptive, as it changes depending on the intensity level of the image. This technique is not usually enough to accurately extract the gestational sac because the quality of the segmentation is critical to accurately measure the diameters of the GS. By analysing the threshold outputs, one can
Proc. of SPIE Vol. 9869 98690B-6 Downloaded From: http://proceedings.spiedigitallibrary.org/ on 05/24/2016 Terms of Use: http://spiedigitallibrary.org/ss/TermsOfUse.aspx
identify two limitations. Firstly, each image has a number of binary objects beside the GS. Secondly, sometimes the binary image does not have the whole area of the GS. Therefore, the next steps are proposed to address these limitations. B. Morphology Operation
After applying thresholding to produce a binary image, which consists of the gestational sac as a white region with a large number of other objects, morphology operations were performed to remove small objects. C. Filtering Out NonSac Object
The main challenge here is that when we applied thresholding, there are some binary objects that look like the sac, Therefore, the fully automated system needs to filter out those non-sac objects to extract the sac based on circularity, area, and the mean of greyscale(see Figure 4). Figure 5 illustrates the result of each step in GS segmentation.
Features
Object 1
Object 2
Object 1
Object 2
Circularity
×
√
Object area
×
√
Object mean of grayscale value
×
√
Figure 4: Shows the features of Filtering out Non Sac Object step
a
b
c
d
s
% " e
f
g
Figure 5: GS segmentation steps (a) original image (b) cropped 70 pixels (C) enhanced image (d) separated both side (e) threshold output (f) clean image (g)Filtering Out NonSac Object.
Proc. of SPIE Vol. 9869 98690B-7 Downloaded From: http://proceedings.spiedigitallibrary.org/ on 05/24/2016 Terms of Use: http://spiedigitallibrary.org/ss/TermsOfUse.aspx
D. Accurate Sac Segmentation
The output of the previous stages is an approximate location of the GS. In this stage, this location is used as a seed point for other segmentation techniques to have the whole sac (see Figure 6). The active contour [17] [18] or Region Growing [19] are used in this stage as a post-segmentation to extract the sac with correct boundary.
a. Gestational Sac
b. segmentation output
c. accurate sac segmentation
Figure 6: Accurate sac segmentation output Active contour: The proposed system used two type of active contour. Firstly, the active contour used single seed point with a high number of iterations. Therefore, this technique takes a long time to find the border of the object. Secondly, we used active contour based on the largest mask by detecting two points around the sac. This idea has decreased the number of iterations, and the active contour will grow from the outside of the sac based on the mask. Region Growing: is an image segmentation method which is based on the initial starting point. The main idea of this approach classifies the pixel based on the grayscale value of the starting point with the neighbouring pixels of initial to check the difference. This difference is used as a value to determine whether the pixel neighbours should be added to the region. The ultrasound image is a grayscale image. The grayscale value of this image is from 0 to 255. The reason we apply Region Growing on this image is to mark the gestational part of the image and the result to be connected without being split apart. Therefore, we have to select the seed point that is a part of the sac as an initial point for this technique (see Figure 7). After determining the seed points, we have to detect the appropriate threshold value. The first point (grayscale value) compare with 8 connected to check the difference. If the difference is less than the threshold, the pixel will label as part of sac else save the same gray value of the pixel. For example, if we set the value of threshold wider, it will result in a bigger region. In this technique, we used the flexible grayscale value for a starting point. That means when the system moves from one pixel to the next, the gray value of starting point will update using the mean of labelled pixels for the next step.
Proc. of SPIE Vol. 9869 98690B-8 Downloaded From: http://proceedings.spiedigitallibrary.org/ on 05/24/2016 Terms of Use: http://spiedigitallibrary.org/ss/TermsOfUse.aspx
OO O O O
O O O O O OO O O O
O O O O O OO O O O
O O O O
oo o
oo o
oooo oo o oo o
oo
oo o
r
o oo o
oo
oo
o ooo
o oooo oo oo o
o oooo oo oo o
0 0o
B
oooo oo oo oo
00
o 00
h$
00 o
OÑE Ó
a s
0 0O
V
OO OO
P
$
00 oo
s r. Ñ b s
A OO OO
O r ss
OO OOOO OO OO
OO ÑO
O
00 0000 00 00
N
r
O
Wb
M
i
á ó 0 . ó Ñ P F. b
O O O O O OO O O O
OÓ
O O O O O OO O O O
OO O O OO O O O
á áb
O O O O O OO O O O
O
P0
G
C
D
Figure 7: Region growing process. (A) grayscale Image (B) marked matrix (output image)(C) first process using the starting point 8 and threshold 10 (D) the second process using update starting point (mean of labelled pixel)
3.3. Sac Estimation In some cases, we can extract the sac with only the image taken from one plane. Therefore, we proposed a new step to estimate the sac in the second plane. To understand the idea behind the step two (sac estimation) in Figure 2, we need to briefly explain the process of capturing the ultrasound images. Gynaecologists usually scan the region of interest in different probe angles by inserting the probe into the uterus. They scan the image in the sagittal plane of the uterus. Then, they change the probe angle by 90 degrees to capture the image in the transverse to takes the third diameter measurement. Some Gynaecologists use the convenience which is the two sacs will be aligned on the same horizontal line. Therefore, we used this observation to improve the algorithm but we cannot use this assumption always. We exploit this feature as a condition for segmentation to check if the output of the first step of the segmentation (the two GS) is on the same line or not. If it’s not, the system will use some geometric features to decide which one is the sac; otherwise, we use one of the two sacs to estimate the location of the other. The system will draw a rectangle around the right sac and use the same triangle to estimate the other sac by setting the mean threshold for this rectangle.
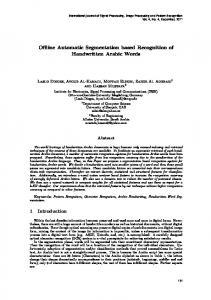
3.4. Feature Extraction As explained earlier, each image we processed in this study contain two sac images taken from two planes (sagittal and transverse). The GS in each plane usually appears more elliptical. Therefore, the proposed system applies the best fitting ellipse for the segmented GS in each plane. Major and Minor axes are measured based on the ellipse as shown in Figure 8. Assuming the GS has an ellipsoidal shape in 3D, the three principal axes of the ellipsoid can be estimated by the major axis, the minor axis of the ellipse from the sagittal plane, and the major axis from the transverse plane. MSD is simply the average of these three principal diameters.
D1 D2
D3
Figure 8: MSD measurement
Proc. of SPIE Vol. 9869 98690B-9 Downloaded From: http://proceedings.spiedigitallibrary.org/ on 05/24/2016 Terms of Use: http://spiedigitallibrary.org/ss/TermsOfUse.aspx
4. EXPERIMENTS AND RESULTS In this study, GS ultrasound images are provided by the Early Pregnancy Department, Queen Charlotte’s and Chelsea Hospital, Imperial College, London. The dataset contains 184 ultrasound images in total, 157 PUV and 27 miscarriage cases. Each image was captured from two planes (transverse and sagittal for GS). To test the effectiveness of the proposal, we evaluated its performance at three different stages:
Assess the accuracy of the segmentation stage. Compare the automatic measurements with the manual ones generated by a domain expert. Evaluate the accuracy of the automatic MSD measurements in identifying the early miscarriage cases.
The experiments used to evaluate the proposed system are explained in the following subsections. 4.1. Segmentation Result Human Visual System (HVS) is used to manually calculate the percentage of successful segmentation of the GS. We found that 150 out of 184 images gestational sac were accurately segmented with and 34 images unsuccessful. Therefore, the segmentation rate of GS for this method is around 81.52%. By contrast, this rate increased to 89.67% when a line assumption (GS estimation) was used as a step for this method. To provide a proper evaluation of the system in following stages, we excluded all images that were unsuccessfully segmented. 4.2. Comparison manual and automatic MSD measurements To evaluate the proposed algorithm and illustrate its effectiveness, the automatic measurements were compared with manual measurements of MSD provided by a domain expert. Figure 9 shows the correlations between the automated and manual MSDs. As the angle of the regression line is very close to 45 degree, the figure confirms that the values of automatic MSDs are very accurate. 50 45
automatic measurements
40 35 30 25 20 15 10 5 0 0
10
20
30
40
50
manual measurements
Figure 9: Comparison manual and automatic MSD measurements
Proc. of SPIE Vol. 9869 98690B-10 Downloaded From: http://proceedings.spiedigitallibrary.org/ on 05/24/2016 Terms of Use: http://spiedigitallibrary.org/ss/TermsOfUse.aspx
4.3. Classification Results This section illustrates the results of two sets of experiments for evaluating the proposed method. In the first set of experiments, we gave PUV and miscarriage cases an equal weight in the training set using a sampling strategy is used as follows. In each round, we randomly selected 20 images of PUV and 20 images of miscarriage cases to form a training sample. We repeated the test 50 times where in each round, two images are used for testing and 38 images are used as training. In each round, K-folds cross validation was used to calculate the accuracy, sensitivity, and specificity where the average value of the K-fold is finally reported. In the second set of the experiment, we have used single splite testing stratigy by randomly selecting 33% from each class (PUV and Miscarriage) of the dataset to form a testing sample and the remaining 66% of each class to form a training sample. This was then repeated 50 rounds and the average accuracy, sensitivity, and specificity was reported. The KNN classifier is used to evaluate the effectiveness and accuracy of the proposed segmentation method based on the MSD features. The KNN classifier determines the class of a testing image by calculating the distance between the testing image’s features and that of each sample in the training set. Figure 10 shows that an overall average accuracy of 98.70% with sensitivity (miscarriage) of 100% and specificity (PUV) of 94% for can be achieved in the first set of the experiment. By contrast, an overall accuracy of 99.89% with sensitivity of 100% and specificity of 99.87% was achieved in the second experiment as shown in Figure 10. The results confirm that the second set of the experiment give a better diagnostic model that is closer to the result seen from clinical practice.
101 100 99 98 97 96 95 94 93 92 91 accuracy
sensitivity
specificity
First set of experments
accuracy
sensitivity
specificity
Second set of experments
Figure 10: Comparison of miscarriage clasification accuracy, sensitivity and specificity based on MSD.
5. CONCLUSIONS This paper investigated the closely related issues of speckle noise, segmentation and the classification accuracy of automatic identification of miscarriage cases using ultrasound images systems. The aim of this paper is to understand the effect of speckle noise on the automatic segmentation, diagnoses, and to use the gained knowledge to design fully automatic framework for accurate segmentation and classification of early miscarriage cases. The segmentation was divided into two stages. Firstly, initial segmentation of the sac was performed after removing the unwanted object based
Proc. of SPIE Vol. 9869 98690B-11 Downloaded From: http://proceedings.spiedigitallibrary.org/ on 05/24/2016 Terms of Use: http://spiedigitallibrary.org/ss/TermsOfUse.aspx
on geometric features. Secondly, a refinement stage was used to accurately identify the whole sac by applied the Region Growing that allowed the system to increasing the segmentation accuracy. The paper then presented experimental results at different stages of the proposal to illustrate its effectiveness. The MSD is used as a surrogate measurement as it is the only measurement or ‘gold standard’ that is available– and that, actually, it is likely that sac circumference or volume would be better. In the future, we would plan to assess according to ultimate diagnosis, but this will require a much larger number of cases. The design of the study prevents automatic analysis from the out-performing human analysis because the manual diagnoses have in-built large margins of error. In addition, the future work includes investigating the impact of other image-based signs (features) such as features capturing the border characteristics of the GS, as well as external descriptors, such as previous miscarriage and age. Moreover, segmentation and classification of other types of miscarriage cases such as GS with Yolk will be investigated next.
ACKNOWLEDGEMENTS The first author wishes to thank the Higher Committee for Education Development in Iraq for funding his PhD study.
REFERENCES [1] S. Khazendar, H. Al-Assam, T. Bourne and S. A. Jassim, "Automatic Identification of Early Miscarriage Based on Multiple Features Extracted From Ultrasound Images," 2014. [2] J. Preisler, J. Kopeika, L. Ismail, V. Vathanan, J. Farren, Y. Abdallah, P. Battacharjee, C. Van Holsbeke, C. Bottomley, D. Gould and others, "Defining safe criteria to diagnose miscarriage: prospective observational multicentre study," 2015. [3] "Ectopic pregnancy and miscarriage: diagnosis and initial management," National Institute for Health and Care Excellence (NICE) of Ectopic Pregnancy and, 2012. [Online]. [Accessed 2015]. [4] A. Pexsters, J. Luts, D. Van Schoubroeck, C. Bottomley, B. Van Calster, S. Van Huffel, Y. Abdallah, T. D'Hooghe, C. Lees, D. Timmerman and others, "Clinical implications of intra-and interobserver reproducibility of transvaginal sonographic measurement of gestational sac and crown--rump length at 6-9 weeks' gestation," Ultrasound in obstetrics \& gynecology, vol. 38, no. 5, pp. 510-515, 2011. [5] S. Khazendar, J. Farren, H. Al-Assam, H. Du, A. Sayasneh, T. Bourne and S. Jassim, "Automatic Identification of Miscarriage Cases Supported by Decision Strength Using Ultrasound Images of the Gestational Sac," 2015. [6] S. Wu, Q. Zhu and Y. Xie, "Evaluation of various speckle reduction filters on medical ultrasound images," in Engineering in Medicine and Biology Society (EMBC), 2013 35th Annual International Conference of the IEEE, 2013. [7] C. P. Loizou, "Ultrasound image analysis of the carotid artery," 2005. [8] J. L. Mateo and A. Fernandez-Caballero, "Finding out general tendencies in speckle noise reduction in ultrasound images," Expert systems with applications, vol. 36, no. 4, pp. 7786-7797, 2009.
Proc. of SPIE Vol. 9869 98690B-12 Downloaded From: http://proceedings.spiedigitallibrary.org/ on 05/24/2016 Terms of Use: http://spiedigitallibrary.org/ss/TermsOfUse.aspx
[9] C. P. Loizou, C. S. Pattichis, C. Christodoulou, R. S. Istepanian, M. Pantziaris, A. Nicolaides and others, "Comparative evaluation of despeckle filtering in ultrasound imaging of the carotid artery," Ultrasonics, Ferroelectrics, and Frequency Control, IEEE Transactions on, vol. 52, no. 10, pp. 1653-1669, 2005. [10] K. Karthikeyan and C. Chandrasekar, "Speckle noise reduction of medical ultrasound images using Bayesshrink wavelet threshold," International Journal of Computer Applications, vol. 22, no. 9, pp. 814, 2011. [11] H. Rabbani, M. Vafadust, P. Abolmaesumi and S. Gazor, "Speckle noise reduction of medical ultrasound images in complex wavelet domain using mixture priors," Biomedical Engineering, IEEE Transactions on, vol. 55, no. 9, pp. 2152-2160, 2008. [12] Y. Anqing, "Research on image filtering method to combine mathematics morphology with adaptive median filter," 2010. [13] V. Chakkarwar, M. S. Joshi, P. S. Revankar and others, "Automated analysis of gestational sac in medical image processing," pp. 304-309, 2010. [14] S. C. S. L. T. W. Ling Zhanga, "Automatic Measurement of Early Gestational Sac diameters from One Scan Session," 2011. [15] Q. Wu, F. Merchant and K. Castleman, Microscope image processing, Academic press, 2010. [16] L. Lucas, "Image Segmentation," Technische Universitat Munchen, 2010. [17] Y.-J. Chiu, V.-T. Pham, T.-T. Tran and K.-K. Shyu, "Evaluation of active contour on medical inhomogeneous image segmentation," in Computer Science and Information Technology (ICCSIT), 2010 3rd IEEE International Conference on, 2010. [18] J. S. Athertya and G. S. Kumar, "Automatic initialization for segmentation of medical images based on active contour," in Biomedical Engineering and Sciences (IECBES), 2014 IEEE Conference on, 2014. [19] R. C. Gonzalez, R. E. Woods and S. L. Eddins, "Digital image processing using MATLAB," 2009. [20] B. Cox, "Acoustics for Ultrasound Imaging," Lecture Notes, University College London, 2012. [21] A.-S. Adolfsson, "Miscarriage: Women’s experience and its cumulative incidence," Linköping University Medical Dissertations, No. 939, 2006. [22] "National Institute for Health and Care Excellence (NICE) of Ectopic Pregnancy and Miscarriage. Diagnosis and initial management in early pregnancy of ectopic pregnancy and," [Online].
Proc. of SPIE Vol. 9869 98690B-13 Downloaded From: http://proceedings.spiedigitallibrary.org/ on 05/24/2016 Terms of Use: http://spiedigitallibrary.org/ss/TermsOfUse.aspx