Content: A Case Study with Logo and Trademark. Images. Evdoxios Baratis, Euripides G.M. Petrakis, Member, IEEE, and Evangelos Milios, Member, IEEE.
Automatic Web Site Summarization by Image Content: A Case Study with Logo and Trademark Images Evdoxios Baratis, Euripides G.M. Petrakis, Member, IEEE, and Evangelos Milios, Member, IEEE
Abstract— Image-based abstraction (or summarization) of a Web site is the process of extracting the most characteristic (or important) images from it. The criteria for measuring the importance of images in Web sites are based on their frequency of occurrence, characteristics of their content and Web link information. As a case study, this work focuses on logo and trademark images. These are important characteristic signs of corporate Web sites or of products presented there. The proposed method incorporates machine learning for distinguishing logo and trademarks from images of other categories (e.g., landscapes, faces). Because the same logo or trademark may appear many times in various forms within the same Web site, duplicates are detected and only unique logo and trademark images are extracted. These images are then ranked by importance taking frequency of occurrence, image content and Web link information into account. The most important logos and trademarks are finally selected to form the image-based summary of a Web site. Evaluation results of the method on real Web sites are also presented. The method has been implemented and integrated into a fully automated image-based summarization system which is accessible on the Web1 . Index Terms— Category: H.3.1 Information Storage and Retrieval, Content Analysis and Indexing (Abstracting methods, Indexing methods) Category: I.5.4 Pattern Recognition, Applications (Computer Vision) Terms: Performance, Experimentation, Algorithms Keywords: Web Site Summarization, Logo, Trademark, Feature Extraction, Machine Learning
Images are used to enhance the information content of Web pages, to capture the attention of users or to reduce the textual content of Web sites. In many scientific, artistic, technical, or corporate Web sites, images comprise the majority of digital content and are characteristic of the content and type of these Web sites. Despite the great significance of images in realizing Web contents, image-based summarization approaches of Web sites have not been proposed in the literature. Augmenting textbased with image-based summarization could lead to more comprehensive summaries and allow for more effective Web browsing and retrieval. Image-based summarization requires that content descriptions be extracted from Web images and used to determine the importance of images. However, general purpose image analysis approaches for extracting meaningful and reliable descriptions for all image types are not yet available. To achieve consistency of image content representation and high quality results, imagebased summarization need to be geared towards specific image types. For this, we choose the problem of logo and trademark images as a case study for the evaluation of the proposed methodology. The reasons for the selection of this image type are: •
•
I. I NTRODUCTION
T
HE World Wide Web (WWW) has grown substantially in recent years. At the same time, Web sites have grown in size and have become more complex in content and structure so that it is often difficult to skim over their contents. Web site abstraction (or summarization) provides a means for fast and efficient Web browsing and retrieval. The goal of abstraction is to produce coherent summaries that are as good as human authored summaries. This allows for faster and better understanding of the contents of a Web site without first browsing through its content. Text abstraction (or summarization) in particular produces a concise summary of a Web site by extraction of important phrases or sentences appearing in the Web site using statistical approaches [1], linguistic approaches [2] or combination of the two [3]. Evdoxios Baratis and Euripides G.M. Petrakis are with the Department of Electronic and Computer Engineering,Technical University of Crete (TUC), Chania, Greece . Evangelos Milios is with the Faculty of Comp. Science, Dalhousie University,Halifax, Nova Scotia, Canada. 1 http://www.intelligence.tuc.gr/websummarization
•
Logos and trademarks are important characteristic signs of corporate Web sites or of products presented there. A recent contribution [4] reports that logos and trademarks comprise 32,6% of the total number of images on the Web. Image-based summarization of logo and trademarks is of significant commercial interest (e.g., Patent Offices provide services on detection of unauthorized uses of logos and trademarks). Logo and trademark images are easier to describe by low level image features (such as those used in this work) than other types of images, such as photographs. Therefore it is easier to extract reliable content descriptions and construct accurate image summaries.
To properly categorize images on the Web, filters based on machine learning by decision trees [5] for distinguishing logo and trademark images from images of other categories (e.g., photographs) are designed and implemented. The images of a Web site are then ordered by importance and only the most important images are included in the summaries. Appropriate importance criteria are defined based on the frequency of appearance of an image in a Web site, its content and its position in the Web site hierarchy. Because multiple instances of the same image may appear many times in a Web site in different forms (i.e., different sizes, illumination, colors or even processed and combined with different background) the method groups similar or duplicate
images together (based on appropriate similarity criteria and matching algorithms) so that only one instance of each image is included in the summary. This process is fully automated, extensible for more image types (provided that suitable content descriptors and matching algorithms are available for the image types) and scalable (i.e., works even for large Web sites). The contributions of the proposed work are the following: • We introduce the concept of image-based summarization for improving the quality of Web site summaries and as a tool for more effective Web browsing and retrieval. • A fully automated image-based summarization approach is proposed. The method is based on machine learning and image analysis for selecting the most characteristic images of a Web site. Appropriate criteria for measuring the importance of images in Web sites are proposed based on their frequency of occurrence, characteristics of their content and Web link information. • The evaluation of the method on corporate web sites is presented. This is a very important application in itself aiming at creating summaries consisting of important logos and trademarks. • The proposed method has been implemented and integrated within a complete automated Web site image summarization system. The system is accessible on the Web2 . Existing approaches for handling logos and trademarks (e.g., [6], [7]) focus entirely on image content analysis and high precision answers to queries by image example. They neither focus on detection (i.e., discrimination between trademark and not trademark images) nor do they perform Web site abstraction (summarization) by image content. This work handles both of these issues. Recent contributions [8]–[10] on image content analysis deal with the problem of image categorization into a set of predefined categories based on training and machine learning but, neither these methods perform summarization. The rest of this paper is organized as follows: Extraction of meaningful image descriptions for logos and trademarks are discussed in Sec. II. The proposed method is discussed in Sec. III. Experimental results are presented in Sec. IV followed by conclusions in Sec. V. II. I MAGE F EATURE E XTRACTION
T
HE focus of this work is not on novel image feature extraction but on showing how to automatically extract the most characteristic logo and trademark images of a Web site for a given and well established set of features (such as those used in [6], [7]). Logos and trademarks are small size graphic images, with a limited number of distinct intensity levels and colors. In addition, logos and trademarks exhibit a lower spatial distribution of intensities than images of other categories (e.g., faces, landscapes). This information is mostly captured by grey-level intensity information rather than by color. Also, the same logo or trademark image may appear as color or grey scale image in the same Web site. For this reason, color information is not useful. In the following, all images are converted to grey scale. Image information is captured by intensity and frequency histograms. The following types of intensity and frequency histograms are computed [11]. 2 http://www.intelligence.tuc.gr/websummarization
TABLE I E XAMPLES OF LOGO AND OF NON - LOGO IMAGE AND OF THEIR INTENSITY AND FREQUENCY HISTOGRAMS .
Intensity Histogram: Shows the distribution of intensities over the whole range of intensity values ([0..255] in this work). Radial Histogram: It is computed as a histogram showing the distribution of average energy over 256 co-centric rings of the DFT spectrum (with the largest ring fitting the largest inscribed circle of the spectrum). Because DFT requires that image horizontal and vertical sizes be powers of 2, images are extended periodically both horizontally and vertically so that their dimensions become powers of 2. Pixels at (x, y) outside the original dimensions M , N take values (x mod M, y mod N ). The histogram values are normalized by the 0-th component. Angle Histogram: It represents the distribution of the power spectrum over 256 regions (wedges) of the DFT spectrum of the image defined by multiples of the azimuthal angle between −π and π . The Fourier spectrum describes an image by its frequency content. Sharp intensity changes correspond to high frequencies in the Fourier spectrum while smooth intensity changes correspond to low frequencies. Logos and trademarks (e.g., graphic images) exhibit sharp intensity variations corresponding to high frequencies in the frequency domain (Fourier spectrum). The Radial histogram measures image detail: High values in large rings correspond to fine detail. Logos and trademarks exhibit sharp intensity changes that give rise to high frequencies in the Radial histogram. The Angle histogram measures directionality of edges which usually appears in natural (e.g., outdoor) images
and photographs of man-made structures and rarely in logos and trademarks. If an image has edge texture in direction φ then high energy will be present in wedge φ + π/2. All histograms are normalized (i.e., the sum of all histogram bins equals 1). Table I illustrates examples of logo and non-logo images together with their Intensity, Radial and Angle histograms. We observe that most intensity values in the Intensity histogram of the logo image are concentrated at 255. The Radial histogram also exhibits rich high frequency content as opposed to the rich low frequency content of the non-logo image. As expected, the two images cannot be distinguished based on the content of their Angle histograms (i.e., none of the two images shows directionality of intensity changes).
Energy [14]:
Entropy [14]:
A. Image Representation Frequency and Intensity histograms are useful representations by themselves. However, a more compact representation of image content that takes advantage of the peculiarities of histograms consists of the following set of features. Represents the luminance of an imMean Value (μ): age. Logo and trademarks are usually images in light background and tend to have greater mean value (assuming large intensity values correspond to light pixels) than other types of images (e.g., outdoor images). It is � i hi where hi is computed as μ = 256 the value of the i-th histogram bin (i ∈ [0..255] for all histograms). Standard Deviation (σ ): Characterizes the variability of intensity values around their mean value. Logos and trademarks exhibit sharp intensity changes and low spatial distribution of intensity values and are characterized by large values of standard deviation. It is computed as σ = � � 2 i (i − μ) hi . Binarization Threshold: It returns an integer value that separates the pixels into dark and light regions. Otsu thresholding [12], an optimal thresholding method is applied (i.e., the thresholding problem is formulated as a discriminant analysis). Like the mean, the threshold represents the luminance of an image and takes greater values for logo and trademarks than other types of images. Skewness [13]: Characterizes the degree of asymmetry of a histogram around the mean value. It takes both positive and negative values (depending on whether the distribution extends rightwards or leftwards It is computed � respectively). � �
Kurtosis [13]:
3
hi . as i i−μ σ Measures the peakiness or flatness of the histogram (corresponding to positive and negative values� respectively) �
and is computed as
�
i
i−μ σ
4
hi −3.
Occupied bins:
The more homogeneous an image, the higher is the value of the energy. Logo and trademarks are generally characterized by large energy values (i.e., they are more homogeneous than other types images). It is computed as � 2 i hi . Measures the average bits per pixel. For 8-bit images it takes values between 0 an 7. Small entropy indicates few intensity levels or the presence of homogenous regions in the image. Therefore, logo and trademarks tend to have smaller entropy than other types of images. It is computed as � i hi log 2 hi . The number of distinct intensity levels in an image. It is measured only on Intensity histograms (i.e., frequency histograms take values that span the entire range of values for all image types). Logos and trademarks have fewer occupied bins in the Intensity histogram than images of other categories.
Table II illustrates the features of the logo and non-logo images of Table I. In addition to features of histograms, images are also represented by moment invariants [11]. These are computed as a vector of 7 moment coefficients which describes the image by its spatial arrangement of intensities. Moment invariants have been proven to be effective representations of image content for logo and trademark images [6], [7]. The vector of the features described above serves two purposes, logo-trademark detection and similarity. Logo-Trademark detection: Each image is represented by a vector of 23 features computed on histograms (7 features for each of the 3 histograms, plus image file size and number of distinct intensities in the image). Detection of logo and trademarks based on histogram features is discussed in Sec. III-B. Logo-Trademark similarity: Given that two images are logos or trademarks their similarity is computed by matching their (a) Feature vectors, (b) Vectors of moment invariants and (c) Histograms. The similarity between histograms is computed by their intersection [11], whereas the similarity of vectors (i.e., feature vectors or vectors of moment invariants) is computed by subtracting their Euclidean vector distance from the maximum value of distance. Similarity detection between logo and trademark images is discussed in Sec. III-C.
TABLE II F EATURES COMPUTED ON THE LOGO ( LEFT ) AND NON - LOGO ( RIGHT ) IMAGES OF TABLE I.
Features filesize
67.82 40.53 0.87 0.21 73 6.71 0.01 135
mean 124.31 standard deviation 65.53 skewness 0.73 kurtosis -0.75 threshold 143 entropy 6.68 energy 0.003 Angle Histogram Features
139.59 82.92 -0.56 -1.41 122 8.97 0.005
mean standard deviation skewness kurtosis threshold entropy energy
140.31 70.79 159 -0.20 187 4.28 0.002
126.42 67.34 1.53 -0.31 186 4.57 0.002
Notice that not all features are equally important for logotrademark detection or for measuring image similarity. Also, the Angle histogram might be less useful than the Intensity and Radial histogram, because edge directionality is less frequent in images. However, instead of manually selecting important features at this stage, this is left to the machine learning stage to decide algorithmically (i.g., by pruning the decision tree).
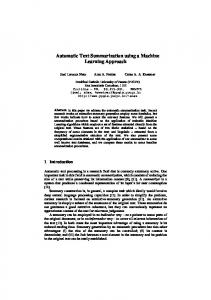
III. P ROPOSED M ETHOD Complete prototype system has been developed for the task of image-based web site summarization. Given a Web site, the system extracts its most characteristic images. These images form the image summary of the Web site. The purpose of this summary is then twofold: (a) It is presented to the user for viewing and browsing; (b) It can be stored and used by search engines [15] for fast searching of the contents of the Web (i.e., there is no need to search through the contents of the entire Web site). Fig. 1 illustrates the architecture of the proposed system. The system consists of several modules. The most important of them are discussed in the following.
A
...
Logo Image Non-Logo Image 3730 308278 Intensity Histogram Features
mean 184.45 standard deviation 88.20 skewness -0.72 kurtosis -1.21 threshold 169 entropy 4.24 energy 0.23 occupied bins 154 Radial Histogram Features
input: Web−site hierarchy
image extraction jpg, tif, gif... image feature extraction link information extraction decision tree computation of logo/trademark probability
image information extraction
logo/trademark detection
detection of duplicate logos/trademarks
decision tree image clustering ranking method function of: −logo/trademark probability −image link depth in Web−site −number of links
logo/trademark ranking
image summary: images ordered by importance
Fig. 1.
Web site image summarization system.
A. Image Information Extraction Typically images are embedded within web pages and are surrounded by text. Image files are extracted and processed. The following information is computed for each image: Link information: The position of each image in the Web site hierarchy is determined and characterized by its number of appearances in the Web site (i.e., the same image may be used or pointed to more than once by many Web pages within the same Web site) and by its depth (LinkDepth) in the Web site. It is defined as the minimum number of links from the root page that need to visited in order to access the image3 . It is normalized by the maximum image depth of the Web site: Depth =
M axDepth + 1 − LinkDepth . M axDepth
(1) An image in the root page has always Depth = 1. Images lower in the Web site hierarchy have Depth between 0 and 1. Text Information: Text describing the image is derived based on the analysis of html source where the image is referenced. It consists of the image file name (i.e., url entry), alternate text (i.e., alt field) , image caption (i.e., a sentence that follows or precedes the image when it is displayed on the browser) and title of page containing the image. This information is displayed together with images or can be used for searching the Web [15]. 3 Computed
as the number of “/” in image URL
TABLE IV I MAGE EXAMPLES WITH THEIR LOGO - TRADEMARK PROBABILITIES (P).
B. Logo and Trademark Detection Machine learning by decision trees is employed for training the system to distinguish between logo or trademark images and images of other categories, on the basis of the feature set defined earlier. The latter may belong to various other classes (e.g., graphics, photographs, diagrams, landscapes). A training set of 1,372 images is formed consisting of 684 logo-trademark images and 688 images of other types. A 23-dimensional vector is formed from each image. The attribute vectors of all images are fed into a decision-tree [5] which is trained to detect logo and trademark images. Table III illustrates the results of training for different confidence values and for 10-fold stratified cross-validation training [5]. This method estimates performance on data that has not been used for training. For each image, an estimate of its probability of being logo or trademark is computed. The average probability measured over all testing instances is the “classification accuracy” of the decision tree. The “confidence value” controls the degree of pruning of the decision tree. Lower values of confidence value cause more drastic pruning and create shorter trees than higher values. TABLE III P ERFORMANCE OF DECISION TREES FOR LOGO - TRADEMARK DETECTION USING A SET OF 23 FEATURES COMPUTED FROM THE HISTOGRAMS , OR 10 REDUCED FEATURES FROM SVD, MEASURED BY STRATIFIED CROSS VALIDATION . Confidence Value No pruning No pruning 0.25 0.25 0.1 0.1
Feature Vector Raw Vector SVD Raw Vector SVD Raw vector SVD
Classification Accuracy 84.18 82.17 84.40 83.48 84.49 82.64
Because the feature vectors may involve correlated attributes, we repeated the same experiment with uncorrelated attributes obtained by Singular Value Decomposition (SVD). Only the 10 higher order features were retained ignoring the less significant (lower order) features. The main idea was that lower order features correspond to less discriminating features that could potentially bias the results of the classification overall. However, the experimentation did not show any improvement by using SVD-based features. The best decision tree demonstrated classification accuracy as high as 84.49% corresponding to confidence value 0.1 and raw feature vectors (without SVD). Table IV illustrates example images along with their logo-trademark probabilities. The first two images are two different forms of the same logo image. The training method used above requires that each image be analyzed and represented by its feature vector. A faster method would be to concatenate the three histograms and use the merged histogram unprocessed (i.e., without computing any features at all) as a vector of 768 histogram values for training. We repeated the same experiment with the 40 uncorrelated attributes obtained by SVD ignoring the less significant (lower order) features. Again, the testing method is stratified cross validation. Table V summarizes the results of this training. Training the decision tree using histogram features outperforms training using raw histograms. Raw histograms are low level image representations
P=0.92
P=0.92
P=0.98
P=0.83
P=0.08
P=0.92
P=0.08
P=0.08
of image content. The decision trees become over-fitted to the training set and fail to generalize well to the test sets (e.g., getting trapped easily by outliers of the test sets). Therefore, the preferred method is training based on histogram features. TABLE V P ERFORMANCE OF DECISION TREES FOR LOGO - TRADEMARK DETECTION , USING THE 768 RAW HISTOGRAM VALUES , OR 40 REDUCED FEATURES FROM SVD, MEASURED BY STRATIFIED CROSS VALIDATION . Confidence Value No pruning No pruning 0.25 0.25 0.1 0.1
Concatenated Histogram Raw Vector SVD Raw Vector SVD Raw Vector SVD
Classification Accuracy 80.50 68.02 80.50 68.05 81.64 68.59
Similarity Detection: The purpose of this step is to train a decision tree to detect pairs of similar images. The training data set consists of 2,229 image pairs (338 pairs of similar images and 1,891 pairs of dissimilar images). For each image pair a 27dimensional attribute vector is formed. The attributes in this vector are computed as feature differences. There are 23 attributes corresponding to differences over 23 features (i.e., 7 features for each one of the 3 histograms plus image file size and number of distinct intensities), 3 attributes corresponding to 3 histogram intersections and 1 attribute corresponding to the Euclidean distance of their vectors of moment invariants. The decision tree accepts pairs of images and classifies them into similar or not (i.e., a “yes”/“no” answer). The decision tree was pruned with confidence value 0.1 and achieved 93.89% average classification accuracy. The evaluation method is again stratified cross validation. Image Clustering: The purpose of this step is to group all similar images together into clusters. Because there may exist a certain degree of uncertainty in detecting whether two
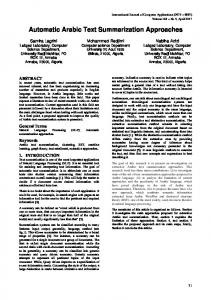
images are similar (depending on the classification accuracy of the decision tree), an image is allowed to be member of more than one clusters. In this work, they are assigned to the bigger cluster. The algorithm can be easily modified to assign the image to both clusters. The problem is formulated as one of finding the fully connected components (or “cliques”) on the image similarity graph: Each image corresponds to a node of the graph and two images (nodes) are connected by an edge if the decision tree determined that they are similar. A greedy algorithm for finding all cliques on the image similarity graph is applied [16]. Fig. 2 illustrates this process. A clique clustering algorithm reveals 3 cliques (clusters). In this example, the first two clusters share a common image. The following two stages work on the set of logo or trademark images detected at this stage. C. Duplicate Logo and Trademark Detection Because the same logo or trademark image may be found many times in various forms (e.g., as grey-level or color image) within the same Web site, the next step is to group all detected logo and trademarks into clusters. Each cluster contains various instances of the same logo or trademark (i.e., not only identical but also similar logo or trademarks). From each cluster, one image is selected to represent the cluster in the summary. This stage is implemented in two steps:
Depth:
The higher an image is in the Web site hierarchy, the more important it is. It is computed as in Sec. III-A and takes values in [0,1]. The following formula combines the above ideas and computes the importance of an image as ImageImportance = P robability · Depth · Instances.
(2)
Images appearing with the same URL (address in web site) are identical, regardless of web page of appearance. An image appearing many times has the same URL. If the images are exactly the same but have different URLs, they are considered to be different images. This however, wouldn’t be a problem since both images will be detected as similar and will be included in the same cluster. Based on the importance scores, one of these images will be selected for the summary. E. Image-Based Summarization The method above ranks individual images. Because the images within a cluster represent the same logo or trademark and a cluster may contain many images, only the most characteristic image from each cluster is represented in the summary. However, the number of clusters can be very large, and it becomes meaningful to rank the clusters themselves by importance (so that only the clusters ranked higher are represented in the summary). The number of clusters represented in a summary in user defined. The importance of a cluster depends on the importance of the images it contains and is computed as �
ClusterImportance =
ImageImportancei.
image i∈cluster
(3) The more the images in a cluster and the more important these images are, the more important the cluster is. IV. E XPERIMENTAL R ESULTS
cluster 1 cluster 3 cluster 2
3
S
8
1 6
4
10
2 5
Fig. 2.
7
UMMARIZING the above discussion, the method works as follows: 1) A Web site is downloaded or is available to a local computer. 2) All images within the Web site are extracted (Sec. III-A). 3) All logo and trademark images are detected (Sec. III-B). 4) Similar logo and trademark images are grouped into clusters (Sec. III-C). 5) All detected logo and trademark images are ranked by importance (Sec. III-D). 6) All clusters are ranked by importance (Sec. III-E). The top k clusters are represented in the summary (k is user defined). 7) Each cluster is represented in the summary by its most important logo or trademark image. The prototype system is accessible on the Web4 . The input to the system are Web sites crawled using the Larbin crawler5 . A local collection of 1,5 million pages with images corresponding to 31,217 Web sites was assembled. The crawler started its recursive visit of the Web from a set of 14,000 initial pages (the answers of Google image search6 to 20 queries on various topics). The crawler worked recursively in breadth first order and visited pages
9
Clustering on the image similarity graph.
D. Logo and Trademark Ranking The purpose of this stage is to find the most important (or characteristic) logo and trademark images in a Web site. The importance of an image is computed based on the following criteria: Probability: The higher the probability of being logo or trademark, the more important the image is. It corresponds to the classification accuracy of the decision tree measured for the image. Instances: The more the instances of an image in the Web site hierarchy, the more important it is. It takes values in [0,1] by normalizing by the total number of logo-trademark images in a Web site.
4 http://www.intelligence.tuc.gr/websummarization 5 http://larbin.sourceforge.net 6 http://www.google.com/imghp
up to depth of 6 links from each origin. Therefore, very deep Web sites are only partially downloaded (i.e., they are available up to depth 6). The method can work with any Web site. The only requirement is that the Web site has been downloaded to a local disk.
TABLE VI I MAGES DOWNLOADED FROM WWW. JAVA . COM .
A. Evaluation The results obtained by the method are also evaluated by a human. Below, we present average results (over 50 Web-sites) of logo-trademark detection accuracy (measured as the percentage of logo and trademarks detected by the method), classification accuracy (measured as the percentage of correctly classified logo and trademarks), and of overall system performance (measured as the percentage of qualifying logo and trademark images detected by the method with respect to the total number of logo and trademark images detected by the human). The results indicate that it is possible for the method to approximate algorithmically the human notion of image abstraction reaching up to 76% detection accuracy, up to 85% classification accuracy and, finally, up to 64% summarization accuracy (overall system performance). Appendix presents the measurements on the 50 Web sites used in this experiment. B. Examples The user is allowed to select a Web site through the user interface. As an example, the method is applied to the Java Web site ( www.java.com) and the results at each stage are discussed below. The downloaded images are shown in Table VI. The descriptive text of each image is not shown. Table VII shows logo and trademark images detected by the method. Very small images as well as buttons and bars were filtered out. The “Sun” logo was falsely filtered out by the decision tree because it is very small. The method detected a number of bars as logos. This reveals an inherent deficiency of the method: Buttons and bars (in many cases), exhibit the same characteristics with logo and trademark images such as low detail, low color variability and low spatial distribution of intensity values and cannot be effectively filtered out. Excluding all such images from the summaries is possible (e.g., by training the system to do so) but the risk of losing actual logo and trademark images is high. In this implementation we opted for a less rigorous filter for logo-trademark detection which exchanged a small probability for false positives (allowing some button and bar images to be included in the summaries) for much higher recall. Table VIII illustrates the grouping of logo and trademark images into clusters of similar images. Notice that the method detected image similarities at a coarse scale. Logos with different text messages are grouped together. This is a rather desirable characteristic of the method since the messages in all these images represent similar meaning. Methods supporting detection and recognition of text within images (e.g., text segmentation and optical character recognition methods) [17], [18] can also also be applied for grouping such images based on the meaning of their included text. We finally note that all bars and buttons are effectively grouped in one cluster (so that only one representative from this cluster will appear in the summary). Table IX shows the final image summary of the Web site. Only the most characteristic image of each cluster is included in the
TABLE VII L OGO AND TRADEMARKS DETECTED FROM WWW. JAVA . COM .
summary. Because only 3 clusters are detected, all clusters are represented in the summary. Notice that the summary may also be extended to include more than one images from each cluster. The images included in the summary are mostly images that appear higher than other similar images (within the same cluster) in the Web site hierarchy. Table X illustrated the images downloaded from the Web site or Princeton University ( www.princeton.edu). The system correctly filtered out all non-logo images (including buttons and bars) and detected only one image (shown in Table XI) in the summary. The image at the bottom row of Table X is very small and was filtered-out.
TABLE VIII C LUSTERS WITH SIMILAR L OGO AND TRADEMARKS WWW. JAVA . COM . cluster 1
cluster 1
TABLE X I MAGES DOWNLOADED FROM WWW. PRINCETON . EDU .
cluster 3
TABLE XI I MAGE SUMMARY OF WWW. PRINCETON . EDU . TABLE IX I MAGE SUMMARY OF WWW. JAVA . COM . Rank 1
Rank 2
Rank 1
Rank 3
V. C ONCLUSIONS We introduce the concept of image-based summarization for improving the quality of Web site summaries and as a tool for more effective Web browsing and retrieval. Appropriate criteria for measuring the importance of images in Web sites are also proposed based on their frequency of occurrence, characteristics of their content and Web link information. A novel image-based summarization method for the Web is presented and discussed. We choose the problem of summarization of large corporate Web sites by logo and trademark as a case study for the evaluation of the proposed method. The method works in steps, first by extracting images with high probability of being logos or trademarks, then by clustering similar images together and by ranking images in each cluster by importance. The most important image from each cluster is included in the summary. The method relies on image feature extraction for representing image content and on machine learning for distinguishing logos and trademarks (from images of other categories) and for detecting similarities between such images. A prototype web summarization system for logo and trademark images is also implemented. Experimental results of the method were described, while the prototype system is accessible on the Web. Extending the proposed methodology to handle more image types is straightforward (i.e., the algorithms for logo and trademark selection, description and matching can be replaced by algorithms for the new image type [19]). While logos and
trademarks are permanent features of the Web-site, summarization may not be meaningful for other types of images that may be transitory. For example, images from CNN’s news pages change every few hours and do not appear frequently and in different variations (these images don’t repeat). Aiming for summaries of stream image data (like the CNN data) is a different problem from what we are addressing in this work. The proposed method is currently being integrated into IntelliSearch7 , an intelligent Web search engine which has been developed in our laboratory. Future work includes experimentation with larger training data sets and image types for improving the performance machine learning. More elaborate machine learning methods (i.e., support vector machines, Bayesian networks, neural networks) for improving the classification accuracy and sensitivity (i.e., better adaptation to the feature space) of the learning process can also be used.
7 http://www.intelligence.tuc.gr/intellisearch
A PPENDIX E VALUATION R ESULTS
Web site
number of Number logo & of Images trademarks in Web in Web site site (human)
number of logo & trademakrs in Web site (method)
number of number of logo & logo & overall logo & logo & trademark trademark classificati trademarks trademarks abstraction detection in summary in summary accruacy on accuracy (method) (human) accuracy
www.berkeley.edu
100
2
1
50%
93%
2
1
www.caltech.edu
35
3
1
33%
57%
3
1
50% 33%
www.bu.edu
75
1
1
100%
92%
1
1
100% 100%
www.cc.gatech.edu
25
3
3
100%
96%
3
3
www.stanford.edu
122
7
6
86%
88%
7
4
57%
www.ocf.berkeley.edu
31
10
7
70%
87%
10
5
50%
www.umbc.edu
24
6
4
67%
92%
6
4
67%
www.debian.org
51
18
17
94%
98%
16
12
75%
www.java.com
19
4
3
75%
63%
3
2
67%
support.microsoft.com
84
10
8
80%
93%
6
5
83%
www.eclipse.org
54
5
4
80%
94%
6
3
50%
www.openoffice.org
38
6
4
67%
50%
5
4
80%
www.perl.org
26
25
20
80%
81%
22
14
64%
www.linux-france.org
15
3
1
33%
73%
3
0
0%
www.robocup2005.org
49
32
18
56%
71%
32
12
38%
www.vr.org
53
2
2
100%
91%
2
1
50%
www.netbeans.org
96
6
6
100%
90%
6
3
50%
www.suse.com
62
10
10
100%
97%
7
3
43%
www.linuxvirtualserver.org
49
27
16
59%
78%
9
6
67%
www.opengroup.org
52
10
3
30%
83%
10
3
30%
www.cs.princeton.edu
60
2
1
50%
78%
2
1
50%
www.mit.edu
10
1
1
100%
100%
1
1
100%
www.uga.edu
94
2
1
50%
98%
2
1
50%
www.intel.com
76
3
2
67%
89%
2
2
100%
www.amd.com
14
2
2
100%
100%
2
2
100%
research.microsoft.com
86
4
3
75%
83%
3
2
67%
digital.library.upenn.edu
134
18
13
72%
94%
18
10
56%
www.desktoplinux.com
89
10
4
40%
88%
10
2
20%
www.gnome.org
109
7
5
71%
87%
6
3
50%
www.skype.com
58
16
16
100%
98%
4
3
75%
www.sun.com
213
18
14
78%
81%
17
12
71%
www.wand.org
64
10
9
90%
90%
9
8
89%
www.arl.org
50
16
10
63%
70%
10
6
60%
www.kde.org
229
60
51
85%
84%
44
36
82%
www.pnas.org
53
2
2
100%
79%
2
2
100%
www.trimet.org
51
4
4
100%
73%
3
3
100%
www.isecom.org
95
40
26
65%
81%
30
14
47%
www.spl.org
61
4
2
50%
89%
4
2
50%
www.nab.org
86
7
4
57%
87%
7
4
57%
www.sierraclub.org
57
2
1
50%
86%
2
1
50%
www.rnc.org
89
4
3
75%
98%
4
3
75%
www.perl.com
36
2
2
100%
100%
2
1
50%
www.tuc.org
36
16
10
63%
83%
12
9
75%
www.linux-france.org
15
1
1
100%
87%
1
1
100%
www.microsoftwindowsanywhere.com
16
1
1
100%
100%
1
1
100%
fedora.redhat.com
15
1
1
100%
47%
1
1
100%
www.diplomacy.edu
96
16
15
94%
91%
15
5
33%
www.epic.org
63
15
9
60%
74%
15
9
60%
www.isoc.org
132
43
40
93%
84%
40
23
58%
www.sciencemag.org Average
75
20
15
75%
89%
18
7
39%
66.44
10.74
8.06
76%
85%
8.92
5.24
64%
ACKNOWLEDGEMENTS We are grateful to Epimenidis Voutsakis for valuable contributions into this work. This work was supported by project TOWL (FP6-STREP, Project No. 026896) of the European Union (EU). R EFERENCES [1] O. Buyukkokten, H. Garcia-Molina, and A. Paepcke, “Seeing the Whole in Parts: Text Summarization for Web Browsing on Handheld Devices,” in 10th Intern. World-Wide Web Conference, 2001. [2] Y. Zhang, N. Zincir-Heywood, and E. Milios, “World Wide Web Site Summarization,” Web Intelligence and Agent Systems: An International Journal (The Web Intelligence Consortium), vol. 2, no. 1, pp. 39–53, 2004. [3] I. Mani, “Recent Developments in Text Summarization,” in CIKM’01 Conf., 2001, pp. 529–531. [4] J.-Hu and A. Bagga, “Identifying Story and Preview Images in News Web Pages,” in 7th Intern. Conf. on Document Analysis and Recognition (ICDAR’2003), Edinburgh, Scotland, Aug. 2003, pp. 640–644. [5] I. Witten and E. Frank, Data Minning. Morgan Kaufmann, 2000, ch. 4. [6] A. K. Jain and A. Vailaya, “Shape-Based Retrieval: A Case Study With Trademark Image Databases,” Pattern Recognition, vol. 31, no. 9, pp. 1369–1399, 1998. [7] B. M. Mehtre, M. S. Kankanhalli, and W. F. Lee, “Content-Based Image Retrieval using a Composite Color-Shape Approach,” Information Processing and Management, vol. 34, no. 1, pp. 109–120, 1998. [8] K. Nakahira, T. Yamasaki, and K. Aizawa, “Accuracy Enhancement of Function-Oriented Web Image Classification,” in World Wide Web (WWW), Chiba, Japan, May 2005, pp. 950–951. [9] G. Heidemann, “Usupervised Image Categorization,” Image and Vision Computing, vol. 23, no. 10, pp. 861–876, Sept. 2005. [10] X. Lu, P. Mitra, J. Wand, and C. Giles, “Automatic Categorization of Figures in Scientific Documents,” in Joint Conf. on Digital Labraries(JCDL), Chapel Hill, North Carolina, USA, June 2006, pp. 129–138. [11] M. Sonka, V. Hlavac, and R. Boyle, Image Processing Analysis and Machine Vision. PWS Publishing, 1999, ch. 6.3. [12] M. Seul, L. O’Gorman, and M. Sammon, Practical Algorithms for Image Analysis. Cambridge Univ. Press, 2000, ch. 3.9. [13] W. Vetterling, W. Press, B. Flannery, and S. Teukolsky, Numerical Recipies in C++, The Art of Scientific Computing. Cambridge Univ. Press, 2003, ch. 14. [14] M. Sonka, V. Hlavac, and R. Boyle, Image Processing Analysis and Machine Vision. PWS Publishing, 1999, ch. 14. [15] E. Voutsakis, E. Petrakis, and E. Milios, “Weighted Link Analysis for Logo and Trademark Image Retrieval on the Web,” in IEEE/WIC/ACM Intern. Conf. on Web Intelligence (WI2005), Compiegne University of Technology, France, 2005. [16] S. S. Skiena, The Algorithm Design Manual. Springer-Verlag, 1998, ch. 8. [17] D. Cai, X. He, Z. Li, W.-Y. Ma, and J.-R. Wen, “Hiearchical Clustering of WWW Image Search Results using Visual, Textual and Link Information,” in ACM Multimedia 2004, NY, USA, 2004. [18] J. Zhou and D. Lopresti, “Extracting Text from WWW Images,” in Intern. Conf. of Document Analysis and Recognition (ICDAR’97), Ulm, Germany, 1997, pp. 248–252. [19] D. Zhanng and S. Chang, “Detecting Image Near-Duplicate by Stochastic Attributed Relational Graph Matching with Learning,” in 12th ACM Intern. Conference on Multimedia, New York, USA, 2004, pp. 877–884.
Baratis Evdoxios is a M.Sc. student in the Department of Electronic and Computer Engineering of the Technical University of Crete (TUC). He received a Diploma in Electronic and Computer Engineering from the Technical University of Crete (TUC) in 2005. Mr. Baratis is involved in research on the processing and analysis of image content and its applications in Web information systems. His current research focuses on Semantic Web, the representation of time varying concepts in ontologies and on the design and implementation of query languages for time ontologies.
Euripides Petrakis received a Bachelors degree in Physics from the National University of Athens in 1985 and a Ph.D degree in Computer Science from the University of Crete in 1993. Between 1996 and 1998 he was a visiting researcher at the Department of Computer Science of York University, Toronto, Canada and at GMD/IPSI Institute, Darmstadt, Germany. He joined the Technical University of Crete (TUC) on January 1998, where he is serving as associate professor at the Computer Science division of the Department of Electronic and Computer Engineering, and Director of the Intelligent Systems Laboratory. He has published on the processing and analysis of image content, image indexing, image database and medical information systems. He is currently involved in research on modern aspects of information retrieval, multimedia information systems, Web information systems, Semantic Web and information extraction from text. He is a member of the IEEE.
Evangelos Milios received a diploma in Electrical Engineering from the National Technical University of Athens, Greece, in 1980 and Master’s and Ph.D. degrees in Electrical Engineering and Computer Science from the Massachusetts Institute of Technology, Cambridge, Massachusetts, from where he graduated in 1986. While at M.I.T., he was a member of Digital Signal Processing group and he worked on acoustic signal interpretation problems at the M.I.T. Lincoln Laboratory. After spending 5 years doing research on shape analysis and sensor-based mobile robotics in the Department of Computer Science, University of Toronto, he joined York University in 1991 as an Associate Professor. Since July of 1998 he has been with the Faculty of Computer Science, Dalhousie University, Halifax, Nova Scotia, where he is Professor and Killam Chair of Computer Science. He served as Director of the Graduate Program (1999-2002) and he is currently Associate Dean, Research. He is a Senior Member of the IEEE. He was a member of the ACM Dissertation Award committee (1990-1992), a member of the AAAI/SIGART Doctoral Consortium Committee (1997-2001) and he is co-editor-in-chief of the journal Computational Intelligence. He has published on the processing, interpretation and use of visual and range signals for landmark-based navigation and map construction in single- and multi-agent robotics. His current research activity is centered on modeling and mining of content and link structure of Networked Information Spaces.


![SEO Case Study: PhillyDentistry.com - Web Site Optimization [PDF]](https://m.moam.info/img/260x300/seo-case-study-phillydentistrycom-web-site-optimiz_648e71b8098a9ed6778b4577.jpg)