AUTOREGRESSIVE MODELING AND CLASSIFICATION OF EVENTRELATED POTENTIALS OF ALCOHOLICS AND NORMALS Narayanan Srinivasan* and Hrishikesh Balakrishnan# Department of Electronics and Communication Engineering # Department of Chemical Engineering Sri Venkateswara College of Engineering, Pennalur, Sriperumbudur 602 105, India *
Email:
[email protected]
Abstract - Autoregressive modeling was performed on eventrelated potentials from alcoholics and control subjects. The EEG data was recorded using delayed matching-to-sample object recognition tasks. The optimal AR order was found for both groups of subjects and for all the tasks based on the CIC criterion. We found the mean AR order for various groups to be around 12 and they varied significantly with the electrodes used in the recordings. AR modeling of order 7 and 12 was performed on the event-related potentials. The AR coefficients were then fed to a feed forward neural network and training and classification using the back propagation algorithm. Neural network based classification of alcoholics was found to be dependence on the tasks and the electrodes as well as AR order. The best accuracy obtained was around 77%. The results show that parametric spectral analysis and artificial neural networks can be used to analyze and classify alcoholics and control subjects using event-related potentials. 1 INTRODUCTION
Alcoholism affects millions of people directly the world over, causing premature deaths, disrupting millions of families and leading to the loss of productivity, time and property. The development of alcohol use problems, including alcoholism, is influenced by multiple genes (i.e., what we inherit), the environment (i.e., where and how we live), and interactions between the two. Alcohol causes many of its physical effects (e.g., intoxication and sleepiness) by affecting communication between neurons. Alcohol may produce some of its effects by interfering with signal transduction [9,14]. The communication between neurons creates electrical activity. Groups of neurons with similar functions extend from one brain region to another, forming neural circuits. Circuits interact with one another to integrate the functions of the brain, including complex emotional, cognitive, and motivational processes. To understand the link between alcohol use and these complex processes, alcohol researchers need a way to relate the chemistry of individual neurons to the integrated activity of neuronal circuits. A recent approach to the problem involves the simultaneous measurement of electrical activity within selected neuronal circuits [4,7,10,11,15,22]. This technique has been used in both rats and humans. For
example, in a preliminary study, Woodward and colleagues [20] used this technique to trace the sequence of neuronal activity in rats as they responded to the presence of alcohol. This technique has also been applied to human studies using electroencephalography (EEG). Researchers have identified at least three brainwave patterns with EEG that have been associated with alcoholism and which may help experimenters identify people at increased risk [4,15]. Significant differences have been found in the ERPs of alcoholics and normals. The visual P3a component amplitude is reduced for alcoholics in the central, parietal, occipetal and temporal regions [10]. In a modified delayed matching-to-sample task (DMS), an ERP component at 250 ms showed differences in the occipitotemporal region indicating a possibility of working memory deficits in alcoholics [22}. Delayed matching-to-sample paradigms have been used extensively study visual short-term memory [21,11]. They have also been used to study alcoholics [22,11]. The differences in amplitude between matching and no-matching trials in a DMS task were less for alcoholics when compared to the control subjects. Trilinear modeling was applied to ERPs and accurately classified 16/20 alcoholics and 25/29 control subjects [19]. Other approaches to study EEGs from alcoholics include the application of the theory of statistical mechanics of neocortical interactions [12,13]. Signal processing techniques are used to analyze the EEG and ERP signals and use them for a variety of medical and research purposes, to help in the diagnosis of diseases and in the understanding of brain dynamics. Autoregressive modeling and neural network based classification has been used in various studies involving classification using EEGs [1,2,3,8]. Schizophrenics and normals were classified using AR modeling (of order 8) and Bilinear modeling for EEGs [8]. A neural network was used for classification and their accuracy in detecting normals and schizophrenics was 67% and 70% respectively. In addition to clinical disorders, EEGs have also been used to classify different mental tasks [1,2,3]. Multiple representations were used for processing the EEGs and AR modeling was found to give the best accuracy for classifying mental
tasks. In this paper, we have attempted a similar methodology i.e., AR modeling followed by classification using neural networks.
5
2 DATA SET
−5
Matching No−matching S1
0
−10
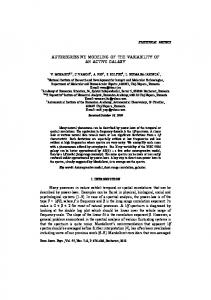
The data set consisted of multiple electrode time series EEG recordings of control and alcoholic subjects. This data was the result of a large study to examine EEG correlates of genetic predisposition to alcoholism and was collected at various centers in the United States, sponsored by the National Institute of Alcohol Abuse and Alcoholism project. The data was recorded from 61 electrodes placed on subject's scalp sampled at 256 Hz for 1 second. The electrode positions were located at standard sites (Standard Electrode Position Nomenclature, American Electroencephalographic Association The data was originally recorded by Henri Begleiter Neurodynamics Laboratory, State University of New York Health Center Brooklyn, New York (We gratefully acknowledge Dr. Henri Begleiter, Neurodynamics laboratory at the State University of New York Health Center at Brooklyn and Paul Conlon of Sasco Hill Research Inc for providing the data set). There were two groups of subjects: alcoholic and control. Each subject was exposed to either a single stimulus (S1) or to two stimuli (S1 and S2) which were pictures of objects chosen from the 1980 Snodgrass and Vanderwart picture set [17]. When two stimuli were shown, they were presented in either a matched condition where S1 was identical to S2 or in a non-matched condition where S1 differed from S2. The DMS task has been used to study various processes such ass visual short term memory, mnemonic processing, etc [11]. There were 122 subjects and each subject completed 120 trials where different stimuli were shown. There were 45 control subjects and 77 alcoholics in the data set. The stimuli were presented with a 1.6 seconds interstimulus interval and the stimulus duration was 15 ms. The electrodes were divided into five regions in these ERP studies. The occipetal region consists of electrodes PO7/8, PO1/2, POZ, O1/2, OZ; the parietal region consists of electrodes - CP3/4, CP1/2, CPZ, P3/4, P1/2, PZ; the temporal region consists of electrodes - FT7/8, T7/8, TP7/8, CP5/6, P7/8, P5/6; the central region consists of FC5/6, FC3/4, FC1/2, FCZ, C5/6, C3/4, C1/2; the frontal region consists of electrodes - FP1/2, AF7/8, AF1/2, F7/8, F5/6, F3/4, F1/2, FPZ, AFZ, FZ. The data collection process is explained in detail in [4,21]. The ERPs are shown in Fig. 1.
0
50
100
150
200
250
Time
5
Matching No−matching S1
0
−5
−10 0
50
100
150
200
250
Time
Figure 1. Event-related potentials for an occipital electrode 3 AUTOREGRESSIVE MODELING
Spectral analysis was performed using AR modeling. AR analysis models a stationary stochastic signal as the output of a linear system driven by white noise of zero mean and unknown variance. The EEG signal is assumed to be stationary for time lengths of 1 second. ARMA models have the form N
M
i =1
j =0
y[k ] + ∑ a k y[k − i ] =∑ b j n[k − j ] AR models have the form N
y[k ] + ∑ ak y[k − i ] =n[k ] i =1
where y[k]is the time series, n[k] is the noise, ai s are AR coefficients, bjs are the moving-average (MA) coefficients, N is the AR order and M is the MA order. AR modeling is usually preferred over ARMA modeling. ARMA models may become unstable, the algorithms to estimate the coefficients are computationally demanding. Hence AR modeling is used extensively in modeling random signals like EEGs [1,2,3,8,18]. AR coefficients can be computed using various algorithms, given the AR order for a particular signal [16]. Determining the right AR order might be necessary to accurately model the given EEG/ERP signal. Various studies using AR models for EEGs have used different AR orders without any specific criterion. The AR order used for EEG analysis has varied from 6 to as high as 23. For example, Anderson et al.,
[1,2,3] have used an AR order of 6 in discriminating various mental tasks. Hazarika et al., [8] have used an AR order of 8. In a study involving EEG recorded at various levels of anesthesia [18], AR order was estimated to vary with levels of anesthesia. An AR order of 12 was found for low levels of anesthesia and the AR order reduced to as much as 2 for high levels of anesthesia.
estimate from AR coefficients of order 12 matches more closely with the FFT of the ERP in Fig. 3(a). 15
14
AR ORDER
13
In this study, AR order was estimated for the whole data set i.e., for all the event-related potentials from individual electrodes, tasks, and subjects as well as individual trial EEGs. All the computations were done using MATLAB. AR order was estimated initially using the Akaige Information Criterion (AIC). AIC can be computed with
12
11
10 P
AIC ( p ) = N log ∈p +2 p
T
O
F
C
9
where p is the model order, N is the number of samples, and p is the modeling error. AR order estimated using AIC was typically around 3 or 4.
8 0
10
20
30
40
50
60
ELECTRODES
Figure 2. Mean AR order for all the electrodes
Recent work [5,6] on AR order selection has proposed a new Combined Information Criterion (CIC) for selecting the optimal AR order. The CIC criterion is defined as
(A) 200
p p 1 + v (i,⋅) − 1,3∑ v(i,⋅) ln{RES ( p )}+ max ∏ i =0 i =0 1 − v(i,⋅)
where p is the AR model order and RES(p) is the residual variance. v (i, ) are the finite sample variance coefficients where i is the order and “ ” is the method of estimation. We used CIC to estimate AR order for all the EEGs and ERPs. The mean AR order estimated using CIC for EEGs and ERPs of every electrode, task, and subject were around 12. Mean AR order did not vary significantly over tasks or subjects, but differed depending on the location of the electrodes as seen in Fig. 2. AR order for different electrodes was similar across the tasks and the subjects. They were also fairly similar for most of the electrodes in a given region. AR seemed to depend more closely on the electrode location rather than the tasks or subjects in this data set. In order to study the selection of AR order on classification, we used two AR orders 7 and 12 to estimate the AR coefficients for ERPs from every electrode, task, and subject. The AR coefficients were estimated based on the cumulants. Figure 3 shows an ERP and its spectral estimates obtained using FFT and AR coefficients from different orders. The mean even-related potential from the parietal and occipital electrodes is shown in Fig. 3(a). The spectral estimates from FFT, AR order 7 and AR order 12 are shown in Fig. 3(b). It can be seen that the spectral
0 −100 −200 −300
0
50
100
150
200
250
300
(B)
1 SPECTRAL ESTIMATE
CIC ( p) =
AMPLITUDE
100
FFT AR 7 AR 12
0.8 0.6 0.4 0.2 0 0
5
10
15
20
25
30
Figure 3. (A). Mean event-related potential from the parietal and occipital electrodes. (B). Spectral estimates from FFT, AR order 7 and AR order 12. 4 NEURAL NET BASED CLASSIFICATION
A feed forward neural network was used to classify alcoholics and control subjects. The AR coefficients were normalized and presented as inputs to the neural network. The neural network for classification had two hidden layers of 50 and 20 neurons each and one output neuron. We used the gradient back propagation algorithm with adaptive learning rate and momentum. The training set contained 20 alcoholics and 20 control subjects. The
testing set consisted of 25 alcoholics and 25 control subjects to keep the numbers in both groups matched. Classification accuracy was computed for various combinations of electrodes, tasks, and AR order. Begleiter and his colleagues [4] found that the amplitude (peak) for alcoholics and control subjects do not significantly differ in the DMS task. However, they found that there was interaction between the matching/no-matching tasks and the type of subject. While the c3 amplitude was significantly different in the matching/no-matching conditions for control subjects, for the alcoholics there was no significant difference in amplitude between the two tasks. This effect was present only in the parietal and occipetal electrodes. The c3 amplitude significantly differed for the matching/no-matching tasks only for the electrodes in the parietal, occipetal and temporal areas. We presented the set of AR coefficients for classification based on these results for parietal electrodes, occipetal electrodes, both parietal & occipetal electrodes, and all the electrodes as well as the matching/no-matching tasks separately and together. The network was simulated many times for a given combination of electrodes, AR order, and tasks. The mean classification accuracy is reported in this study. The classification accuracy was better for AR12 compared to AR7. The best results were obtained with AR coefficients from both the parietal area & occipetal electrodes and both the matching/no-matching tasks. The mean accuracy was 75% (the maximum accuracy we obtained for a given training/testing set was 87.5%). The classification accuracy for some of the combinations is given in Tables 1-3.
To summarize, classification was better for data from parietal & occipetal areas and when presented with data from both tasks simultaneously. Performance was also better for AR12 compared to AR7. Our results also match the effects found in [4]. The significant interaction obtained for the tasks and subjects in the parietal and occipetal electrodes matches with the better performance of the neural network when presented with AR coefficients from both tasks and parietal/occipetal electrodes. The results are also comparable to that of similar studies involving AR modeling and classification of subjects using EEGs and ERPs [8]. 5 CONCLUSION
AR analysis was performed on ERPs obtained from alcoholics and controls in object recognition tasks. AR order based on CIC criterion varied significantly with respect to the electrodes, but remained similar for the various tasks and subjects. The mean AR order according to the CIC was 12. The work can be extended to nonlinear analysis or a wavelet based approach of EEGs and ERPs to achieve a better representation of the signal. Further work can also be done on improving the performance of the neural network or by optimizing network parameters or using different types of neural networks. The results show that event-related potentials can be used to classify and differentiate between alcoholics and control subjects. REFERENCES 1.
Table 1. Classification accuracy for parietal electrodes alone 2. AR 7 12
Matching 66% 69%
No-matching 69% 69%
Both 67% 71%
Table 2. Classification accuracy for occipetal electrodes alone AR 7 12
Matching 64% 71%
No-matching 64% 70%
Both 61% 73%
Table 3. Classification accuracy for parietal and occipetal electrodes AR 7 12
Matching 66% 73%
No-matching 67% 72%
3.
Both 68% 77%
4.
C. W. Anderson, S. V. Devulapalli, and E. A. Stolz, “EEG signal classification with different signal representations”, In Neural Networks for Signal Processing V, ed. by F. Girosi, J. Makhoul, E. Manolakos, E. Wilson, IEEE Service Center, Piscataway, NJ, pp. 475--483, 1995. C. W. Anderson, E. A. Stolz, and S. Shamsunder, “Discriminating of mental tasks using EEG represented by AR models”, Proceedings of the 1995 IEEE Engineering in Medicine and Biology Annual Conference, Montreal, Canada, 1995. C. W. Anderson and Z. Sijercic, “Classification of EEG signal from four subjects during five mental tasks”, In Solving Engineering Problems with Neural Networks: Proceedings of the Conference on Engineering Applications in Neural Networks (EANN'96), ed. by Bulsari, A.B., Kallio, S., and Tsaptsinos, D., Systems Engineering Association, PL 34, FIN-20111 Turku 11, Finland, pp. 407--414, 1996. H. Begleiter, and Porjesz, B. “`What is inherited in the predisposition toward alcoholism? A proposed model”, Alcoholism: Clinical and Experimental Research, Vol. 23, No. 7, pp. 1125-1135, 1999.
5.
6.
7.
8.
9.
10.
11.
12.
13.
14.
15.
16.
17.
P. M. T. Broersen, “Facts and fiction in spectral analysis”, IEEE Transcations on Instrumentation and Measurement, Vol. 49, No. 4, pp. 766-772, 2000. P. M. T. Broersen, “Finite sample criteria for autoregressive order selection”, IEEE Transactions on Signal Processing, Vol. 48, No. 12, pp. 3350-3358, 2000. M. A. Enoch, K. V. White, C. R. Harris, et al, “Association of low-voltage alpha EEG with a subtype of alcohol use disorders”, Alcoholism: Clinical and Experimental Research, Vol. 23, No. 8, pp.1312-1319, 1999. N. Hazarika, A. C. Tsoi, and A. A. Sergejew. “Nonlinear Considerations in EEG Signal Classification”, IEEE Transactions on Signal Processing, Vol. 45. No. 4, pp. 829-836, 1997. S. Y. Hill, “Biological phenotypes associated with individuals at high risk for developing alcohol-related disorders: Part I”, Addict Biol, vol 5, pp.5-22, 2000. S. R. Holguin, B. Porjescz, D. B. Chorlian, J. Polich, and H. Beglieter, “Visual P3a in male alcoholics and controls”, Alcoholism: Clinical and Experimental Research, Vol. 23, No. 4, pp. 582-591, 1997. J. Ji, B. Porjesz, and H. Begleiter, “Event-related potential index of semantic mnemonic dysfunction in abstinent alcoholics”, Biological Psychiatry, Vol. 45, No. 4, pp. 494-507, 1999. L. Ingber, “Statistical mechanics of neocortical interactions: Canonical momenta indicators of electroencephalography”, Physical Review E, Vol. 55, No. 4, pp. 4578-4593, 1997. L. Ingber, “Statistical mechanics of neocortical interactions: Training and testing canonical momenta indicators of EEG”, Mathematical Computer Modelling, Vol. 27, pp. 33-64, 1998. S. E. Lukas, “Topographical brain mapping during drug-induced behaviors”, In: Johnson, B.A., and Roache, J.D., eds, Drug Addiction and Its Treatment: Nexus of Neuroscience and Behavior, Philadelphia, PA: Lippincott-Raven, pp. 259-275, 1997. B. Porjesz, H. Begleiter, T. Reich, et al, “Amplitude of visual P3 event-related potential as a phenotypic marker for a predisposition to alcoholism: Preliminary results from the COGA project”, Alcoholism: Clinical and Experimental Research, Vol. 22, No. 6, pp.13171323, 1998. J. G. Proakis, and D. G. Manolakis. Digital Signal Processing: Principles, Algorithms, and Applications. Englewood Cliffs, N.J: Prentice Hall, 1996. J. G. Snodgrass and M. Vanderwart, “A standardized set of 260 pictures: norms for the naming agreement, familiarity, and visual complexity”, Journal of Experimental Psychology: Human Learning and Memory, Vol. 6, pp. 174-215, 1980.
18. S. Sumathi and C. N. Krishnan, “Automatic machine classification of patient anesthesia levels using EEG signals”, Proceedings of IECON, pp. 2349-2351, 1991. 19. K. Wang, H. Begleiter, and B. Porjescz, “Trilinear modeling of event-related potentials”, Brain Topography, Vol. 12, No. 4, pp. 263-271, 2000. 20. D. J. Woodward, P. H. Janak, and J. Y. Chang, “Ethanol action of neural networks studied with multineuron recording in freely moving animals”, Alcoholism: Clinical and Experimental Research, Vol. 22, No. 1, pp. 10-22, 1998. 21. X. L. Zhang, H. Begleiter, B. Porjesz, W. Wang, and A. Litke, “Event related potentials during object recognition tasks”, Brain Research Bulletin, Vol. 38, No. 6, pp. 531-538, 1995. 22. X. L. Zhang, H. Begleiter, and B. Porjescz, “Is working memory intact in alcoholics? An ERP study”, Psychiatry Research: Neuroimaging section, Vol. 75, pp. 75-89, 1997. 23. X. L. Zhang, H. Begleiter, B. Porjesz, and A. Litke, “Visual object priming differs from visual word priming: an ERP study”, Electroencephalography and Clinical Neurophysiology, Vol. 102, pp. 200-215, 1997.