The PerfExpert tool supports automatic performance measurement and ... AutoSCOPE succeeds in selecting the same source-code transformations as ... Few application developers possess all of this knowledge .... lected by a performance monitoring unit with system cha- ...... only 32 DRAM pages can be open at once.
AutoSCOPE: Automatic Suggestions for Code Optimizations using PerfExpert Olalekan A. Sopeju1, Martin Burtscher1, Ashay Rane2, and James Browne3 Department of Computer Science, Texas State University, San Marcos, TX, USA 2 Texas Advanced Computing Center, University of Texas, Austin, TX, USA 3 Department of Computer Science, University of Texas, Austin, TX, USA
1
Abstract - Automated source-code performance optimization has four stages: measurement, diagnosis of bottlenecks, determination of optimizations, and rewriting of the source code. Each stage must be successfully implemented to enable the next stage. The PerfExpert tool supports automatic performance measurement and bottleneck diagnosis for multicore and multichip compute nodes, i.e., it implements the first two stages. This paper presents AutoSCOPE, a new system that extends PerfExpert by implementing the third stage. Based on PerfExpert’s output, AutoSCOPE automatically determines appropriate source-code optimizations and compiler flags. We describe the process for selecting optimizations and evaluate the effectiveness of AutoSCOPE by applying it to three HPC production codes. Each of these codes is available in unoptimized and manually optimized versions. AutoSCOPE succeeds in selecting the same source-code transformations as were chosen by human experts in most cases. AutoSCOPE is an extensible framework to which additional optimizations and further rules for selecting optimizations can be added. Keywords: optimization recommendation, filtering, ranking, automatic performance assessment
1. Introduction The performance of a program often varies considerably when it is run on multicore chips with different architectures. Structuring source code to obtain optimal performance on a given multicore chip (or a compute node comprised of multiple multicore chips) requires detailed knowledge of the CPU, the memory subsystem, the compiler, and the operating system, i.e., the entire system architecture. Few application developers possess all of this knowledge and, indeed, it would be wasteful of time and effort for everyone to be forced to acquire such knowledge. Performance tools can help, but executing the measurement process is tedious, and the results of the measurement may be difficult to interpret. To make things worse, the necessary sourcecode transformation to remedy a given performance bottleneck is often not obvious. As a result, it is frequently the case that the performance obtained on multicore chips and
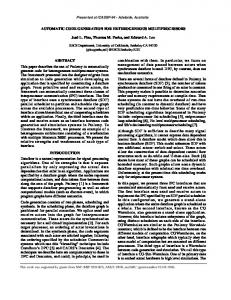
compute nodes comprised of multiple multicore chips is far from optimal. This paper presents an extensible method for automatically selecting source-code transformations and compiler flags to optimize program performance. The selection process follows a set of rules and is guided by the results of a performance measurement and analysis tool. This tool, called PerfExpert [4], [21], assesses the performance of the program executing on the chip/node on which improved performance is desired. PerfExpert combines knowledge of performance measurement, chip architectures, compilers and runtime systems to generate actionable interpretations of performance measurements. The AutoSCOPE framework described in this paper, i.e., the selection process for choosing good source-code transformations for a given performance bottleneck and code section, currently represents the final stage of the performance optimization process implemented by PerfExpert. Loop in function main() at mmm.c:25 (100% of the total runtime) ============================================================================== performance assessment LCPI good......okay......fair......poor......bad.... * overall : 9.2 >>>>>>>>>>>>>>>>>>>>>>>>>>>>>>>>>>>>>>>>>>>>>>+ upper bound estimates * data accesses : 14.6 >>>>>>>>>>>>>>>>>>>>>>>>>>>>>>>>>>>>>>>>>>>>>>+ - L1d hits : 1.7 >>>>>>>>>>>>>>>>>>>>>>>>>>>>>>>>>> - L2d hits : 0.9 >>>>>>>>>>>>>>>>>> - L2d misses : 11.9 >>>>>>>>>>>>>>>>>>>>>>>>>>>>>>>>>>>>>>>>>>>>>>+ * instruction accesses : 0.6 >>>>>>>>>>> - L1i hits : 0.6 >>>>>>>>>>> - L2i hits : 0.0 > - L2i misses : 0.0 > * data TLB : 9.9 >>>>>>>>>>>>>>>>>>>>>>>>>>>>>>>>>>>>>>>>>>>>>>+ * instruction TLB : 0.0 > * branch instructions : 0.1 >> - correctly predicted: 0.1 >> - mispredicted : 0.0 > * floating-point instr : 3.0 >>>>>>>>>>>>>>>>>>>>>>>>>>>>>>>>>>>>>>>>>>>>>>+ - fast FP instr : 3.0 >>>>>>>>>>>>>>>>>>>>>>>>>>>>>>>>>>>>>>>>>>>>>>+ - slow FP instr : 0.0 >
Figure 1: Sample PerfExpert output for a poorly performing loop nest PerfExpert presents a simple user interface for performance assessment of programs. It combines the data collected by a performance monitoring unit with system characteristics to compute a readily interpretable performance metric. In particular, PerfExpert combines hardware performance counter measurements with architectural parameters such as cache latencies at different levels, the branch misprediction penalty, etc. to compute upper bounds on Local Cycles-Per-Instruction (LCPI) contributions of various categories at the granularity of loops and procedures. The
LCPI values allow PerfExpert not only to determine which code sections suffer from performance bottlenecks but also to narrow down the cause of the poor performance to specific categories such as data accesses or branch instructions. Figure 1 shows how PerfExpert presents the results of its analysis of a triply-nested loop that performs a matrixmatrix multiplication. Longer bars represent higher fractions of runtime spent in executing the corresponding class of operations. Figure 2 lists the source code of the assessed loop nest. For illustration purposes, we used a poor loop order and no optimizations so that executing the code will result in bad memory access patterns. Indeed, PerfExpert detects these weaknesses and correctly identifies data accesses and TLB accesses as the primary culprits. for (i = 0; i < n; i++) for (j = 0; j < n; j++) for (k = 0; k < n; k++) c[i][j] += a[i][k] * b[k][j];
Figure 2: Simple triply-nested loop for matrix multiplication There is, however, often a substantial gap between identification of a problem and its resolution. For example, how should one resolve the problem of poor performance due to the TLB? Many application programmers do not know, nor should they have to know, what exactly a TLB is. Which source-code statements can cause data TLB problems and how can they be rewritten to yield better performance? The difficulty of such questions is compounded when multiple categories are reported to be a problem at the same time. Loop in function main() at mmm.c:25 (100% of total runtime) change the order of loops loop i { loop j {...} } → loop j { loop i {...} } employ loop blocking and interchange loop i {loop k {loop j { c[i][j] = c[i][j] + a[i][k] * b[k][j];}}} → loop k step s {loop j step s {loop i {for (kk = k; kk < k + s; kk++) {for (jj = j; jj < j + s; jj++) {c[i][jj] = c[i][jj] + a[i][kk] * b[kk][jj];}}}}} componentize loops by factoring them into their own subroutines ... loop i {...} ... loop j {...} ... → void li() {...}; void lj() {...}; ... li(); ... lj(); ... apply loop fission so every loop accesses just two different arrays loop i {a[i] = a[i] * b[i] - c[i];} → loop i {a[i] = a[i] * b[i];} loop i {a[i] = a[i] - c[i];}
Figure 3: Abridged AutoSCOPE output with code examples To make it easier and quicker to resolve such performance problems, we designed AutoSCOPE, which is accessible through a simple web interface [21]. It analyzes the output of PerfExpert and determines which categories are in need of optimization. Then, it retrieves and ranks relevant suggestions for those categories from an annotated optimization database and selects the most relevant recommendations based on their ranks. The final set of suggestions is presented to the user. For example, AutoSCOPE “knows” that the probable cause of the TLB access bottleneck is a very long data access stride to an array. Thus, the PerfExpert output from Figure 1 results in the optimization recommendations shown in Figure 3, which include reordering
of the loops in the loop nest. The recommendation for loop blocking arises due to the high rate of L2 misses. Section 2 provides more detail and shows how the complete selection and optimization process is applied to this triply-nested loop. As we shall see later in the examination of real application codes, the appropriate optimizations are sometimes much less straightforward to identify. Some of the suggestions include compiler flags (Figure 7). Since compiler flags depend on the compiler used, AutoSCOPE allows the user to choose among different compilers. It further allows turning on and off the inclusion of the code examples and compiler flags in the output. We evaluated AutoSCOPE on three large-scale HPC application programs, including one that is used as a standard performance benchmark, on a supercomputing cluster at TACC. It was, almost without exception, successful in identifying and recommending the optimizations that were thought to be most appropriate by human performance experts that had tuned these codes before AutoSCOPE existed. AutoSCOPE and PerfExpert are freely available at http://www.tacc.utexas.edu/perfexpert/.
2. Filtering and ranking approach This section explains how AutoSCOPE makes its recommendations. It uses the same process for each code section in PerfExpert’s output. The purpose of filtering is to eliminate inapplicable suggestions. The purpose of ranking is to order the suggestions so that the most relevant recommendations can be identified and outputted. The ultimate goal is to make the final list neither too long nor too short and, of course, to include the most appropriate optimization suggestions for each code section. Additionally, we want AutoSCOPE and its database to be easily extensible. 1. recommendation: use smaller types (e.g., float instead of double, short instead of int) categories: data-TLB, data-L2+memory-accesses attributes: 2. recommendation: move loop invariant memory accesses out of loop categories: data-L1-accesses attributes: loop 3. recommendation: change the order of loops categories: data-TLB, data-L2+memory-accesses attributes: loop 4. recommendation: employ loop blocking and interchange categories: data-TLB, data-L2+memory-accesses attributes: loop 5. recommendation: fuse multiple loops that access the same data categories: data-L2+memory-accesses attributes: loop, multiple_loops 6. recommendation: componentize loops by factoring them into their own subroutines categories: data-L2+memory-accesses attributes: loop 7. recommendation: apply loop fission so every loop accesses just two different arrays categories: data-memory-accesses attributes: loop 8. recommendation: move loop invariant computations out of loop categories: FP-instructions attributes: loop
Figure 4: Simplified excerpt from AutoSCOPE’s recommendation database To support ranking and filtering, each entry in the optimization database is annotated with a set of attributes and a non-empty set of categories. The attributes specify conditions that must be met for the corresponding entry to be useful. For example, an attribute might state that this is a loop
optimization and therefore only applies to loops. In contrast, the categories are used to compute weighted averages of LCPI values for the ranking. Figure 4 shows a small excerpt from the current optimization database, excluding code examples and compiler flags. We use this sample database throughout this section, along with the PerfExpert output from Figure 1, to illustrate the filtering and ranking process of AutoSCOPE, which entails the following steps. Function versus loop filtering: AutoSCOPE uses a disjoint set of recommendations for code sections that represent loops and code sections that represent functions. This separation is a consequence of how HPCToolkit [24], upon which PerfExpert is build, treats functions and loops. Whereas functions and loops are assessed individually and do not include measurements from other functions they call, a function’s assessment always includes the loops executed by this function. Hence, for any loop that is listed by PerfExpert, the enclosing function is necessarily also listed, and all suggested optimizations for the loop also apply to the function, leading to unnecessary duplication of suggestions. If, however, a function is listed but a contained loop is not, then that loop is not important and therefore loop optimizations should not be suggested for this function. Combining these two cases, we find that there is never a good reason to suggest loop optimizations for functions or function optimizations for loops. Consequently, AutoSCOPE only emits suggestions with the loop attribute for loops and suggestions without the loop attribute for functions. For example, entry 1 in the above database does not have the loop attribute and is therefore not recommended for our example loop nest. Multiple function or loop filtering: Several of the optimizations in the database only apply if there are multiple important functions or loops. For instance, recommendations that require the reordering of functions or loops as well as recommendations to fuse multiple loops belong to this category. AutoSCOPE only makes such recommendations if multiple functions or multiple loops are included in PerfExpert’s output. This is why it excludes entry 5. Weighted LCPI ranking: Once the database entries with suitable attributes have been identified, they are ranked based on their category annotations. This is done by taking the LCPI values of the listed categories of each entry and adding them up. For instance, if a code section has a data access LCPI of 14.6 and a data TLB LCPI of 9.9, optimizations that help with data access bottlenecks will be ranked higher than optimizations that alleviate data TLB issues, but optimizations that help with both problems are ranked highest. In our example, AutoSCOPE computes the following weights: entry 3 = 22.7, entry 4 = 22.7, entry 6 = 12.8, entry 7 = 11.9, entry 8 = 3.0, and entry 2 = 1.7. Ranking-based filtering: Because the ranking not only orders the suggestions but also assigns a metric of relevance to them, AutoSCOPE is able to filter out recommendations that are unlikely to be relevant. It currently uses a 30% threshold for this purpose, i.e., suggestions whose relevance is
less than 30% of the most relevant recommendation are discarded. 30% of 22.7 is 6.81, so entries 8 and 2 are considered not relevant enough and are filtered out. Attribute-based tie breaking: Because there are over an order of magnitude more recommendations in our (growing) database than there are categories, the weighted LCPI ranking often yields multiple suggestions with the same rank. To break these ties, recommendations with more attributes (that must all match) are given priority. The intuition behind this approach is that an entry with more attributes is more specific and therefore more likely to be a good match for the given code section. Order-based tie breaking: If there are still ties left, AutoSCOPE uses the order in which the suggestions are listed in the database as the final tie breaker. This allows the database writer to indicate which optimizations should be listed first in case of a tie without having to resort to additional annotations. In our example, entry 3 will be listed before entry 4 even though both of them have the same ranking (see below for why this is a good order). Number-based filtering: This last step is optional and not enabled in the current version of AutoSCOPE. If too many suggestions are left, only the top k will be outputted, where k is a user selectable threshold. The purpose of this step is simply to curtail the list to no more than k suggestions so as not to clutter the output. Using the above ranking and filtering approach for the loop nest assessed in Figure 1 results in the recommendations shown in Figure 3, both for the full database as well as for the database shown in Figure 4. Even without knowing what this loop nest does, it makes sense to exclude entry 1 because it is not restricted to loops and will therefore be recommended for the function containing the loop nest, entry 2 because the L1 data cache does not represent the major performance bottleneck, entry 5 because we only have a single loop nest, and entry 8 because floating-point operations are not the major performance bottleneck. It also makes sense to recommend entry 3 over entry 4 because entry 3 requires only two nested loops whereas entry 4 requires three nested loops, making entry 3 more likely to apply in general (PerfExpert does not report the nesting depth to AutoSCOPE). Entry 6 only helps with L2 data cache and data memory access problems whereas entries 3 and 4 additionally help with data TLB problems. Thus, entries 3 and 4 should be listed before entry 6. Finally, entry 7 addresses DRAM page conflicts and thus primarily helps with memory issues, which is why it is listed last.
2.1 Suggestion relevance Applying the first transformation suggested by AutoSCOPE in Figure 3 results in the code shown in Figure 5. This optimization is simple. It improves the performance by a factor of 2.5 and eliminates all TLB problems.
for (i = 0; i < n; i++) for (k = 0; k < n; k++) for (j = 0; j < n; j++) c[i][j] += a[i][k] * b[k][j];
Figure 5: Matrix-matrix multiplication code after exchanging the j and k loops Applying the second transformation from Figure 3 yields the code shown in Figure 6. As this example illustrates, applying some optimizations is quite complex and the code examples are essential to show the programmer what needs to be done. In this case, all the user has to do after modifying the code appropriately is find a good value for the parameter s, which can be done using manual trials or autotuning. Applying this optimization eliminates the remaining data-access bottlenecks and improves performance by a factor of 5.2. At this point, the performance is very good and no further optimizations are needed. Hence, AutoSCOPE not only correctly identified useful code optimizations but also eliminated a large number of irrelevant or inapplicable recommendations from consideration, thus helping the user by focusing his or her attention on just a few optimizations that are targeted for this code section. for (k = 0; k < n; k += s) for (j = 0; j < n; j += s) for (i = 0; i < n; i++) for (kk = k; kk < k + s; kk++) for (jj = j; jj < j + s; jj++) c[i][jj] += a[i][kk] * b[kk][jj];
Figure 6: Matrix-matrix multiplication code after applying loop blocking
2.2 Extensibility Adding database entries is simple. The database is stored in plain text format. New entries can be added using any text editor. Of course, the new entries need to include proper category and attribute annotations. Using plain text also makes it easy to update existing entries, such as modifying a code example, adding compiler flags, or altering attributes. Adding extra categories is more involved. The database entries that correspond to the new category need to be annotated accordingly and the parser in AutoSCOPE has to be extended to recognize the new category. However, the rest of AutoSCOPE’s functionality, such as computing the weighted average of the LCPI values and displaying the results on a web page, can be reused. Adding new attributes requires the affected database entries’ annotations to be updated and AutoSCOPE to include a new function to recognize or compute the new attribute. For example, future versions of PerfExpert might output the loop nesting depth, which is currently not available. This would allow us, for instance, to annotate entry 3 in our sample database to require at least a doubly-nested loop. Such an annotation would prevent AutoSCOPE from recommending entry 3 for any non-nested loops.
3. Related work There are many performance evaluation tools with a wide range of approaches and functionalities. Performance tools may implement four functions: measurement, analysis based on the measurements, recommendation of sourcecode optimizations, and automation of source-code optimizations. The tools can be further classified by the basis for measurement and analysis: performance-counter-based versus event-trace-based and by whether the tool requires the source code to be annotated to generate measurements. Since the subject of this paper is derivation of recommendations for source-code optimizations for bottlenecks that are identified and characterized through performance-counter measurements and analyses, we only briefly mention papers that do not, in our best judgment, consider source-code optimizations or where the analyses are based on event traces. Tau [20], [25], PerfSuite [16], [22], HPCToolkit [12], [24], IPM [14], and Open|SpeedShop [19] are among the most powerful and widely used tools that provide performance-counter-based measurement and analysis. Each of these tools provides flexible and in-depth measurement and association of performance bottlenecks with source-code segments. Each tool provides the measurements and at least some of the analyses upon which optimization can be based but do not extend to recommendation of or automation of source-code optimizations. PerfExplorer [13] extends Tau with additional analysis and diagnostic capabilities. However, PerfExplorer uses event tracing, which can perturb the execution behavior, and does not recommend source-code optimizations. In contrast, PerfExpert bases its analysis and optimization recommendations upon data provided by HPCToolkit, which requires no annotation of the source code and uses performancecounter-based measurements to minimize perturbation. There are several tools that provide source-code optimizations for some types of bottlenecks. ThreadSpotter [26] captures information about data access patterns from a cache simulator and offers advice on related losses, specifically latency exposed due to poor locality, competition for bandwidth, and false sharing. It recommends possible optimizations for bottlenecks resulting from data accesses. PerfExpert attempts a more comprehensive diagnosis of bottlenecks, targeting not only data locality but also instruction locality, floating-point performance, etc. and recommends optimizations across this spectrum. ThreadSpotter does not attempt automated optimizations. SLO [2] uses cache profiling to measure data reuse distances and other locality metrics. It associates these measures with code segments, particularly loops, and suggests optimizations such as loop tiling or loop interchange. Paradyn [17], based on Dyninst [3], is a performance measurement tool for parallel and distributed programs. Performance instrumentation is inserted into the application and modified during execution. It associates bottlenecks
with specific causes and program parts but does not extend to recommending application optimizations. Periscope [11] collects and aggregates performance information through an agent-based approach. It provides identification of the source-code locations of performance bottlenecks and analyses of causes for the bottlenecks. MAQAO [9] is a performance analysis tool that combines performance counter measurements with static information to generate diagnoses. It derives the static information from the assembly code. It contains a knowledge base of important assembly patterns, which can be associated with hints for possible code optimizations. The IBM Productive, Easy-to-use, Reliable Computing System (PERCS) project [5], [6], [27] is building an automated system that detects and analyzes performance bottlenecks in application codes, identifies potential source-code optimizations, and includes automated optimization capabilities. The Bottleneck Detection Engine (BDE), which is the core of the framework, utilizes a database of rules to detect bottlenecks in the given application. The BDE feeds the information on bottleneck locations, including metrics associated with the bottlenecks, to the user. It may also suggest how much improvement could be obtained by the optimization of a given bottleneck. In addition to suggestions to the user, IBM’s tool also supports directly modifying the source code and applying standard transformations through the compiler. The limitation of PERCS is that it requires the use of IBM’s proprietary software stack including its compilers. Systems that base their analyses on event traces include KOJAK [18], KappaPI [10] and the Parallel Performance Wizard [23]. KOJAK aims at the development of a generic automatic performance analysis environment for parallel programs. The Parallel Performance Wizard attempts automatic diagnosis as well as automated optimization. It is, however, based on event trace analysis and requires program instrumentation. Its primary applications have been problems associated with the partitioned global address space (PGAS) programming model, although it applies to other performance bottleneck issues as well. Cray’s ATExpert [15] graphically displays the performance of parallel programs. It points the user to specific problem areas in the source code, tries to explain why the problems are occurring, and suggests steps to resolve them. It does not provide code templates or rank suggestions. The Performance Engineering Research Institute (PERI) Autotuning project [1] combines measurement and searchdirected auto-tuning in a multistep process to obtain automated optimization. It can be viewed as a special case of an expert system where one flexible solution method is applied to all types of bottlenecks. It is unclear whether autotuning by itself can effectively optimize the wide spectrum of bottlenecks that arise when executing complex codes on multicore chips and multi-socket nodes. We hope to be able to incorporate methods from this project in the optimization capabilities of a future version of PerfExpert.
4. Evaluation methodology 4.1 System We used the PerfExpert installation on Ranger, the supercomputing Sun Constellation Linux Cluster at the Texas Advanced Computing Center. Ranger contains 3,936 16way SMP compute nodes made of 15,744 quad-core 2.3 GHz AMD Opteron (Barcelona) processors, i.e., 62,976 compute cores. It has 123 TB of main memory, 1.7 PB of global disk space, and a theoretical peak performance of 579 TFLOPS. All compute nodes are interconnected using InfiniBand in a seven-stage full-CLOS fat-tree topology providing 1 GB/s point-to-point bandwidth.
4.2 Applications We have tested AutoSCOPE on MANGLL/DGADVEC, HOMME, and LIBMESH/EX18. These large-scale HPC programs represent various application domains. They were all compiled with the Intel compiler v10.1. MANGLL is a scalable adaptive high-order discretization library. It supports dynamic parallel adaptive mesh refinement and coarsening, which is essential for numerical solution of the partial differential equations (PDEs) arising in many multiscale physical problems. DGADVEC is an application built on top of MANGLL for the numerical solution of the energy equation that is part of the coupled system of PDEs arising in convection simulations, describing the viscous flow and temperature distribution in Earth’s mantle. MANGLL and DGADVEC are written in C. HOMME is an atmospheric general circulation model consisting of a dynamical core based on the hydrostatic equations, coupled to sub-grid scale models of physical processes. The HOMME code is designed to provide 3D global atmospheric simulation similar to the Community Atmospheric Model. The benchmark version of HOMME we are using was one of NSF’s acceptance benchmark programs for Ranger. It is written in Fortran 95. The LIBMESH library provides a framework for the numerical approximation of partial differential equations using continuous and discontinuous Galerkin methods on unstructured hybrid meshes. It supports parallel adaptive mesh refinement computations as well as 1D, 2D, and 3D steady and transient simulations on a variety of popular geometric and finite element types. EX18 uses LIBMESH to solve the transient nonlinear problem using the objectoriented FEMSystem class framework. LIBMESH and EX18 are written in C++.
5. Results This section compares the suggestions produced by AutoSCOPE with actual optimizations that performance experts implemented to accelerate large-scale HPC codes. Due
to space reasons, we only show one key loop per program. Figure 7 shows the recommendations AutoSCOPE makes for the most important loop in LIBMESH/EX18. This loop performs a large number of memory accesses, most of which hit in the L1 data cache, and quite a few floating-point operations. Hence, AutoSCOPE focuses on suggestions that reduce the number of load instructions, boost the bandwidth to the L1 data cache, and reduce the number of floating-point instructions. Loop in function NavierSystem::element_time_derivative(…) (23.3% of runtime) move loop invariant memory accesses out of loop loop i {a[i] = b[i] * c[j]} → temp = c[j]; loop i {a[i] = b[i] * temp;} enable the use of vector instructions to transfer more data per access align arrays, use only stride-one accesses, make loop count even (pad arrays) struct {double a, b;} s[63]; for (i = 0; i < 63; i++) {s[i].a = 0; s[i].b = 0;} → __declspec(align(16)) double a[64], b[64]; for (i = 0; i < 64; i++) {a[i] = 0; b[i] = 0;} use the “-opt-streaming-stores always” compiler flag move loop invariant computations out of loop loop i {x = x + a * b * c[i];} → temp = a * b; loop i {x = x + temp * c[i];}
Figure 7: Condensed AutoSCOPE recommendations for the most important loop in EX18 When we manually optimized this code (before AutoSCOPE existed), we obtained a substantial speedup by applying the first and third recommendation, i.e., by factoring out common subexpressions involving memory accesses and by moving loop invariant code [4]. Based on simple tests, the author of EX18 had assumed that the compiler would do this automatically. However, several of the common subexpressions we found involve C++ templates and most of them use pointer indirections, which seem to make the code too complex for the compiler to optimize. These simple optimizations (for a human) made the loop 32% faster, yielding an application-wide speedup of 5%. Figure 8 shows AutoSCOPE’s recommendations for one of the two key loops in DGADVEC. This loop’s performance profile is quite similar to that of the EX18 loop discussed above except it performs significantly more floatingpoint operations. Hence, the recommendations are similar but the order in which they are listed is different. Loop in function dgadvecRHS() at dgadvec.c:993 (19.4% of total runtime) move loop invariant computations out of loop loop i {x = x + a * b * c[i];} → temp = a * b; loop i {x = x + temp * c[i];} componentize loops by factoring them into their own subroutines ... loop i {...} ... loop j {...} ... → void li() {...}; void lj() {...}; ... li(); ... lj(); ... move loop invariant memory accesses out of loop loop i {a[i] = b[i] * c[j]} → temp = c[j]; loop i {a[i] = b[i] * temp;} enable the use of vector instructions to transfer more data per access align arrays, use only stride-one accesses, make loop count even (pad arrays) struct {double a, b;} s[63]; for (i = 0; i < 63; i++) {s[i].a = 0; s[i].b = 0;} → __declspec(align(16)) double a[64], b[64]; for (i = 0; i < 64; i++) {a[i] = 0; b[i] = 0;} use the “-opt-streaming-stores always” compiler flag
Figure 8: Condensed AutoSCOPE recommendations for the most important loop in DGADVEC Together with the developers of DGADVEC, we have been able to accelerate this loop through vectorization. The
primary performance problem is the L1 load-to-use hit latency of three cycles, which cannot be hidden as there are not enough independent instructions available to execute. Since this latency is fixed in hardware, we can only reduce the average latency by increasing the bandwidth, i.e., accessing multiple data items per memory transaction through the use of SSE instructions. Hence, we rewrote the loop so that the compiler can vectorize it [8] (i.e., we applied the fourth recommendation). Comparing the old and new loop implementations, we found that the number of executed instructions is 44% lower and the number of L1 data-cache accesses is 33% lower due to the vectorization [4]. Figure 9 shows the optimization suggestions for an important loop in HOMME, which has also been manually tuned. This loop suffers primarily from bad memory access performance. Many of the accesses miss in all cache levels and go to main memory. As a consequence, AutoSCOPE recommends optimizations that aim at helping the compiler optimize the code better, enhance the memory access patterns, and improve the main memory latency. Loop in function preq_robert() at prim_si_mod.F90:846 (8.9% of total runtime) componentize loops by factoring them into their own subroutines ... loop i {...} ... loop j {...} ... → void li() {...}; void lj() {...}; ... li(); ... lj(); ... change the order of loops loop i { loop j {...} } → loop j { loop i {...} } employ loop blocking and interchange loop i {loop k {loop j { c[i][j] = c[i][j] + a[i][k] * b[k][j];}}} → loop k step s {loop j step s {loop i {for (kk = k; kk < k + s; kk++) {for (jj = j; jj < j + s; jj++) {c[i][jj] = c[i][jj] + a[i][kk] * b[kk][jj];}}}}} apply loop fission so every loop accesses just two different arrays loop i {a[i] = a[i] * b[i] - c[i];} → loop i {a[i] = a[i] * b[i];} loop i {a[i] = a[i] - c[i];} move loop invariant computations out of loop loop i {x = x + a * b * c[i];} → temp = a * b; loop i {x = x + temp * c[i];}
Figure 9: Condensed AutoSCOPE recommendations for an important loop in HOMME A performance expert has successfully sped up this loop by applying microfission (the fourth recommendation) to reduce DRAM page conflicts, which makes the main memory accesses substantially faster [4], [7]. On a Ranger node, only 32 DRAM pages can be open at once. With 16 threads running on the 16 cores of a node, each thread can access at most two different memory areas simultaneously without losing performance. Thus, applying microfission so that each loop only processes two arrays eliminates DRAM page conflicts. However, because the compiler automatically fuses the loops, it was necessary to also break out each loop into a separate procedure (the first recommendation), which results in a 62% speedup and much better core utilization.
6. Conclusion and future work AutoSCOPE helps programmers by automatically recommending source-code optimizations and compiler flags for alleviating node-level performance bottlenecks that have been identified by the PerfExpert measurement and analysis
tool. AutoSCOPE processes PerfExpert’s output using a set of rules to identify matching recommendations in its annotated database. It then ranks these recommendations to select the most appropriate ones. AutoSCOPE is constructed as an extensible framework to which we can add annotations and rules to extend its capabilities or to adapt it to different execution environments. Our evaluation on real HPC applications has demonstrated almost 100% conformance to human expert optimization selections. While the output sometimes still includes inapplicable suggestions, AutoSCOPE correctly eliminates over 95% of the suggestions from the database that do not apply, thus helping the user a great deal by focusing his or her attention on just a few targeted optimizations. In future work, we plan to add more rules and annotations to further improve the selection quality and to apply selected source-code optimizations automatically for straightforward cases.
7. References [1] D. Bailey, J. Chame, C. Chen, J. Dongarra, M. Hall, J. Hollingsworth, P. Hovland, S. Moore, K. Seymour, J. Shin, A. Tiwari, S. Williams, and H. You. “PERI AutoTuning.” Journal of Physics: Conference Series, 125(1):012089, 2008. [2] K. Beyls and E. D’Hollander. “Refactoring for Data Locality.” IEEE Computer, Vol. 42, no. 2, pp. 62-71. 2009. [3] B. R. Buck and J. K. Hollingsworth. “An API for Runtime Code Patching.” Journal of High Performance Computing Applications, 14:317-329. 2000. [4] M. Burtscher, B.D. Kim, J. Diamond, J. McCalpin, L. Koesterke, and J. Browne. “PerfExpert: An Easy-to-Use Performance Diagnosis Tool for HPC Applications.” SC 2010 Int. Conference for High-Performance Computing, Networking, Storage and Analysis. November 2010. [5] Chung, G. Cong, D. Klepacki, S. Sbaraglia, S. Seelam, and H-F. Wen. “A Framework for Automated Performance Bottleneck Detection.” 13th Int. Workshop on High-Level Parallel Programming Models and Supportive Environments. 2008. [6] G. Cong, I-H. Chung, H. Wen, D. Klepacki, H. Murata, Y. Negishi, and T. Moriyama. “A Holistic Approach towards Automated Performance Analysis and Tuning.” Euro-Par 2009. 2009. [7] J. Diamond, M. Burtscher, J. McCalpin, B.D. Kim, S. Kecker, and J. Browne. “Making Sense of Performance Counter Measurements on Supercomputing Applications.” 2011 IEEE International Symposium on Performance Analysis of Systems and Software. April 2011. [8] J. Diamond, B.D. Kim, M. Burtscher, S. Keckler, K. Pingali, and J. Browne. “Multicore Optimization for Ranger.” 2009 TeraGrid Conference. June 2009. [9] L. Djoudi, D. Barthou, P. Carribault, C. Lemuet, J.-T. Acquaviva, and W. Jalby. “Exploring Application Performance: a New Tool for a Static/Dynamic Approach.” The Sixth Los Alamos Computer Science Institute Symp. 2005.
[10] Antonio Espinosa, Tomas Margalef, and Emilio Luque. “Automatic detection of parallel program performance problems.” SIGMETRICS Symposium on Parallel and Distributed Tools, p. 149. 1998. [11] M. Gerndt and M. Ott. “Automatic performance analysis with Periscope.” Concurrency Computation: Practice and Experience. 2009. [12] HPCToolkit: http://www.hpctoolkit.org/. Last accessed April 1, 2011. [13] K. A. Huck, A. D. Malony, S. Shende, and A. Morris. “Knowledge Support and Automation for Performance Analysis with PerfExplorer 2.0.” Large-Scale Programming Tools and Environments, Special Issue of Scientific Programming, vol. 16, no. 2-3, pp. 123-134. 2008. [14] IPM: http://ipm-hpc.sourceforge.net/. Last accessed April 1, 2011. [15] J. Kohn and W. Wiliams. “ATExpert.” Journal of Parallel and Distributed Computing, 18:2, pp. 205-222. 1993. [16] Rick Kufrin. “PerfSuite: An Accessible, Open Source Performance Analysis Environment for Linux.” 6th Int. Conference on Linux Clusters: The HPC Revolution. 2005. [17] B. P. Miller, M. D. Callaghan, J. M. Cargille, J. K. Hollingsworth, R. B. Irvin, K. L. Karavanic, K. Kunchithapadam, and T. Newhall. “The Paradyn Parallel Performance Measurement Tool.” IEEE Computer, 28:37-46. 1995. [18] B. Mohr and F. Wolf. “KOJAK - A Tool Set for Automatic Performance Analysis of Parallel Applications.” Int. Conference on Parallel and Distributed Computing. 2003. [19] Open|SpeedShop: http://www.openspeedshop.org/wp/. Last accessed April 1, 2011. [20] S. Shende and A. Malony. “The Tau Parallel Performance System.” International Journal of High Performance Computing Applications, 20(2): 287-311. [21] PerfExpert: http://www.tacc.utexas.edu/perfexpert/. Last accessed April 1, 2011. [22] PerfSuite: http://perfsuite.ncsa.uiuc.edu/. Last accessed April 1, 2011. [23] H-H. Su, M. Billingsley, and A. D. George. “Parallel Performance Wizard: A Performance Analysis Tool for Partitioned Global-Address-Space Programming.” 9th Int. Workshop on Parallel & Distr. Scientific and Engineering Computing. 2008. [24] N. R. Tallent, J. M. Mellor-Crummey, L. Adhianto, M.W. Fagan, and M. Krentel. “HPCToolkit: performance tools for scientific computing.” Journal of Physics: Conference Series, 125. 2008. [25] Tau: http://www.cs.uoregon.edu/research/tau/home.php. Last accessed April 1, 2011. [26] ThreadSpotter: http://www.roguewave.com/products/threadspotter.aspx. Last accessed April 1, 2011. [27] H. Wen, S. Sbaraglia, S. Seelam, I. Chung, G. Cong, and D. Klepacki. “A productivity centered tools framework for application performance tuning.” Fourth International Conference on the Quantitative Evaluation of Systems, pp. 273-274. 2007.