Basic Techniques in Text Mining using Open-source Tools Jun Iio Socio-Informatics, Faculty of Letters, Chuo University 742–1 Higashinakano, Hachioji-shi Tokyo 192–0393, Japan
[email protected] ABSTRACT There are many text mining tools provided commercially and non-commercially. However, the elementary text-based analysis can be done with basic Unix commands, shell-scripts, and small program of scripting languages, instead of using such extensive software. This paper introduces the basic techniques for text mining, using combination of a set of standard commands, small code, and generic tools provided as the open-source software. The target of the analysis are sixty-seven articles written by one author in a relay column since 1998. Several text-based analyses reveals a trend of interest moved within about fifteen years. In addition, at the end of this paper, the results of text-based analysis are compared with that of non-text-based analysis and the efficiency of non-parametric analysis is discussed.
Categories and Subject Descriptors H.4 [Information Systems Applications]: Miscellaneous; I.7 [Document and Text Processing]: Miscellaneous— text mining, clustering
Keywords text mining, open-source, visualization
1.
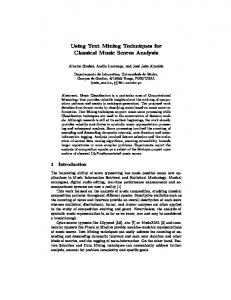
Figure 1: An author index page. The red box shows the list of links to the articles previously posted by the author. analysis and it was expected that the result could show the movement of his interest for a decade. This paper shows procedures and results of the analysis.
INTRODUCTION
A dozen research analysts and consultants working for Mitsubishi Research Institute, Inc. are engaged in the relay column1 named “Take IT Easy,” which is a series of essays explaining some topics in the information technology area. In 2010, Iio et al. tried to illustrate that some text-based analyses could reveal tendencies of the information technology trend[3]. In this study, the scope of the analysis was set narrower than the previous study. The sixty-seven articles that were written by one author from the beginning of the relay column were set as the target of the text-based
2.
1
Firstly, get the target data ready to analyze. In this case, the bunch of text files can be downloaded from a page which has a list of articles previously published (Figure 1). The list contains the URLs of backnumbers can be extracted from the page. The list of URLs makes the articles downloaded automatically, using a shell script and wget command. The articles contains unnecessary parts such as the title banner, related links, and the link to previous articles. These garbage should be eliminated before proceeding to the mining process. Since the target area is surrounded with the
http://easy.mri.co.jp/ (in Japanese)
Permission to make digital or hard copies of all or part of this work for personal or classroom use is granted without fee provided that copies are not made or distributed for profit or commercial advantage and that copies bear this notice and the full citation on the first page. To copy otherwise, to republish, to post on servers or to redistribute to lists, requires prior specific permission and/or a fee. WikiSym’13, Aug 05-07 2013, Hong Kong, China ACM 978-1-4503-1852-5/13/08. http://dx.doi.org/10.1145/2491055.2491099
PREROCESS AND VISUALIZATION
There are many text mining tools provided commercially and non-commercially[2, 4]. This paper introduces the elementary text-based analysis using simple open-source tools instead of such complicated software. In this section, some preparation steps as preprocessing for the clustering analysis and simple visualization using word cloud are explained.
2.1
Scraping Text Data from WWW
Figure 3: A word cloud made from the sixty-seven articles. Figure 2: An example of the article page. The red box shows the target area surrounded with
and
.
tags
and
, it can be easily extracted by a simple perl script. Next thing we have to do is conversion from HTML files to simple text files. It is easy to convert a set of files from HTML to text, by using a shell script and w3m command. w3m is a text-based WWW browser, which can render HTML documents in a character terminal. Its -dump option enables it being used as converter instead of browser. If you can access a database at where blog articles are stored, there would be an option to get text data by issuing SQL commands to the database management system (DBMS). Note that there are possibilities that target data contains irregular values2 . In this case example, the article published on 17th July 2012 has a long code written in the programming language C as an appendix of the article. These kind of data may have bad effect, so it should be eliminated in the data cleaning process.
2.2
Splitting Word Fragments
The text mining analysis on Japanese document needs a process of Japanese language morphological analysis. English sentence, for example, “A quick brown fox jumps over the lazy dog.” is easier to be separated by white space as delimiters of separation. However, in general, words are concatenated in Japanese sentences like “Niwanihaniwa, niwatorigaimasu3 ” which should be separated into “Niwa ni ha niwa, niwatori ga i masu.” The process is called Japanese language morphological analysis. For the Japanese morphological analysis, useful tools such as chasen and mecab have been developed and published as open-source software. Japanese text data would be cut into a sequence of words using chasen command and shell-/perlscripts4 . 2 In the case of text mining, irregular value means irregular text messages. 3 Practically, this is written in Japanese characters. 4 Unfortunately, chasen has a weak point that it does not work well for English words. Therefore, to handle English words appearing in Japanese documents, another shell script
In these steps, the data showing how frequently the word was used in which article can be acquired. Next, we should consider how it would be represented as easy-to-understand visualization.
2.3
Visualization by Word Cloud
The visualization tools including tag-cloud and word-cloud, etc. can help to grab the tendency of occurrence rate of words in documents. There are many web services to make word cloud images in the Internet. Each implementation has various differences, such as whether it can handle Japanese characters and words, the flexibility of shapes, direction of words, and customization of fonts and colors. Thus, you can choose them as you like. For example, a visualized image made by a web-service named ‘tagxedo5 ’ is shown here. The result shows clearly that I have been talked mainly about ‘software’ and ‘information’ over fifteen years. ‘System’ and ’technology development’ are important words as well. Topics regarding my major such as open-source and user-interface have been also explained in my articles. This kind of illustration is easy enough to understand and is appropriate to show a trend of keywords in a series of documents.
3.
CLUSTERING ANALYSIS
Now, it is ready to move on to the next stage, a relatively complicated analysis.
3.1
Hierarchical Clustering
For counting word-occurrence rate, standard commands such as sort and uniq are convenient and useful. Consider to extract the words that appear more than n−times, and to represent the characteristic of each article with the occurrence rate vector6 . That means a clustering analysis is conducted in a vector space whose axes are spanned by wordoccurrence count. Of course, each article has focus on the different topics. Hence, the occurrence count matrix would be a sparse maand sed command should be adopted to sum up such words correctly, in addition. 5 http://www.tagxedo.com 6 In this case, the threshold n is set to 5.
trix which elements are almost 0. However, on theoretical grounds, each article is represented as a point in the space. Therefore, a distance between an article and another article can be calculated. Based on the distances among articles, we can consider the hierarchical clustering analysis. Making an image of the hierarchical clustering is easy if the statistical package the R environment is used. R is also provided as open-source software. The result of the clustering process is shown in Figure 4. Though the number of clusters depends on the threshold value, you can find eight clusters in the Figure 4, in this case.
3.2
Result of Clustering
The result of clustering tells that each clusters can be labeled as follows: • Topics on programming language C, • Importance of source code, • Issues on open-source software, • The Internet and the wisdom of crowds7 , • Personal computing and information society, • System and its userbility, • Multi-modality and user interface. Many blog-systems and CMS have a function to add ‘tags’ on each article. Therefore, users of such system can classify their articles in terms of the tags, manually. Alternatively, folksonomy can be applied to classify the articles, semi-automatically. It should be insightful to compare the classification results of the analysis described in this paper and the classification by tags or by folksonomy.
4.
COMPARISON AGAINST NCD-BASED CLASSIFICATION
In order to confirm validity of the classification, it was compared with another result of clustering with the method of normalized compression distance (NCD). NCD is the distance d between two digital data a and b, defined as follows: d(a, b) = (C(a, b) − min(C(a), C(b)))/ max(C(a), C(b)) where C(a, b), C(a), and C(b) mean “the compressed size of the concatenation of a and b, “the compressed size of a,” and “that of b,” respectively. It is remarkable that whatever the data a and b are NCD can be calculated and that NCD depends only on the compression rate. That is, it can be considered as one of the non-parametric analysis. CompLearn8 [1] provides several tools, ncd, maketree, etc. to calculate the value of NCD between two files. The calculation on files containing the articles resulted in the tree whose leaf corresponds to each article, shown in Figure 5. Colors in leaves were painted corresponding to the colors of the classification by the hierarchical clustering based on the text mining previously described (Figure 4). Comparing Figure 4 and 5, the similarity of classification between two different methods can be found. 7 This category includes articles on consumer generated media (CGM) and social network service (SNS). 8 http://www.complearn.org/
Figure 4: The result of the hierarchical clustering according to the word-occurrence count on each article. The dotted red line shows the threshold to separate articles into the eight clusters.
Figure 5: A tree generated by ncd, maketree, and neato, based on the files of the sixty-seven articles.
5.
CONCLUSIONS
In this paper, a case example of entry-level text mining process using some Unix’s standard commands and opensource tools has been explained. In these steps, visualization has important role to explain the results of analyses. Visual graphics such as word cloud, hierarchical cluster, and tree graph shown in this paper are rich enough for conveying information and they can be easily created by combination of open-source tools. As described at the beginning of this paper, there are many open-source software for text mining research. Such software enables researchers to gain insights from text data in depth. However, in such case, it needs to keep in mind that the basic techniques explained in this paper are useful as well.
6.
REFERENCES
[1] R. L. Cilibrasi and P. M. B. Vit´ anyi. Clustering by compression. IEEE Transactions on Information Theory, 51(4):1523–1545, April 2005. [2] V. Gupta and G. S. Lehal. A survey of text mining techniques and applications. Journal of Emerging Technologies in Web Intelligence, 1(1):60–76, August 2009. [3] J. Iio, S. Udoguchi, and Y. Shirai. Information technology trends in a decade revealed by text-mining. In The 3rd IEEE Pacific Visualization Symposium (PacificVis2010) Poster Proceedings, pages 17–18, March 2010. [4] M. K. Wright. Using open source tools in text mining research, 2012.