Battlefield Visualization and Database Creation System Using One Meter Terrain SUBMITTED FOR MODELING AND SIMULATION WORKSHOP DECEMBER 12-15, 2005, LAS CRUCES, NM Wolfgang Baer Associate Professor Department of Information Science, Code IS, Naval Postgraduate School, Monterey, CA 93943;
[email protected]; Tel 831-656-2209. Todd Ross Campbell Transformation Technology Directorate, USAOTC, 91012 Station Avenue, Fort Hood, TX 76544-5068; ;
[email protected]; Tel 254-288-1802. Nikolaus Baer Nascent Systems Inc. ,380 W. Carmel Valley Rd. Carmel Valley Ca 93924;
[email protected]; Tel/Fax 831- 6590432 Abstract: Integration of battlefield simulation systems in operational scenarios requires the accurate calculation of concealment, cover, and detectability to properly enhance the soldier’s performance and effectiveness on the battlefield. Measurement and visualization of tactical battlefield features requires the generation of metrically accurate terrain databases at high resolution over large areas. Systems capable of generating and utilizing such data have been expensive and slow. A low cost PC based system has been designed to address the generation and utilization of one-meter resolution terrain in large area, tactical battlefield simulations. The architecture and development is designed to incrementally approach the performance of human vision systems. Technical features described include an efficient all integer based ray trace algorithm, which allows video realistic battlefield visualization from girded sensor derived data, a multi-theme variable resolution ground descriptor database, real time rendering table to accommodate season, lighting and sensor variations and tools for rapid in field data correction and updating. The system is called Perspective View Nascent Technologies (PVNT). The package has been developed as a research project by the Naval Postgraduate School, TRADOC, OTC Ft. Hood and Nascent Systems Inc. It’s major advantages are that it runs on a Laptop PC, contains an extremely efficient ray trace algorithm, performs real time rendering, handles complex surface features for low angle oblique views, and is freely available to DOD users. KEYWORDS: Simulation, Battlefield Visualization, High Resolution Terrain, 3-D Imaging,
Target Mensuration , Mission Rehearsal, Live Virtual Weapons Testing, Human Vision Topic area: 3) High Performance Computing in T&E or 7) M&S Technologies
Form Approved OMB No. 0704-0188
Report Documentation Page
Public reporting burden for the collection of information is estimated to average 1 hour per response, including the time for reviewing instructions, searching existing data sources, gathering and maintaining the data needed, and completing and reviewing the collection of information. Send comments regarding this burden estimate or any other aspect of this collection of information, including suggestions for reducing this burden, to Washington Headquarters Services, Directorate for Information Operations and Reports, 1215 Jefferson Davis Highway, Suite 1204, Arlington VA 22202-4302. Respondents should be aware that notwithstanding any other provision of law, no person shall be subject to a penalty for failing to comply with a collection of information if it does not display a currently valid OMB control number.
1. REPORT DATE
3. DATES COVERED 2. REPORT TYPE
DEC 2005
00-00-2005 to 00-00-2005
4. TITLE AND SUBTITLE
5a. CONTRACT NUMBER
Battlefield Visualization and Database Creation System Using One Meter Terrain
5b. GRANT NUMBER 5c. PROGRAM ELEMENT NUMBER
6. AUTHOR(S)
5d. PROJECT NUMBER 5e. TASK NUMBER 5f. WORK UNIT NUMBER
7. PERFORMING ORGANIZATION NAME(S) AND ADDRESS(ES)
Naval Postgraduate School,Department of Information Science,Code IS,Monterey,CA,93943 9. SPONSORING/MONITORING AGENCY NAME(S) AND ADDRESS(ES)
8. PERFORMING ORGANIZATION REPORT NUMBER
10. SPONSOR/MONITOR’S ACRONYM(S) 11. SPONSOR/MONITOR’S REPORT NUMBER(S)
12. DISTRIBUTION/AVAILABILITY STATEMENT
Approved for public release; distribution unlimited 13. SUPPLEMENTARY NOTES
Modeling and Simulation Conference, 2005 Dec 12-15, Las Cruces, NM 14. ABSTRACT
Integration of battlefield simulation systems in operational scenarios requires the accurate calculation of concealment, cover, and detectability to properly enhance the soldier?s performance and effectiveness on the battlefield. Measurement and visualization of tactical battlefield features requires the generation of metrically accurate terrain databases at high resolution over large areas. Systems capable of generating and utilizing such data have been expensive and slow. A low cost PC based system has been designed to address the generation and utilization of one-meter resolution terrain in large area, tactical battlefield simulations. The architecture and development is designed to incrementally approach the performance of human vision systems. Technical features described include an efficient all integer based ray trace algorithm, which allows video realistic battlefield visualization from girded sensor derived data, a multi-theme variable resolution ground descriptor database, real time rendering table to accommodate season, lighting and sensor variations and tools for rapid in field data correction and updating. The system is called Perspective View Nascent Technologies (PVNT). The package has been developed as a research project by the Naval Postgraduate School, TRADOC, OTC Ft. Hood and Nascent Systems Inc. It?s major advantages are that it runs on a Laptop PC, contains an extremely efficient ray trace algorithm, performs real time rendering, handles complex surface features for low angle oblique views, and is freely available to DOD users. 15. SUBJECT TERMS 16. SECURITY CLASSIFICATION OF: a. REPORT
b. ABSTRACT
c. THIS PAGE
unclassified
unclassified
unclassified
17. LIMITATION OF ABSTRACT
18. NUMBER OF PAGES
Same as Report (SAR)
15
19a. NAME OF RESPONSIBLE PERSON
Introduction 1) Introduction: A high-resolution terrain simulation program and database creation system is being developed at the Naval Postgraduate School in Monterey, CA. The architecture and development philosophy of this program is designed to allow incremental development of a database generation and visualization system to approach the capabilities of the human vision system. Component features and progress toward this goal is described in the sections below.
2) Background: The US Army test facility at Ft. Hunter Liggett, CA (FHL) developed a high fidelity battlefield replication system during the early 90’s. This system provided the capability to generate a 1 meter terrain database and a 1cm target view database for use in weapon substitution, command and control applications, and after action test review in force-on-force operational field tests. The system has been relocated for operation at other sites such as Ft. Hood, TX and has been used to generate new databases to operate at other locations such as Yuma, Az., Camp Roberts CA. and Camp Shelby, Ms. Several years ago investigation of porting costs, performance, and platform cost analysis had shown that both the cost and maintenance of future systems would greatly benefit from the utilization of low cost PC hardware and standard software. A combination of NPS student and research efforts has successfully ported the perspective view generation and line-of site software to a PC NT platform. The code is called Perspective View Nascent Technologies (PVNT). The availability of high speed low cost PC based workstations at substantially lower prices than those currently employed to host the software has greatly enhanced the cost effectiveness of one meter and higher resolution terrain databases. The PVNT software package provides an immediate suit of current capabilities described in the next section, however its primary utility, in the opinion of the authors, is as an experimental platform for within which real world simulations at the tactical level can be implemented. Demonstrations and tutorials, have been made available on-line and source code is provided for all DOD users and related contractors. Nascent Systems Inc. is now maintaining the code
3) Current Capabilities Current capabilities of the PVNT system include perspective views, line-ofsight, weapons effectiveness maps, target mensuration, and database generation capabilities. These are presented using a series of screen prints of PVNT output and discussed in the paragraphs provided below. Figure 1 on the left shows a perspective view of two helicopters over Ft. Hunter Liggett terrain. The terrain features show trails, bushes. These features are on the order of one meter and are accurately placed to approximately two meters. Pictures are generated under joy stick control at better than 30 frames per second on a high-end PC. Figure 1- PVNT 3D VIEW SCREEN CAPTURE
Figure 2, on the right shows a screen capture of PVNT windows used in Lineof-Sight analysis. Two perspective views are generated and displayed in the upper left and right windows. At the center bottom a map view shows a red and a blue color area, which are being seen in each of the respective viewer. Both the perspective views and ground visibility cones move in real time under joystick control.
Figure 2 - MULTI-WINDOW SCREEN CAPTURE OF PVNT
PVNT is now operating on standard PC platforms under Windows NT, Windows 98 and Windows 2000. Frame rates of 60fps are sustained on a Quad 700Mhz Pentium. Reasonable performance is achieved on hardware costing less than $2000. The code is demonstrable, reasonably stable, and specialized versions have been used to support operational tests such as the Rotary Pilots Associate Test conducted by US Army TEXCOM at Yuma during the Summer of 1999. The system is also being used for tactical weapons design (US ARMY TRADOC, AMRDEC), and After Action Review (US ARMY OPTEC Ft. Hood). It is ideal for mission rehearsal and training systems requiring close combat air support or helicopter missions. An example use of the PVNT software done for AMRDEC Huntsville for weapons effectiveness comparison between a TOW 2B and a TOW FF (fire and forget design) is shown in Figure 3 below.
Figure 3 - PVNT screen capture showing the route for Stony Valley and the corresponding Fire Opportunities Map for Route Node 0
Target routes of interest were selected in a 1-meter terrain data set. Hit probabilities were calculated for each route point from all possible attack positions within a four km radius. Figure 3 shows the result for a single route point. The red colors
indicate those ground areas from which the single route point can be attacked by a TOW 2B and TOW FF weapon. The green colors indicate those ground areas from which the single route point can only be attacked by a TOW FF weapon. The additional successful attack areas of the TOW FF provides a measure of weapon effectiveness. Since the accuracy of the result depends upon Line-of-Sight calculations that require detailed knowledge of the terrain, this simulation could only be done in a simulator using onemeter or better terrain resolution.
3.1) New Uses for one-meter Terrain We feel the availability of extremely low-cost, sensor realistic, real-time perspective view, and line-of-site capability on one- meter terrain (micro-terrain) provides a technical cornerstone for a variety of DOD applications. A non-inclusive list of applications is provided below: -Line of Sight Server -Perspective View generator -Prototype Weapons Effectiveness (ST) Diagrams -Image Targeting System -Real Time UAV Data Extraction System and UAV vision systems -Tactical Micro-terrain Supported Component of Simulation Based Weapons Design and Acquisition -Reconnaissance Image Analysis System -After Action Review System -Mission Rehearsal and Planning Systems One of the major current obstacles to further utilization of advanced highresolution terrain is the availability of high-resolution terrain data in a timely fashion for the war fighter. We at NPS are performing research to develop a tool and techniques to solve this problem for the tactical commander in the 21'st century.
3.2) Current Database Generation Capability PVNT addresses the need for timely databases in two ways. First, PVNT allows for the importing of a standard DTED world-wide database, which is available for download through existing communication channels or can be ordered from NGA. Then it imports ortho-photo data typically available from aerial survey contractors, NGA databases, or Internet download sources such as TerraServer. Second, the development of local update tools, which allow new information gathered by local sensors and data reports to improve and enhance the information in the database. Typically identification of local features as well as the measurement and modeling of their attributes have to be done on the fly. PVNT has been provided with an extensive database editing and feature modeling capability. As an example Figure 4 shows (left) a gray shade histogram slice identification of trees and bushes over a sample terrain. The program measures the size and shape of identified features and executes a three-dimensional modeling program in order to fit the best tree outline to the measured feature. The result is shown in figure 4
(right). Here the modeled vegetation height is shown as a pseudo-color display. Green is a low vegetation height while red is a tall tree.
Figure 4 – Example of Terrain Feature Identification and Modeling in PVNT The current structure of PVNT allows for the insertion of 3D models for a large variety features, which might be encountered on the terrain. As of the writing of this paper only a limited number of such models have actually been integrated. Automated model assisted terrain analysis greatly reduces the operator time to identify and add metrically accurate features to the terrain database. Operator interactive terrain editing tools have been supplied to allow the operator to update the database in the field whenever new information is available. Automated tools, which analyze the difference between measured images from the field and the best calculated images, and then use this difference to improve the database accuracy are being developed at NPS. Research is being pursued to automate the data generation procedure. We hope that in the future, automated processing of battlefield sensor data-streams (such as those from a remotely piloted vehicle) will become a reality.
4) Automatic Database Update as Vision System Design Uses for terrain data as described in section 3.1 above are only practical if databases exist in the areas in which live operations are required. Operational test facilities such as Ft. Hood, YPG, and FHL provide controlled geographic areas without potential conflict. In these areas databases have been built utilizing aerial photography and traditional aero triangulation methods to extract elevation models at the one-meter resolution level. In order to reduce the cost of generating such databases, improve the accuracy of the features, and allow the operation in potentially hostile environment in which controlled sensors cannot be guaranteed, new automatic terrain generation systems will be required. The goal of such systems is to mimic the capability of the human eyebrain vision system in reliability and capacity to operate in noisy real world
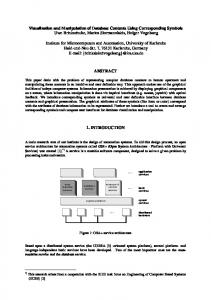
environments. In other words the ultimate system we would like to build, will be capable of receiving arbitrary sensor imagery and automatically generating a 3D model of the world knowledge . Automated 3D model construction of real world objects from sensor inputs has proven to be a difficult task for computers. The same task appears to be easily and effortlessly accomplished by the human brain. If we could learn how the brain does it, we may be able to build systems with similar and necessary performance characteristics. New theories of human vision have been proposed [Lehar 2003] which operate on what Lehar calls the Harmonic Resonance Principle. The basic idea of this theory is shown in Figure 5. The human is assumed to have a Gestalt representation of the external world in the form of a 3D model scene. From this model an expected visual stimulation is calculated for a particular viewpoint, and projected backward into the visual cortex where it is differenced with an incoming sensory image. The difference between the calculated and incoming visual sensory image is then fed back as an error signal to update the 3D modeled scene. When the two agree, calculated and incoming image interfere constructively, and resonance between the 3D model and the image is established. In this case the brain becomes aware of the visual sensation as an identified 3D object in its environment. When the calculated and external image do not agree, the signals interfere destructively and the 3D model is adjusted until resonance is established.
Figure 5 - Vision-Brain System block diagram (Steve Lehar)
We propose to bridge the gap between human and machine capabilities through a flexible and scalable approach within which the problem can be incrementally solved. The proposed approach automates Lehar’s method for human vision-brain systems in computers with a process of interactive 3D model building we call image feedback. Put
simply, image feedback presents the operator with a synthetic 2D view of a 3D model and requests a correction of the model based upon the difference between the synthetic image and sensor measurements from the real world. System requirements for the automation of 3D terrain generation using image feedback were first analyzed by Wolfgang Baer [Baer 93]. Though theoretically possible, the result showed that compute power capable of delivering Giga-polygons per second would be required to automate the generation of a 3D terrain model from the data provided from a remotely piloted vehicle using a video camera and flying at 60 miles per hour. Though such systems are not available, the algorithm required for implementing image feedback has been the primary guiding design principle used during the incremental development of PVNT. The algorithm is shown in Figure 6. The reader will notice that the basic image differencing and feedback architecture is identical to that shown in the proposed vision-brain theory shown in Figure 5.
Perspective View Generator Calculate
Atmospheric Propagation Model
Surface Material Decoder
ray trace geometry engine
Database Update Algorithm Differ ence Measure
Image Regist ration
Raw Data
Atmospheric Effects Estimator
Inverse 2D=>3D Geometry Estimator
Surface Material Encoder
Objective update Data Bases
Real World
Sensor
Product
Figure 6 – Database Update System block diagram
The image feedback algorithm assumes some of a prior knowledge of the terrain area. For example, satellite CIB data and level of elevation DTED-I is available in most parts of the world. This provides a 90-meter elevation grid and a 10-meter spot size
image overlay that can be used to initialize the database. Hence we may assume that some initial data is available and can be used by the perspective view generator to build calculated images. The upper feedback branch in Figure 5 depicts this calculation. The calculated images are then compared to incoming sensor data. The difference between the calculated and sensor image is then utilized as a parallel error signal for updating the state of knowledge of the objects and features measured. The advantage of this image feedback technique is that the calculation of sensor realistic perspective views from parameterized object models is easier than the direct interpretation of complex images. The feedback technique effectively eliminates what is already known from the measurement signal and thereby reduces the amount of data, which must be processed by pattern recognition techniques by orders of magnitude. The following sub-sections provide further details of the functions delineated in the Database Update System Block diagram.
4.1) Perspective View Generator The upper perspective view generator branch consists of a ray trace engine connecting screen pixels with ground point descriptors stored in the database. Once the piece of ground “seen” by a pixel is known it is combined with illumination conditions to produce a material reflectivity and geometry dependent radiant emission value. The material decoder uses a large look-up table to convert illumination and ground descriptors to radiometric values. These are then run through an atmospheric attenuation model to produce the gray shade effect shown to the operator on the CRT screen. Calculated images are generated and compared with new input measurement images. This gives us three images to work with. The new input measurement, the calculated image, and the difference image. All three are used in the lower database update branch. This box represents a number of interactive and automated functions designed to produce an update, i.e. improvement in our real world knowledge, to be stored in the terrain database. Inside this update branch are a series of feedback loops (many of which are currently interactive) designed to modify parameters defining the geometric location, environmental effects, local geometry, and finally the local material of the terrain surface.
4.2) Image Registration Function The first function required in the lower branch is the image registration function. This function is designed to find the camera parameters defining the instantaneous field of view (IFOV) of the calculated image that best matches the often-unknown IFOV of the measured image. Image registration is performed by a combination of input parameters from auxiliary sources such as GPS receivers on the sensor platforms, ground control points if available, and pattern-matching using calculated images from whatever information is already in the database. The registration function shown here in Figure 65, is simply the first step in the terrain database update process. However it has stand-alone utility in reconnaissance image analysis and target mensuration operations. Clearly if a reasonably good terrain database is available, a potential target in a measured image data stream can be
background registered against a calculated image and hence the target's position can be determined to the accuracy of the database. The use of the PVNT and image differencing for target location is discussed in a paper [Baer 2003]. We assume therefore that this function is completed and both the measured and calculated images are looking at the same piece of ground from the same point of view.
4.3) Atmospheric Correction Atmospheric corrections and illumination effects can severely change the measured vs. calculated image. Effects and programmatic procedures to account for them are listed below. • Illumination and sun angle: sun angle and illumination intensity recalculate the rendering lookup table and set the sunshade bit in the 1 meter terrain • General fog and atmospheric attenuation: gamma correction and fog exponential using visibility and fog color as adjustable parameters • Dust and cloud obscuration: operator input mask on measurement image Fig 7 – View with • Semi transparent fog and dust: a full voxel Atmospheric Corrections atmospheric density model would be required to handle this case and is not yet implemented in PVNT Figure 7 shows an example of a calculated view with shadow and fog effects. The average illumination parameters are adjusted to make the sum of the pixel difference a minimum.
shadow
4.4) Database Update Once the images are registered and adjusted for atmospheric effects, we can assume the differences between the measured and calculated images are due to errors in the database. Two classes of error occur. First, feature geometries can be in error. This typically happens when photographic images are draped over an elevation terrain skin. In this case local elevation features such as trees or houses are projected as flat features on the bald earth background. These looks realistic from a vertical perspective but is obviously incorrect as the perspective becomes more oblique. The second class of error is incorrect surface material assignment. This leads to the wrong reflectivity and incorrect gray shades. For example, if a tree shape is correctly placed in the database, but the material code for this shape is that of bald earth, then the result will look like a large anthill rather than a tree. Trees are typically dark and green, while bald earth is much lighter tan. The two classes of error are handled by the “Inverse 2D=>3D Geometry Estimator” and the “Surface Material Encoder” respectively in Figure 6. This assumption that the residual error between the measured and calculated image is due to these two database errors is only valid to the extent that the perspective
view generation rendering is accurate. In our case a one-meter terrain rendering system, though quite accurate from a helicopter view as shown in Figure 1, actually contains a number of un-modeled artifacts. These include pixelation of close views, nontransparency through vertical openings such as tree branches or windows, and generally inaccurate representations of vertical surfaces. In addition, resolution of centimeters is required to accurately depict close ground views showing leaves and wall features. Efforts are underway to enhance the ray trace engine to handle vertical surfaces and holes, for improved representation of urban terrain. At this time the system is used primarily for rural or suburban areas and in these regions the value of 3D editing and difference image feedback can already be explored.
5) Vision System Development Philosophy The construction of automated vision systems is not an easy task, and the simple presentation of an algorithm does not make it an accomplished fact. We do not claim this work is complete, but only that our development effort provides a systematic roadmap for approaching and solving the problem. Historically, a large number of contributions to the construction of 3D models have been made via fusion of multiple range/depth images taken from different perspectives [Eggert 1996, Illingworth 1998]. This assumes that range data is already available. Much of the previous work that uses 2D images to construct 3D models involves stereo-vision [Allen 1995, Jitly 1996, Sengupta 1998]. Stereo-vision assumes that two or more registered images are available. Image point or feature correspondences between the images are created and used with the known camera parameters to calculate the underlying depth values of each set of matched points or features. Our situation requires operation in a hostile environment. Stereo pairs of sufficient quality cannot be guaranteed. Hence the image feedback approach only requires one measured input, and the second image is calculated from the best 3D model available. Such a rugged algorithm, though to a large extent available to the human brainvision system, is not to-date available in computers. Our development philosophy therefore, is to build a vision system incrementally utilizing the human in the loop, where his image recognition functions and cognitive skills are superior, and utilizing the computer to facilitate the human’s job. This approach allows us to build working systems, which makes our sponsors happy, and at the same time allows us to learn what functions represent tedious and error prone components of the total process. These become likely candidates for automation. Thus, rather than trying for full automation first, and ending up restricting the environmental complexity and applicability of our system, we are aiming for full operability first, and elimination of the higher level human functions as an ongoing development goal. The advantage of this development philosophy is that components of the algorithms can be built incrementally. For example, the need to perform image registration in order to find changes useful for terrain data updating also has applicability as a target mensuration technique. The next section describes experiments conducted at NPS designed to demonstrate the PVNT systems ability to locate targets to an order of one-meter in a time frame of seconds. Once registered, the process of difference finding
can also be used in automated reconnaissance analysis. Here, images from a previous flight are stored in a database. Images from subsequent flights, which are usually done at different angles and lighting conditions, are compared not to previous photos, but rather to generated images from such a database. Again, correction, foreshortening, and scale are automatically taken care of and difference detection is thereby enabled.
5.1) Image Registration For UAV Targeting Example During the days of Aug 28 to 30 ’05 several TNT4-05 experiments were conducted to test the target location effectiveness of the Perspective View Nascent Technologies (PVNT) based Precision Targeting Mission Control System Support (MCSS). A short description of the successful NPS-UAV target location experiment follows. Experiments during the TNT4-05 period were primarily designed to test and checkout the connectivity, and interface message format integrity between field deployed NPS Small UAV (SUAV) and a PVNT based MCSS located at the GigaLab on campus at NPS. Sufficient success was achieved to allow a several image based targeting tests to be performed. This test verified our ability to transmit video and telemetry from a flying UAV to a remote site, perform a precision target location determination, and transmit the result back to the field in near real time. The NPS SUAV was flown on several flights by team headed by Prof. Isaac Kaminer. The GPS coordinates of several targets consisting of two automobiles and several parked vehicles in the parking area approximately half way between the UAV control tent and the TOC were measured. The UAV was then flown in patterns around the air-strip. The video from the camera along with the GPS latitude, longitude, altimeter altitude, and UTM coordinate referenced camera pointing angles, were transmitted to the Tactical Operations Center and to the Gigalab (see blue line in Figure 2). At both sites the information was ingested by an HP 2.8Ghz Fig 7 - CR Interface Screen PC outfitted with a Pelco Viewer and the CR_interface program that captured and displayed 9 seconds of images each at one second intervals and synchronized the image with telemetry messages (see figure 9 above). At both locations the messages were also relayed to a second computer running the Perspective View Nascent Technologies software (PVNT) to generate telemetry controlled calculated perspective views. This second computer received GPS and camera angle coordinates at one-second intervals.
The GigaLab operator would watch the incoming live video on the interface computer called “Panda”. When the aircraft flew over a target point that could be recognized, the operator would watch the captured image with the recognized target transferred through the six trailing frames. He would set up to click the image transfer button on one of the trailing frames. A one second capture rate is about as fast as the operator can respond to image content. This transfers the image to the PVNT machine along with the accompanying best guess UAV position and camera angles. This information generates a green best guess image outline on the PVNT situational awareness display ( see figure 9). Calculated View
Target Coordinates On AN/CRT window Measured Video image from UAV
Target spot in difference window
Measured Calculated Difference Window
Target –car and panels parked in parking lot Image ground prints Green = initial image estimate Red = final image estimate Blue rectangle = UAV Red rectangle = Target
Situational Awareness display showing image and map overlays
Figure 9 – PVNT Target Mensuration Screen Capture The next processing step is to use the difference window (yellow, above) to perform a more accurate calculated and measured image registration. The following screen capture shows the PVNT with a live video captured image on the top, the best calculated view on the upper left, and the differencing view on the middle lower left. What can clearly be seen is that a new tarmac feature had been constructed since the database was built. The blooming in the measured image eliminated all features close to the new construction. Thus the operator took the only two common points on the upper
left of both the measured and calculated image as a point of registration, and rotated the difference image till the new feature lined up with the grass edge along the right side. The target then clearly shows up substantially left of the grass curve used in the previous near -real-time mensuration described in the last section. The Figure 9 above is a projector screen in the GigaLab captured during the last SUAV flight that summarizes the PVNT image target location system at work. By operator-interactive feature matching between the measured and calculated view, the target position was located to approximately 5 meters in longitude, and 2 meters Latitude, in approximately 60 seconds.
Conclusion PVNT is a software package, which addresses both the data generation as well as the data utilization issues. It provides support for producing metrically accurate representations of the battle space. It is therefore designed to operate in an environment where the live and virtual reality worlds come together. Development of faster and more automated PVNT terrain creation code is an ongoing research effort at NPS. This effort is based upon a systematic and incremental development strategy that moves the PVNT system from an interactive man-in-the-loop to a fully automated vision system. Collaborative efforts, which allow code sharing and the development of a user group are being pursued. Sample copies of executables along with sample one-meter terrain data are available on CDROM from Dr. Baer at NPS. See the PVNT demonstration website at https://www.trac.nps.navy.mil/pvnt/index.html for a detailed description of the program.
REFERENCES: [Allen 1995] “3D Scene Reconstruction and Object Recognition for use with Autonomously Guided Vehicles (AGVs)” by C. Allen and I. Leggett, Proceedings of the 1995 IEEE IECON, pp. 1219-1224, 1995 [Baer, W 1993] “An Approach for Real-Time Terrain Database Creation from Aerial Imagery”, by W. Baer and J. R. Akin, SPIE Proceedings Vol. 1943-17 OE/Aerospace and Remote Sensing Conference, 12-16 April 1993. [Baer, W. 1999] Use of image feedback loops for real time terrain feature extraction. Proceedings of SPIE Conference on Real-Time Imaging IV, San Jose CA Jan 1999, SPIE Vol. 3645, pp12-23 (W. Baer, Lynne Grewe, Neil Rowe) [Baer, W. 2003] Target Location and Sensor Fusion through Calculated and Measured Image Differencing, Signal Processing, Sensor Fusion, and Target Recognition XII, Ivan Kadar, Editor, Proceedings of SPIE Vol 5096(2003) p 169 Baer, Wolfgang ; Todd Campbell
[Baer, W. 2004] UAV Sensor Network Attenuation Prediction (SNAP) Experiment, The 43’d Army Operations Research Symposium,Session 3 Innovative OR Techniques for Good Enough T&E Solutions, Presentation only Ft. Lee, Virginia, 19-21 October 2004, contact author for paper. [Eggert 1996] “Simultaneous Registration of Multiple Range Views for use in Reverse Engineering” by D. Eggert, A. Fitzgibbon, R. Fisher, International Conference on Pattern Recognition, pp. 243-247, 1996. [Illingworth 1998] “Looking to Build a Model World,” J. Illingworth and A. Hilton, Electronics & Communication Engineering Journal, pp 103-113, June 1998. [Jitly 1996] “Automated 3D Object Recognition and Dynamic Library Entry/Update System” by R. Jitly and D. Fraser, 3rd IEEE International Conference on Image Processing, pp. 325-328, 1996. [Lehar, Steven 2003], The World In Your Head: A Gestalt View of the Mechanism of Conscious Experience, Lawrence Erlbaum Associates. [Sengupta 1998] “Human Face Structure Estimation from Multiple Images using the 2D Affine Space” by K. Sengupta and J. Ohya, International Conference on Automatic Face and Gesture Recognition, pp. 106-111, 1998. About the Authors Dr. W. Baer currently holds an Associate Research Professor position at the Naval Postgraduate School in Monterey California, where he teaches courses in network and network programming. He is building high speed low cost networked processing systems to integrate compute intensive real-time video realistic battlefield simulation and rapid terrain database creation problems, using office automation and Internet access tools on PC hardware. Todd Ross Campbell is a computer engineer and has been involved in the operational testing of Army weapons systems for more than 10 years. His current areas of interest include creation of synthetic battlefield environments (both natural and manmade) and integration of live, virtual, and constructive simulations. Nikolaus Baer graduated from the University of California with a BS in Computer Engineering. He designs embedded circuits and builds computer based testing stations. He is involved with the extensive documentation of the PVNT system as well as the integration of PVNT onto increasingly portable cost effective platforms. Acknowledgement: The authors wish to acknowledge the Transformation Technology Directorate, US Army Operational Test Command for funding support to develop the software and systems described herein.