DECEMBER 2007
SONG ET AL.
4045
Bayesian Estimation of Stochastic Parameterizations in a Numerical Weather Forecasting Model YONG SONG
AND
CHRISTOPHER K. WIKLE
Department of Statistics, University of Missouri, Columbia, Missouri
CHRISTOPHER J. ANDERSON Department of Agronomy, Iowa State University, Ames, Iowa
STEVEN A. LACK Department of Soil, Environmental and Atmospheric Sciences, University of Missouri, Columbia, Missouri (Manuscript received 27 June 2006, in final form 6 February 2007) ABSTRACT Parameterizations in numerical models account for unresolved processes. These parameterizations are inherently difficult to construct and as such typically have notable imperfections. One approach to account for this uncertainty is through stochastic parameterizations. This paper describes a methodological approach whereby existing parameterizations provide the basis for a simple stochastic approach. More importantly, this paper describes systematically how one can “train” such parameterizations with observations. In particular, a stochastic trigger function has been implemented for convective initiation in the Kain–Fritsch (KF) convective parameterization scheme within the fifth-generation Pennsylvania State University–National Center for Atmospheric Research (Penn State–NCAR) Mesoscale Model (MM5). In this approach, convective initiation within MM5 is modeled by a binary random process. The probability of initiation is then modeled through a transformation in terms of the standard KF trigger variables, but with random parameters. The distribution of these random parameters is obtained through a Bayesian Monte Carlo procedure informed by radar reflectivities. Estimates of these distributions are then incorporated into the KF trigger function, giving a meaningful stochastic (distributional) parameterization. The approach is applied to cases from the International H2O project (IHOP). The results suggest the stochastic parameterization/Bayesian learning approach has potential to improve forecasts of convective precipitation in mesoscale models.
1. Introduction It is impossible with current computer technology to create a numerical weather forecast model that is capable of explicitly simulating all scales of atmospheric motion. It is necessary in practice, therefore, to build numerical weather forecast models that explicitly simulate a predetermined range of atmospheric motions while relying on simpler submodels to represent how unresolved processes affect those that are explicitly simulated. Quantitative precipitation forecasts (QPFs) generated by mesoscale numerical weather prediction
Corresponding author address: Yong Song, Department of Statistics, University of Missouri, 146 Middlebush Hall, Columbia, MO 65211. E-mail:
[email protected] DOI: 10.1175/2007MWR1928.1 © 2007 American Meteorological Society
models, that is, models that resolve processes with horizontal scales on the order of 20 km, are used as a key source of forecasts for the public as well as those tailored to business sectors. However, processes critical to precipitation generation, such as thunderstorms, are only partially resolved in mesoscale models. The submodel that represents the unresolved portion is commonly called the convective parameterization scheme (CPS). What is known about convective processes indicates that a natural separation of scales between convection and its surroundings does not exist (Arakawa 2004). Thus, separating convective processes into resolved and unresolved components in a mesoscale model is arbitrary, and, as a result, CPSs may come in as many forms as there are imaginative individuals to create them. All CPSs are conceived and developed from limited obser-
4046
MONTHLY WEATHER REVIEW
vations, containing constants (i.e., the parameters of the convective parameterization) embedded within approximate models of convective processes that have been set to values that reproduce certain aspects of the limited observations. The trouble is that this approach may undermine the generality of the CPS. Indeed, Wang and Seaman (1997) suggest the convective parameterization is the primary model component that creates intermodel variability of QPFs from mesoscale models. One approach for accounting for the intermodel variability in QPF is to consider multimodal ensembles, whereby different models, including different parameter schemes, are run for the same scenario, and the forecast is based on this ensemble (e.g., Grell and Devenyi 2002; Benjamin et al. 2004). Such approaches have generally performed better than single model ensembles, at least in terms of characterizing model error. It is important to recognize that these approaches still utilize deterministic parameterizations, which inherently imply a sense of certainty that is not typically warranted for modeling subgrid-scale processes. Another approach for generalizing CPSs is to quantify uncertainty by replacing deterministic CPSs with stochastic CPSs (Lin and Neelin 2002). This allows the parameters in the CPS to have a range of possible values rather than a single value. Furthermore, it is possible to relate the distribution of parameter values to subgrid variability of atmospheric conditions important to convective processes that is otherwise ignored in deterministic CPSs. Lin and Neelin (2002) classified approaches for adapting deterministic CPSs for inclusion of stochastic processes into two categories: 1) stochastic processes introduced within the framework of the convective parameterization, and 2) directly controlling the statistics of the overall convective heating by specifying a distribution as a function of model variables. Both approaches have been applied within a GCM (Lin and Neelin 2000, 2002). Bright and Mullen (2002) have applied approach 1 in a mesoscale model. We illustrate a technique applied within a mesoscale model that falls within approach 1. We have developed our technique using the Kain–Fritsch CPS (KF; Kain and Fritsch 1993; Kain 2004). Although there are many CPS parameterizations that could be considered (e.g., see Pielke 2002; Yamada 2003), the KF CPS is relatively simple and one of the few CPSs to be implemented in nearly all mesoscale models that are widely used to produce QPFs. The lone exception being the North American Mesoscale (NAM) model, the operational mesoscale model at the National Centers for Environmental Prediction, which uses the Betts–Miller– Janjic CPS (Janjic 1994). Aside from its ubiquitous use,
VOLUME 135
the KF CPS is an attractive model for stochastic processes because it nicely divides convective processes into three components: the convective trigger function, the mass flux formulation, and the closure assumption. Detailed descriptions of these components can be found in Kain (2004). What is important in our application is that each component contains a model with constants that may be modeled alternatively as stochastic processes. We note, however, that the approach outlined here could (and should) be used with other initiation schemes or could be the basis for new schemes altogether. For purposes of illustrating the methodology, we have focused our analysis on one of the three components, the convective trigger function. The convective trigger function is the set of rules that determines whether the CPS is invoked. Early in the development of the KF CPS, Kain and Fritsch (1992) showed that QPF forecasts were sensitive to the formulation of the convective trigger function. In the real world, the conditions that permit thunderstorms to form vary substantially over distances of 10 km or less (e.g., Ziegler et al. 2003) and evolve according to mesoscale and turbulent motions and variations arising from surface flux heterogeneities. Since mesoscale models do not explicitly simulate these features, such small-scale variations must be inferred from either empirical formulas relating unresolved variability to explicitly simulated variables or information external to the mesoscale model. This has led to the development of many trigger functions (Rogers and Fritsch 1996; Hong and Pan 1998; Bright and Mullen 2002). To date, only Bright and Mullen (2002) have incorporated a stochastic process into the CPS of a mesoscale model. Bright and Mullen (2002) used an autoregressive process to mimic the subgrid variability of vertical velocity. We propose a technique for making such a function stochastic and, more importantly, estimating stochastic parameters of a CPS in which it is possible to take into account more sources of uncertainty. One goal of such an analysis is to adapt an existing trigger function so that it permits a more realistic range of parameter values, as determined by a training set of diverse observations. Of course, only allowing the trigger function in the CPS to be random is somewhat limited and naive. In that respect, it is unlikely that a stochastic trigger function alone is sufficient to allow the numerical model to represent realistic precipitation fields. Indeed, we chose the trigger function here because of its simplicity as a mechanism for illustrating our methodology. We have implemented our stochastic trigger function in the convective parameterizations within the fifthgeneration Pennsylvania State University–National
DECEMBER 2007
4047
SONG ET AL.
Center for Atmospheric Research (Penn State–NCAR) Mesoscale Model (MM5). Specifically, our implementation views convection initiation within MM5 as a Bernoulli random process; that is, when MM5 determines whether to call KF parameterization, there are two possible outcomes, either it is invoked or it is not, and the sum of the probability of the two outcomes is one. Model flexibility can be built into this approach by computing the probability of KF invocation as a function of resolved variables. The probability can be further modified by measures of subgrid variability. These measures have parameters associated with them and these parameters, assumed to have distributions, are estimated with a Bayesian importance sampling approach. Again, we emphasize that our purpose here is to illustrate a methodological approach for stochastic parameterization and the estimation of the appropriate distributions of such a parameterization given observational data. In that regard, we illustrate the methodology on the observed radar “precipitation” from a couple of specific cases in May and June 2002. To clarify the strategy and the specifics, we will discuss the procedure in several steps. In section 2, we introduce numerical model and datasets. In section 3, we describe the methodology. Section 4 is devoted to showing the results on test cases and the comparison with the radar reflectivity data. Discussion and conclusions are provided in section 5.
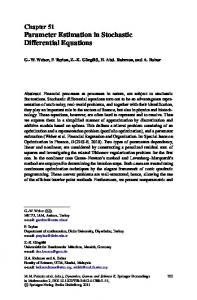
2. Data and the numerical model We consider data from the International H2O Project (IHOP) for 15 May and 15 June 2002. Data from this experiment will serve as initialization for the MM5 experiments. In addition, we utilize composite reflectively radar data at a resolution of 10 km for these periods. These data are based on the maximum reflectivity in the volume scan from the National Weather Service (NWS) Weather Surveillance Radar-1988 Doppler (WSR-88D) at Goodland and Dodge City, Kansas. We demonstrate our statistical parameterization and estimation approach with the MM5 model. MM5 is a limited area, nonhydrostatic, terrain-following, sigmacoordinate model designed to simulate or predict mesoscale atmospheric environments. Details about this modeling system can be found in Dudhia (1989, 1993). As discussed in section 3, we use the KF cumulus parameterization scheme (Kain and Fritsch 1990, 1993) with MM5. The domain used in this study is depicted in Fig. 1 and Table 1 shows the model settings used in this study.
3. Methodology To illustrate our methodology, consider the KF trigger function as applied in the MM5 code. The essence of this approach is that a lifted parcel temperature at the lifted condensation level (LCL) TLCL is compared to the ambient environmental temperature TENV. A temperature perturbation related to the magnitude of the grid-resolved vertical motion ␥ is added to the parcel. Specifically, ␥ ⫽ 4.64(w)1/3 in the MM5 implementation of the KF scheme, where w is the grid box average vertical motion. If the parcel temperature plus this perturbation is greater than the environmental temperature, then the parcel is a candidate for deep convection. Thus, we might write this as c ⫽ 共TLCL ⫹ ␥兲 ⫺ TENV ,
共1兲
where c ⬎ 0 suggests convective initiation and c ⬍ 0 suggests no convective initiation in a specific horizontal grid box in the model. Our first modification to the KF parameterization is to assume that convective initiation is stochastic with the probability of initiation at the jth horizontal grid location given by pj. (Note, pj should be indexed in time as well, but we suppress that notation here.) In this case, convective initiation at the jth grid location follows a conditionally independent Bernoulli distribution with respect to space and time. That is, conditioned on the grid box specific parameters at a given time, the convective initiation for a horizontal grid box is assumed to follow a Bernoulli distribution, independent of time and spatial location. More formally, let yj ⫽ 1 if convection initiates, and yj ⫽ 0 otherwise. Then, prob( yj ⫽ 1) ⫽ pj and prob( yj ⫽ 0) ⫽ 1 ⫺ pj. We then express the probabilities pj in terms of a probit transformation: pj ⫽ ⌽共0 ⫹ 1Tj,LCL ⫹ 2wj3 ⫹ 4Tj,ENV兲,
共2兲
where Tj,LCL, Tj,ENV, and wj are the grid box specific LCL temperature, environmental temperature, and running average vertical velocity, respectively, and ⌽() is the standard normal cumulative distribution function (sometimes known as the “probit” function). Note that other transformations can be used here, such as the logit transformation. However, the results shown here are not sensitive to the choice of the probit versus the logit transform. Although the parameterization in (2) is stochastic, it is most definitely “wrong” in the sense that it is a very imperfect representation of reality. Clearly, more general relationships between the state variables and pj could be developed. Such relationships would almost
4048
MONTHLY WEATHER REVIEW
VOLUME 135
FIG. 1. The MM5 domain.
certainly be more appropriate, at least for specific precipitation events. One way to at least partially account for the uncertainty in the model formulation is to allow the parameters  ⬅ (0, 1, 2, 3, 4)⬘ to be random. [Note, we use a prime to denote a vector or matrix transpose operator.] It is important to emphasize that this choice of random parameters is simply to account for uncertainty in the formulation, not because we believe the convective process acts stochastically in this manner. Specifically, the role of these parameters is to alter the weight of the various components of the KF scheme relative to a particular convective environment. We recognize that this parameterization is somewhat naive. However, it facilitates comparison to the nonstochastic model and the TABLE 1. MM5 domain and parameter setting. Domain and parameters
Model setting
Domain (x, y) Grid spacing (km) Area coverage Sigma levels Time step (s) Bulk microphysics parameterization Planetary boundary parameterization Surface layer parameterization Longwave radiation parameterization Shortwave radiation parameterization
70 ⫻ 70 10 km 700 km ⫻ 700 km 23 40 Graupel (Reisner2) MRF Yes Cloud Cloud
fact that the parameters are random allows for substantial flexibility in the initiation scheme. Consider the following parameter distributions:
k⬃N共k, k2 兲, k ⫽ 0, . . . , 4,
共3兲
where the means k, k ⫽ 1, . . . , 4 can be chosen based on the original nonstochastic parameterization, and 0 can be chosen to reflect a baseline probability of initiation that compensates, somewhat, for other influences on convective initiation. Thus, we let ⫽ (0, . . . , 4)⬘ ⫽ (⫺2.5, 1, 4.64, 1/3, 1)⬘. That is, in the original KF parameterization, “c” in (1) suggests that 1 and 4 are both simply equal to one, which makes it an ideal choice for the prior mean. Similarly, 2 is 4.64 and 3 is the exponent in the wind term and thus is 1/3. The term 0 acts as a random noise term and effectively gives the baseline probability for convective initiation. Our choice is based on climatological data analysis regarding the probability of convection. Typically, this is the parameter about which we know the least, and we reflect this additional uncertainty in its associated variance component 20. In general, our choice for the prior variances 2k can be based on our subjective certainty regarding the prior mean choices. Typically, we assign fairly large values to these variances to reflect our ignorance in this regard. The values selected for 2k are shown in Table 2 and the prior distributions for k are shown in Figs. 2–4. Note that we
DECEMBER 2007
4049
SONG ET AL. TABLE 2. Convective initiation parameters.
15 May normal prior
0
1
2
3
4
Prior mean Prior variance Posterior mean Posterior variance 15 May uniform prior Prior Posterior mean Posterior variance 15 Jun normal prior Prior mean Prior variance Posterior mean Posterior variance
⫺2.5 3.6 ⫺1.123 2.983 0 U(⫺8, 3) ⫺2.545 6.25 0 ⫺2.5 3.6 ⫺2.223 4.163
l 0.0009 0.9935 0.0005 1 U(0.95, 1.05) 0.9935 0.0005 1 1 0.0009 0.9800 0.00036
4.64 1.05 4.789 0.6352 2 U(1, 8) 5.957 2.103 2 4.64 1.05 5.0939 0.7274
0.33 0.025 0.361 0.0081 3 U(0.1, 0.6) 0.3633 0.0169 3 0.33 0.025 0.2602 0.0205
⫺1 0.0009 ⫺1.004 0.0005 4 U(⫺1.05, ⫺0.95) ⫺09998 0.0006 4 ⫺1 0.0009 ⫺0.9850 0.00045
have assumed a priori that these parameters are independent, but we need not make that assumption in general.
a. Bayesian estimation Given the complexity of the hierarchical model for convective initiation, the nonlinear manner in which the parameters (3) enter the model, and the fact that these parameters are random, traditional approaches to statistical estimation are not practical. Bayesian statistical inference is a useful framework for accounting for
sources of uncertainty in data, process, and parameters, especially in complex models such as those considered here. The basics of Bayesian analysis can be found in probability and decision theory (e.g., Berger 1985; Gelman et al. 2004). Although this can lead to useful, if not complicated, hierarchical models for meteorological processes (e.g., Wikle et al. 1998; Royle et al. 1999; Berliner et al. 2000; Wikle et al. 2001; Elsner and Jagger 2004), we make use of a relatively simple Bayesian approach for parameter estimation here. Similar approaches have been considered for relatively simple
FIG. 2. The prior (dashed lines) and posterior (solid lines) distributions of parameters for the 15 May 2002 case with normal priors.
4050
MONTHLY WEATHER REVIEW
VOLUME 135
FIG. 3. The prior (dashed lines) and posterior (solid lines) distributions of parameters for the 15 May 2002 case with uniform priors.
dynamical models (Berliner et al. 2003), but such approaches have not seen widespread use for stochastic parameterization in complicated deterministic models such as used for numerical weather prediction (NWP). Let the state process at time t be decomposed into two components, xt ⫽ [x⬘p,t x˜⬘t ]⬘, where xp,t is the portion of the state vector corresponding to precipitation over the model domain, and x˜t represents the remaining state variables. The state process evolution is represented as xt ⫽ M 共xt⫺1;兲,
共4兲
where M() is the forward model operator (e.g., MM5 in our study), and  corresponds to the parameters in our stochastic trigger function parameterization. Note that if  are random (as is assumed here), then xt is random as well. It is then convenient to write the joint probability distribution of  and all the states from time t ⫽ 1, . . . , T, x1:T ⬅ [x1, . . . , xT], as p(x1:T, ) ⫽ m(x1:T |)p(), where m(x1:T |) refers to the distribution of states x1:T from the forward model, given parameter values . This last identity, in which the joint distribution of x1:T and  is written as the product of the conditional “distribution” of x1:T given  times the marginal distribution of , is a basic fact from elementary
probability. Note, Monte Carlo samples of the probabilistic model state could be obtained by sampling i from p() and then getting samples of the state process xi1:T by running the forward model M (x0; i ) T time steps with initial condition x0 and parameters i. In our case, the initial conditions are assumed fixed. For the remainder of this paper we are only concerned with the portion of the state process corresponding to precipitation over the domain xp,t. Furthermore, we are only interested in the cumulative precipitation over the time integration of the model. Assume observations zp ⫽ [zp(s1), . . . , zp(sn)]⬘ are available for n grid box locations si, i ⫽ 1, . . . , n. For example, in our case, we assume that we have observations of cumulative “precipitation” (from radar) over the time interval t ⫽ 1, . . . , T at n model grid locations. In addition, let xp ⬅ [xp(s1), . . . , xp(sn)]⬘ be the cumulative precipitation from the model at the n grid locations. Throughout this study, both zp and xp are normalized so that the maximum precipitation intensity is one. That is, we are more concerned with precipitation patterns and relative intensity than in absolute intensity. We assume we have an observation distribution p(zp|xp), which is simply the distribution of cumulative precipitation from the radar given the cumulative precipitation from the model. We would ultimately like to learn about the distribution
DECEMBER 2007
4051
SONG ET AL.
FIG. 4. The prior (dashed lines) and posterior (solid lines) distributions of parameters for the 15 Jun 2002 case with normal priors.
of the state process and parameters given these data, p(xp, |zp). In Bayesian statistics, this is known as the “posterior” distribution, and it can be written as the following hierarchical proportion: p共xp, |zp兲 ⬀ p共zp|xp兲m共xp|兲p共兲,
共5兲
where p() is the prior distribution for the parameters given, for example, by (3), and the constant of proportionality is 兰p(zp| xp)m(xp| )p() dxp d. Determination of this normalizing constant for our problem is not possible analytically due to the nonlinear nature of M () in the forward model. However, we can use importance sampling Monte Carlo (ISMC) to obtain samples from this posterior distribution.
1) IMPORTANCE
SAMPLING
our case we cannot sample directly from p(xp, |zp) since we do not know the normalizing constant in (5). However, assume we can sample from some proposal distribution q(xp, |zp). Then, E 关 f 共, xp兲|zp兴 ⫽ ⫽
冕
f 共 , x p 兲
p共xp, |zp兲 q共xp, |zp兲 d dxp q共xp, |zp兲
f 共, xp兲wq共xp, |zp兲 d dxp,
共6兲
where w ⫽ p(xp, |zp)/q(xp, |zp) are the unnormalized importance sampling weights. Thus, we can obtain Monte Carlo estimates of functions of  or xp from ˆ 关 f 共x , 兲|z 兴 ⫽ E N p p
MONTE CARLO
Importance sampling (IS) is a form of weighted sampling used in Monte Carlo integration (e.g., see Robert and Casella 2004 for a comprehensive overview). Assume we are interested in some function of  or xp, say f (, xp). If we could sample i and xip, i ⫽ 1, . . . , ⌵, from p(x p, |zp), then we could obtain the usual ˆ [ f (, x )| z ] ⫽ Monte Carlo estimate, for example, E N p p N i i (1/N)兺i⫽1 f ( , xp). However, as mentioned above, in
冕
N
兺 w˜ f 共x ,  兲, i
i⫽1
i p
i
共7兲
where w ˜i⬅
wi
共8兲
N
兺w j⫽1
j
are known as normalized IS weights. Note, it is critical that by normalizing the weights in this way, one does not
4052
MONTHLY WEATHER REVIEW
need to know the normalizing constants for p(xp, |zp) or q(xp, |zp). Although there are many proposal distributions that could be chosen, we choose to base ours on the distribution q共xp, |zp兲 ⫽ p共xp, 兲 ⫽ p共xp|兲p共兲 ⫽ m共xp|兲p共兲,
共9兲
where, as before, m(xp|) is our notation indicating that the distribution of xp comes from the numerical model (e.g., MM5) given random parameters. Thus, in this case, samples i and xip can be obtained by sampling i from the prior distribution (3) and then running the forward model (e.g., MM5 in our case) for each i to obtain xip, i ⫽ 1, . . . , N. Thus, it is easy to see by substitution that the unnormalized IS weights are just wi ⫽ p共zp|xpi兲,
共10兲
which is just the “likelihood” associated with the data model. The specific form for this likelihood is described in the next section.
2) APPROXIMATE
IMPORTANCE SAMPLING
Note that although the ISMC approach outlined above is powerful in theory, in application some technical issues may arise. In particular, the ISMC weights can degenerate so that only a few (or one) of the generated samples have nonzero weights (e.g., see Robert and Casella 2004 for an overview). In such cases, the Monte Carlo sample is prohibitively small. This problem is well known in the sequential Monte Carlo (particle filtering) literature (Doucet et al. 2001) and is more pronounced in the presence of high-dimensional datasets and nonlinear models. Berliner and Wikle (2006) present several approximate importance sampling algorithms that can mitigate this problem. We use a simple approximate IS approach here in which one effectively compresses the importance weights (Liu et al. 2001; Berliner and Wikle 2006). Consider the case where the IS weights are degenerate so only one weight is nonzero after normalization. If one looks at the unnormalized weights in such a situation, it is the case that these unnormalized weights are not uniform, suggesting that there may be some information in the data that favor particular parameter values. As in Liu et al. (2001), we consider a modification of the weights in which we have w␣i , for 0 ⬍ ␣ ⬍ 1. As ␣ → 0 this has the effect of compressing the weights so that the difference between weights is smaller in absolute terms, although relative differences are still present. For example, consider a typical normal distribution likelihood, in which case the unnormalized weights are wi ⫽ exp关⫺ 1(1/22)(z ⫺ xi)⬘(z ⫺ xi)], where
VOLUME 135
z represents the observations and x i the random variables. The modified weights in this case are w␣i ⫽ exp{⫺[1/2(2/␣)](z ⫺ xi)⬘(z ⫺ xi)}. Thus, as ␣ gets smaller, it has the same effect as increasing the measurement variance. Clearly, one can make ␣ small enough so that the weights are compressed to the point that one seems to have effectively N independent samples. Of course, this is arbitrary, depending on the value one chooses for ␣ and one gets no information about the state and parameters given the data. Correspondingly, as ␣ approaches 1, fewer and fewer samples are “important” until eventually one obtains the single (degenerate) nonzero normalized weight. These two extremes suggest that the approximate posterior distribution of interest ranges between a uniform distribution (as ␣ goes to 0) and a dirac delta function (as ␣ goes to 1). In the next section we describe our data model as well as our choice for weight compression.
3) DATA
MODEL
Consider Zp to be the (2D) image representation of zp and Xip the image representation of xip. We then seek the data distribution p(Zp| Xip) for i ⫽ 1, . . . , N. A matrix normal distribution in which Xip is the mean is an option. However, the IS weights in that case would be proportional to the point-by-point differences between the radar field (Zp) and the model output (Xip). Such a measure does not take into account the fact that small shifts in the precipitation pattern are scored very poorly (i.e., have low IS weights) in this setting, and poorly resolved but spatially expansive precipitation fields score well (i.e., have large IS weights). Such a scenario is not conducive to Bayesian learning. To help remedy that, we consider the following matrix normal data model: Zp|Xpi⬃N共XpiQi, 2I兲,
共11兲
where Qi is a transformation matrix. Specifically, this is the so-called Procrustes transformation matrix that is, by definition, the orthogonal matrix that minimizes Zp ⫺ XipQi in Frobenius norm (e.g., see Golub and Van Loan 1996). Thus, one can think of the matrix Qi as the matrix that gives the optimal (in the Frobenius norm) transformation of the model field to match the radar field. Procrustes transformations have been used in many applications, including meteorology (e.g., Richman and Easterling 1988). From our perspective, we note that the matrix normal distribution in (11) gives the following unnormalized weights:
再
wi ⬀ exp ⫺
1 22
冎
tr关共Zp ⫺ XpiQi兲⬘共Zp ⫺ XpiQi兲兴 ,
共12兲
DECEMBER 2007
4053
SONG ET AL.
where tr[ ] refers to the trace of the matrix. In practice, we do not know 2 and Qi, so these must be estimated. Simple algorithms are available to estimate the Procrustes transformation matrix between two images (e.g., Golub and Van Loan 1996). Now, rather than estimate 2 directly, we make use of the approximate IS adjustment in section 3a(2) and let ⬅ 2/␣ and estimate in an ad hoc fashion. Specifically, we choose a ˆ such that the number of nonzero weights is large enough to represent the posterior distributions for the k, while simultaneously minimizing the Procrustes distance between the normalized radar data and the posterior mean of the normalized model precipitation. In this example, we use ⫽ 0.075 but note that we considered the sensitivity of the results to other values of . We found that as long as one ensures that is chosen such that there are 20–50 distinct samples with nonzero normalized IS weights, then the results are not extremely sensitive to the choice of .
4) POSTERIOR
ANALYSIS
Given the importance weights (12), one normalizes according to (8) and can then get various moments from the posterior distribution (e.g., posterior mean and variance) from (7). For example, the first and second moments of the posterior distribution of j, j ⫽ 0, . . . , 4 given the data can be estimated by ˆ 共 |z 兲 ⫽ E N j p ˆ 共2|z 兲 ⫽ E N j p
N
兺 w˜  , i i j
i⫽1
共13兲
N
兺 w˜ 共 兲 . i⫽1
i
i 2 j
共14兲
Similarly, one can get moments for the posterior distribution of the normalized model precipitation xp. For example, ˆ 共x |z 兲 ⫽ E N p p
N
兺 w˜ x . i⫽1
i i p
共15兲
In addition, one can approximate the posterior distributions by kernel mixtures. For example, the posterior distribution of j, j ⫽ 0, . . . , 4 can be approximated by
兺 i⫽1
5) FORECASTING
WITH STOCHASTIC
PARAMETERIZATIONS
We consider three approaches for utilizing the estimates of the posterior distribution for the stochastic model parameters when generating forecasts. The first approach, which we call “brute force” is to simply run the forecast model (MM5 in this case) many times, once for each sample from the posterior distribution i ⬃ p(|zp). This approach has the obvious disadvantage of being potentially prohibitively expensive, since many runs would have to be made. However, one can get a more direct sense of the uncertainty associated with the forecast in this case since one has multiple realizations, each with a given weight. Uncertainty can be evaluated simply by Monte Carlo estimates of the posterior predictive variance [e.g., utilizing formulas analogous to (13) and (14)]. The second approach is what we term the “time step” approach. In this case, one samples from the posterior i ⬃ p(|zp) at each time step in a single run of the forecast model. Obviously, this is inexpensive computationally but has the disadvantage of not providing a sense of the forecast uncertainty as there are no repeat samples from which to obtain the Monte Carlo estimate of the forecast variance. The third approach is what we call the “fixed parameter” approach. In this case, we simply use a single posterior summary statistic for each parameter. Typically, this is the posterior mean or median. As with the time step approach, this approach is quite inexpensive computationally since it requires only one run and no draws from the posterior distribution. Implicit in the use of this approach is that the stochasticity in the Bernoulli formulation is sufficient to account for parameterization uncertainty and that the additional randomness in the stochastic model parameters is not necessary. Clearly, for practical use, a hybrid between these approaches would be an alternative. In the next section, we demonstrate the methodology on several cases from the IHOP experiment.
4. Results
N
p共j|zp兲 ⬇
viation of the Monte Carlo samples for which the distribution is being estimated.
w ˜ ik共ji; ␥兲,
共16兲
where k(ij; ␥) is some kernel function centered at ij and with kernel bandwidth ␥. In our examples, we use normal kernels with a default bandwidth of ␥ ⫽ 1.06w(N )⫺2, where w is the IS-weighted standard de-
We applied the methodology given in section 3 to the dataset described in section 2. Specifically, to obtain the posterior distributions, we applied the procedure to data from 1900 to 2300 UTC 15 May 2002. We then sampled N ⫽ 1000 times from the prior distributions for  given in (3) and ran MM5 with the stochastic param-
4054
MONTHLY WEATHER REVIEW
eterization over the domain shown in Fig. 1 for each of these parameter sets. Applying the approximate IS methodology, we then obtained the posterior distributions shown in Fig. 2. Note, these posterior distributions (solid lines) are the kernel-based estimates described in (16). For comparison, the prior distributions (dashed lines) are also shown, based on kernel estimates from the prior samples. From this figure there is evidence of Bayesian learning (narrowing of the posterior relative to the prior) for all parameters. However, we note that other than 0, the posterior means are shifted only slightly from the prior means (see Table 2) for comparison of posterior and prior means and variances. In some sense, this validates the parameters used in the original KF approach. It also suggests that perhaps there is not substantial learning going on in this case and that the difference between the posterior and prior distributions is related to the approximate IS methodology. However, the posterior variance is smaller than the prior variance for each parameter, and such narrowing of the distribution in the presence of the data is an indication of learning. To further test the Bayesian estimation approach, we also considered the same analysis but with the priors selected to be uniform distributions (Fig. 3) and from a normal prior, but with data from 15 June 2002 (Fig. 4). The prior and posterior means and variances are also summarized in Table 2. Notice that there is evidence of learning in the “flat prior” uniform case. The 15 June normal prior case does not show as much narrowing of the posterior relative to the prior as the other two cases, but the posterior variances are less than the prior variances for all parameters except 0. In comparing the three cases, the posterior means are reasonably close, with some notable expectations. For example, 3, the exponent on the vertical velocity term in the KF formulation, is closer to 1/4 in the 15 June case and closer to 1/3 in the 15 May cases. There are also differences in the additive random effect term (0) that controls the baseline probability of convective initiation. The variances are fairly close across cases for 1 and 4 but differ substantially for 0, 2, and 3. Figure 5 shows normalized precipitation results for the 15 May 2002 case. Specifically, Fig. 5a shows the normalized cumulative radar reflectivity. Figure 5c shows the normalized cumulative precipitation from MM5 for the case with the unmodified KF initiation scheme. Figure 5b shows the corresponding MM5 output from the posterior mean, based on the IS weighted 1000 model runs, and Fig. 5d shows the posterior standard deviation. Note that the output from posterior mean shows the pattern of the radar reflectivity. Com-
VOLUME 135
pared to the original model output, the output from posterior mean is qualitatively better. In particular, the precipitation extent is not as large in the stochastic model and matches up better in this regard to the radar data. In addition, there is more variability in intensity in the stochastic model compared to the unmodified model. Furthermore, the frontal band in the southsouthwest portion of the domain is more organized in the stochastic model, in better agreement with the radar data. In addition, the extra cell in the middle of the original model output that is not present in the radar data is also not present in the posterior mean. One of the key advantages of the approach is that the stochastic parameterization has attempted to shift the areas of forecasted precipitation that are misplaced relative to the radar precipitation. However, there is substantial uncertainty in the location and intensity of the squall line feature, as evidenced by the posterior standard deviation plot. The more extensive spatial coverage of the standard deviation fields, when compared to the mean, illustrates this location uncertainty. Such a measure would be useful for forecasters who are giving uncertainty bounds on their forecasts. There are several aspects of the stochastic convective parameterization that could account for the differences shown in Fig. 5. First, the Bernoulli parameterization plays a role, even if the parameters are fixed. In addition, random parameters can play a role. Finally, estimation/training of the parameter distributions on specific data can play a role. To better understand these sources of variation, a series of experiments was considered. We considered the normalized cumulative precipitation as given by the posterior means from multiple integrations (1000) based on normal and uniform priors, as well as single integrations using posterior means from normal and uniform priors from 15 May as well as the normal prior from 15 June. Finally, several time step integrations were considered using the various prior and posterior distributions. These results are shown in Fig. 6. In addition, summaries of these results compared to the radar truth are given in Table 3. In particular, we considered two measures, the Procrustes distance [tr{(Zp ⫺ XipQi)⬘ (Zp ⫺ XipQi)} as given in (12)] and the critical success index (CSI), which takes into account both the false alarm rate and the probability of detection. First, consider the Procrustes measures given in Table 3 for the various cases. Clearly, the runs with the smallest Procrustes values (where smaller values imply “closer” images in the Procrustes sense) are the two 1000 integrations that gave posterior means in cases a and b. This is to be expected, however, since the Procrustes distance measure was used to weight the various
DECEMBER 2007
SONG ET AL.
4055
FIG. 5. (a) The 15 May 2002 normalized radar reflectivity, (b) 15 May 2002 normalized stochastic parameterization model posterior mean precipitation, (c) 15 May 2002 normalized unmodified model precipitation, and (d) 15 May 2002 posterior std dev.
runs in the approximate importance sampling procedure. The next best cases, in terms of the Procrustes distance, are the three single integration runs using the fixed posterior means from the 15 June normal, 15 May normal, and 15 May uniform prior experiments, respectively. This is encouraging, in that it suggests that once one has “trained” the parameters using the multiple run importance sampling procedure, it is nearly as good to use just those posterior means in the MM5 Bernoulli parameterization and let them be fixed. One wonders then if it is just the Bernoulli parameterization that is causing this difference and whether there is any advantage to going to the effort of training the parameters (or parameter distributions) with the 1000 simulations. Indeed, a single integration with the normal prior mean (not shown) is not nearly as good in terms of the Procrustes distance (Procrustes distance ⫽ 5.74). Similarly, the time step integrations also show that the Procrustes distance is less when using the posterior distributions than when using the priors (cases f–h). Interestingly, according to the Procrustes metric, the original MM5 run is actually better than the time step runs with the
prior distributions and the 15 June posterior! In summary, these results show that there is an advantage in this example to using the Bayesian posteriors, but that it is generally sufficient to consider either the single integration using the posterior means from these distributions or possibly the time step integrations. The choice of metric is important in deciding which of the cases is “best.” For example, if the CSI measure is considered, then the 1000 integration runs are still the best (where higher CSI implies better agreement between the fields), and the single integration runs using the posterior means are next, followed by the time step integration runs using the posteriors. Note that the time step runs using the prior distributions are the worst of the stochastic runs. However, in all cases, the stochastic model runs given higher CSI scores than the original MM5 model. We note that there is still some variation between the results suggested by the Procrustes metric and the CSI metric. Indeed, such variation in the results is not a negative, but rather suggests that other metrics could be used to obtain the weights in the importance sampling procedure, thereby possibly giving different
4056
MONTHLY WEATHER REVIEW
VOLUME 135
FIG. 6. Normalized precipitation for 15 May 2002. (a) The 1000 integration posterior mean from 15 May normal prior; (b) 1000 integration posterior mean from 15 May uniform prior; (c) single integration using posterior mean parameters from 15 May normal prior; (d) single integration using posterior mean parameters from 15 May uniform prior; (e) single integration using posterior mean parameters from 15 Jun normal prior; (f) single time step integration using posterior from 15 May normal prior; (g) single time step integration using posterior from 15 May uniform prior; (h) single time step integration using posterior from 15 Jun normal prior; (i) single time step integration using normal prior; (j) single time step integration using uniform prior; (k) original KF MM5; and (l) radar data.
posterior distributions. This is equivalent to the choice of a different data model in the Bayesian procedure. The subjective choice of the weighting scheme could be based on the specific goals of the forecaster or model developer. We note as well that both the Procrustes distance and CSI are univariate measures that try to capture the similarity of two spatial fields (model runs and radar “truth”). Clearly, more information regarding the similarity of such fields can be obtained from comparison of the cumulative precipitation summary fields themselves (Fig. 6) or some other higher-dimensional summary.
We will leave it to the reader to decide which approach he/she favors, depending on which aspects of the fields are deemed most important. In summary, these results suggest that it is useful to go to the effort (many integrations) to obtain the posterior distributions for the parameters. However, in application, one would not lose much in terms of forecasting the mean precipitation by running a single integration with the posterior means. In addition, given the results from the 15 June posteriors, it is possible that one would not have to update the posteriors frequently. Although the results presented above are encourag-
DECEMBER 2007
4057
SONG ET AL.
TABLE 3. Procrustes distance and CSI for experiments to predict cumulative precipitation for the 15 May 2002 case. Expt
Procrustes
CSI
Description
a b c d e f g h i j k l
4.5212 4.6517 4.8724 4.9497 4.8322 5.0045 5.0134 5.4111 6.8204 6.4463 5.3700
0.4309 0.4315 0.3698 0.3851 0.4161 0.3934 0.3805 0.3831 0.3622 0.3481 0.3417
1000 integration using posterior mean from 15 May normal prior 1000 integration using posterior mean from 15 May uniform prior Single integration using posterior mean from 15 May normal prior Single integration using posterior mean from 15 May uniform prior Single integration using posterior mean from 15 Jun normal prior Single time step integration using posterior from 15 May normal prior Single time step integration using posterior from 15 May uniform prior Single time step integration using posterior from 15 Jun normal prior Single time step integration using normal prior Single time step integration using uniform prior Original KF MM5 Radar data
ing, the stochastic parameterization is by no means perfect. For example, Fig. 7 shows results from running the stochastic model (with posteriors developed from 15 May) for 16 May 2002. In this case, the difference between the unmodified KF and the stochastic KF run are not that large, in terms of overall coverage, as both do match up rather well with the radar image. Note, however, that the stochastic model results are less smooth than the unmodified KF approach, which is in some respects more similar to the radar data.
5. Conclusions The purpose of this paper is to demonstrate a methodology by which random parameters in a stochastic parameterization can be informed by data. It is not the intent of this paper to develop a general purpose stochastic parameterization scheme or to perfect an existing scheme. Indeed, in many respects we have only improved the location, shape, and intensity of the model precipitation features modestly relative to the
FIG. 7. (a) The 16 May 2002 normalized radar reflectivity, (b) 16 May 2002 time step stochastic implementation normalized model precipitation, and (c) 16 May 2002 normalized unmodified model precipitation.
4058
MONTHLY WEATHER REVIEW
radar truth. Most likely, the primary reason that our results do not match the radar any better is that we are only considering one component of the convective parameterization in our stochastic setting. As such, the Bayesian learning approach is doing the best it can with adjusting the precipitation fields to match the radar truth, yet the convective parameterization is still relatively poor at representing propagating precipitation. More critically, we suspect that our trigger function is not flexible enough to handle the variety of situations in which storms initiate. Even so, in the relatively simple stochastic KF scheme considered here, the methodology is promising. We noted in the results section that a characteristic of the stochastic model results is that the precipitation fields have more spatial variability (i.e., appear more noisy in space). Clearly, one reason for this is due to the stochastic Bernoulli framework. This randomness tends to break the spatial and temporal continuity of the parameterization scheme. For example, since the vertical velocity in the default trigger function is a running average, only the persistent and broad areas of upward vertical velocity are retained when computing the trigger function. Thus, broad spatial correlations can occur in frontal zones or areas where some mechanism for sustained ascent is at work. However, the results presented here show that one gets further improvement by allowing the model parameters to be random, and considering the distribution of parameters, informed by data. There are, of course, several areas on which additional work could be focused. Clearly, the two meteorological cases presented here, although useful to illustrate the methodology, are not sufficient for proving the general utility of any stochastic parameterization scheme. In particular, it would be interesting to compare the posteriors obtained for cases in which the KF scheme is not designed, such as tropical convection. In addition, more complete case studies should be conducted that consider other state and derived variables in response to the convective parameterization. Thus, more meteorological cases, variables, and varying model grid resolution/domain locations must be considered in order to test the robustness of the parameterization. In fact, we would not expect that the posterior distributions for these various scenarios will be the same. However, this is not a deficiency in the approach as we could fairly easily add a component to the parameterization to account for time-varying (or regime specific) parameters. Similarly, spatial and temporal correlation could be built into the prior distributions of the  parameters. In general, alternative stochastic parameterizations for convective initiation could be de-
VOLUME 135
veloped. For example, the Grell scheme (Grell 1993; Grell and Devenyi 2002) would likely be more powerful in this setting given its multiple triggers and closures. In the Bayesian setting, these could be weighted based on the data model of choice. Clearly, other components of the microphysics and radiation parameterizations could be made to be stochastic as well, thereby adding much more flexibility to the convective parameterization. Alternative approaches for approximate importance sampling should be considered. In addition, a sequential IS approach could be considered in cases where cumulative precipitation was not quantity of interest. For the weight compression approach used here, a formal approach for choosing should be developed. Similarly, different data models relating radar data to model output should be considered. For example, we demonstrated that optimization based on the Procrustes distance does not necessarily give optimal forecasts when other verification measures are considered. The model developer (or forecaster) could in fact choose the appropriate objective function (in the data model) to weight the posterior according to his/her concerns. Finally, the methodology outlined here for developing and training stochastic parameterizations is promising. Although clearly not operational, the approach is fairly easy to implement and could be made operational fairly easily. In that case, one might consider an ensemble approach whereby several values from the posterior distribution are selected (randomly), and single integrations of the model are run with these various parameter sets. Such an approach would then allow one to obtain uncertainty measures. Furthermore, the parameter sets could be weighted according to their importance weights, and a Bayesian model averaging procedure could be used to develop the forecast (e.g., see Gneiting and Raftery 2005). In addition, one could consider time step integrations and fixed parameter integrations based on critical posterior parameter summaries (e.g., mean, median, and mode) and combine these in a similar fashion. Acknowledgments. Song and Wikle wish to acknowledge the support of NSF Grants ATM-0434213 and DMS-01-39903. In addition, the authors thank Neil Fox for sharing his expertise on radar data and the two anonymous reviewers for very helpful comments on an early draft. REFERENCES Arakawa, A., 2004: The cumulus parameterization problem: Past, present, and future. J. Climate, 17, 2493–2515. Benjamin, S. G., G. A. Grell, J. M. Brown, and T. G. Smirnova, 2004: Mesoscale weather prediction with the RUC hybrid
DECEMBER 2007
SONG ET AL.
isentropic–terrain-following coordinate model. Mon. Wea. Rev., 132, 473–494. Berger, J. O., 1985: Statistical Decision Theory and Bayesian Analysis. 2d ed. Springer-Verlag, 617 pp. Berliner, L. M., and C. K. Wikle, 2006: Approximation importance sampling Monte Carlo for data assimilation. Physica D, in press. ——, C. K. Wikle, and N. Cressie, 2000: Long-lead prediction of Pacific SSTs via Bayesian dynamic modeling. J. Climate, 13, 3953–3968. ——, R. Milliff, and C. K. Wikle, 2003: Bayesian hierarchical modeling of air-sea interaction. J. Geophys. Res., 108, 3104, doi:10.1029/2002JC001413. Bright, D. R., and S. L. Mullen, 2002: Short-range ensemble forecasts of precipitation during the Southwest monsoon. Wea. Forecasting, 17, 1080–1100. Doucet, A., N. de Freitas, and N. Gordon, Eds., 2001: Sequential Monte Carlo Methods in Practice. Springer-Verlag, 581 pp. Dudhia, J., 1989: Numerical study of convection observed during the Winter Monsoon Experiment using a mesoscale twodimensional model. J. Atmos. Sci., 46, 3077–3107. ——, 1993: A nonhydrostatic version of the Penn State–NCAR mesoscale model: Validation tests and simulation of an Atlantic cyclone and cold front. Mon. Wea. Rev., 121, 1493– 1513. Elsner, J. B., and T. H. Jagger, 2004: A hierarchical Bayesian approach to seasonal hurricane modeling. J. Climate, 17, 2813– 2827. Gelman, A., J. B. Carlin, H. L. Stern, and D. B. Rubin, 2004: Bayesian Data Analysis. 2d ed. Chapman and Hall/CRC, 668 pp. Gneiting, T., and A. E. Raftery, 2005: Weather forecasting with ensemble methods. Science, 310, 248–249. Golub, G. H., and C. F. Van Loan, 1996: Matrix Computations. 3d ed. Johns Hopkins University Press, 694 pp. Grell, G. A., 1993: Prognostic evaluation of assumptions used by cumulus parameterizations. Mon. Wea. Rev., 121, 1493–1513. ——, and D. Devenyi, 2002: A generalized approach to parameterizing convection combining ensemble and data assimilation techniques. Geophys. Res. Lett., 29, 1693, doi:10.1029/ 2002GL015311. Hong, S. Y., and H. L. Pan, 1998: Convective trigger function for a mass-flux cumulus parameterization scheme. Mon. Wea. Rev., 126, 2599–2620. Janjic, Z. I., 1994: The step-mountain eta coordinate model: Further development of the convection, viscous sublayer and turbulence closure model schemes. Mon. Wea. Rev., 122, 928– 945. Kain, J. S., 2004: The Kain–Fritsch convective parameterization: An update. J. Appl. Meteor., 43, 170–181.
4059
——, and J. M. Fritsch, 1990: A one-dimensional entraining/ detraining plume model and its application in convective parameterization. J. Atmos. Sci., 47, 2784–2802. ——, and ——, 1992: The role of the convective “trigger functions” in numerical forecasts of mesoscale convective systems. Meteor. Atmos. Phys., 49, 93–106. ——, and ——, 1993: Convective parameterization for mesoscale models: The Kain–Fritsch scheme. The Representation of Cumulus Convection in Numerical Models, Meteor. Monogr., No. 24, Amer. Meteor. Soc., 165–170. Lin, J. W.-B., and J. D. Neelin, 2000: Influence of a stochastic moist convective parameterization on tropical climate variability. Geophys. Res. Lett., 27, 3691–3694. ——, and ——, 2002: Considerations for stochastic convective parameterization. J. Atmos. Sci., 59, 959–975. Liu, J. S., R. Chen, and T. Logvinenko, 2001: A theoretical framework for sequential importance sampling with resampling. Sequential Monte Carlo Methods in Practice, A. Doucet, N. de Freitas, and N. Gordon, Eds., Springer-Verlag, 581 pp. Pielke, R. A., 2002: Mesoscale Meteorological Modeling. 2d ed. Academic Press, 676 pp. Richman, M. B., and W. E. Easterling, 1988: Procrustes target analysis: A multivariate tool for identification of climate fluctuations. J. Geophys. Res., 93, 10 989–11 003. Robert, C. P., and G. Casella, 2004: Monte Carlo Statistical Methods. 2d ed. Springer, 645 pp. Rogers, R., and J. M. Fritsch, 1996: A general framework for convective trigger function. Mon. Wea. Rev., 124, 2438–2452. Royle, J. A., L. M. Berliner, C. K. Wikle, and R. Milliff, 1999: A hierarchical spatial model for constructing wind fields from scatterometer data in the Labrador Sea. Case Studies in Bayesian Statistics, C. Gatsonis et al., Eds., Springer-Verlag, 367– 382. Wang, W., and N. Seaman, 1997: A comparison study of convective parameterization schemes in a mesoscale model. Mon. Wea. Rev., 125, 252–278. Wikle, C. K., L. M. Berliner, and N. Cressie, 1998: Hierarchical Bayesian space–time models. J. Environ. Ecol. Stat., 5, 117– 154. ——, R. F. Milliff, D. Nychka, and L. M. Berliner, 2001: Spatiotemporal hierarchical Bayesian modeling: Tropical ocean surface winds. J. Amer. Stat. Assoc., 96, 382–397. Yamada, Y., 2003: Cumulus convection schemes. Suuchiyohou-ka Houkoku Bessatsu, 49, 84–89. Ziegler, C. L., J. Sheffield, E. P. Maurer, B. Nijssen, E. F. Wood, and D. P. Lettenmaier, 2003: Detection of intensification in global- and continental-scale hydrological cycles: Temporal scale of evaluation. J. Climate, 16, 535–547.