The Kohonen self-organising map (SOM) is a biologi- cally inspired unsupervised learning algorithm and has found a wide range of applications for clustering, ...
Bayesian self-organising map for Gaussian mixtures H.Yin and N.M.Allinson Abstract: A Bayesian self-organising map (BSOM) is proposed for learning mixtures of Gaussian distributions. It is derived naturally from minimising the Kullback–Leibler divergence between the data density and the neural model. The inferred posterior probabilities of the neurons replace the common Euclidean distance winning rule and define explicitly the neighbourhood function. Learning can be retained in a small but fixed neighbourhood of the winner. The BSOM in turn provides an insight into the role of neighbourhood functions used in the common SOM. A formal comparison between the BSOM and the expectation-maximisation (EM) algorithm is also presented, together with experimental results.
1
Introduction
In pattern recognition, an accurate estimation of environmental distribution is essential. A single parametric form is often too limited to be useful in modelling practical data densities, whilst nonparametric methods, such as Parzen’s windows, generally require a large data set and a number of pre-set parameters [1]. Mixture distributions offer a more flexible approach to density estimation, in which the joint distribution is modelled as a mixture of some parametric forms such as Gaussians (e.g. [2]). They provide a trade-off between simple and limited parametric approaches and computational intensive nonparametric approaches, and are also called semi-parametric approaches [3, 4]. In some cases, there is a need to identify individual conditional distributions, for which both single parametric and nonparametric approaches are incapable. A number of methods exist to solve Gaussian mixtures from sample data. The general maximum likelihood method is an empirical approach [5]. The EM method [6] has proven itself a powerful method in solving many learning problems based on the maximum likelihood principle. It has been applied to Gaussian mixtures [7, 8]. However, its first-order slow convergence and sensitivities to initial states hamper its practical application, especially when mixture components are not well separated and=or sample size is small [7, 9]. The Kohonen self-organising map (SOM) is a biologically inspired unsupervised learning algorithm and has found a wide range of applications for clustering, vector quantisation and data visualisation [10, 11]. It uses a low dimensional array of neurons to capture and represent input data drawn from often a high dimensional space and forms a mapping with topological preserving properties. Its neighbourhood learning helps to form the topological ordering in the map and to escape from local minima during learning. Although it is a probability-related mapping, it does not exactly model the input data density [12]. The SOM will eventually minimise the mean-square# IEE, 2001 IEE Proceedings online no. 20010378 DOI: 10.1049/ip-vis:20010378 Paper first received 10th July 2000 and in revised form 14th February 2001 The authors are with the Department of Electrical Engineering and Electronics, UMIST, Manchester M60 1QD, UK 234
error between the input space and the map [13]. For density estimation, a distortion measure between the environmental density and probability representative of the network is more suitable than the mean square distortion [14, 15]. In this paper, a Bayesian self-organising map (BSOM) is proposed as an extension to the SOM for solving Gaussian mixture densities. A brief result has been given in [16]. It can be derived naturally from minimising the Kullback– Leibler metric. Recently a latent variable model, namely the generative topographic mapping (GTM), has been proposed as an alternative to the SOM for density modelling and data visualisation [17]. It uses spherical Gaussians of an equal variance to model the density. These nodes, arranged in a low-dimensional lattice, are mapped into the manifold of the data by a piecewise linear eigenvector method, and their parameters are estimated using the EM algorithms. The relation between the BSOM and the SOM and GTM will be discussed, together with performance analysis and comparison with the EM algorithm. 2 Mixture distributions and Bayesian selforganising map 2.1 Gaussian mixture distributions The mixture distribution model has been employed for pattern recognition and clustering problems. In a mixture model, each data point, x, of a d-dimensional input space, O 2 Rd, is implicitly generated by one of K distinct sources, o1 , o2 , . . . , oK , each of which has a prior probability P(oi) or Pi . For each source, data are distributed according to a prescribed component-conditional probability density. Then the joint-probability density of the data can be written as K P pðx j oi ; yi ÞPðoi Þ ð1Þ pðx j YÞ ¼ i¼1
where p(x j oi , yi) is the ith component’s conditional density, and yi are the sufficient statistics, or parameters, for the ith conditional density, i ¼ 1, 2, . . . , K. Y ¼ (y1 , y2 , . . . , yK)T, P(oi) is the prior probability of the ith component and is also called the mixing priors, P(oi) � 0, i ¼ 1, 2, . . . , K, and SP(oi) ¼ 1. For a Gaussian mixture, the conditional density has the multivariate Gaussian form � � 1 1 T ÿ1 pðx j oi ; yi Þ ¼ 1=2 exp ÿ ðx ÿ mi Þ Si ðx ÿ mi Þ 2 ð2pÞd=2 Si ð2Þ IEE Proc.-Vis. Image Signal Process., Vol. 148, No. 4, August 2001
where yi ¼ {mi , Si} are the mean vector and covariance matrix of the ith Gaussian, respectively. Gaussian mixtures can be used to approximate density functions for pattern classification. Many practical densities can be decomposed into Gaussians. The mixture models have been used as the basic structure for many learning algorithms such as radial basis function (RBF) and probabilistic neural networks. However, most approaches, including the GTM, employ homoscedastic mixtures, in which all component distributions have a single variance that is often assumed symmetric. The BSOM, however, uses heteroscedastic and asymmetric Gaussian components. 2.2 Maximum likelihood estimation and expectation-maximisation (EM) algorithm In most applications, only the number of components and the form of their conditional densities are known or can be assumed; other parameters have to be learnt from a set of N unlabelled independent observations, X ¼ {x(1), x(2), . . . , x(N)}. In these cases, maximising the joint-likelihood (ML) of all observed sample points, Q p(X j Y) ¼ nN¼ 1 p(x(n) j Y), will lead to a singular solution. When constrained to the largest finite maximum and Gaussian components, it results in the following implicit solutions for these parameters [5]: N P
^i ¼ m
P^ ½oi j xðnÞ; y^ i xðnÞ
n¼1 N P
ð3Þ P^ ½oi j xðnÞ; y^ i
n¼1 N P
S^ i ¼
^ i ½xðnÞ ÿ m ^ i T P^ ½oi j xðnÞ; y^ i ½xðnÞ ÿ m
n¼1 N P
ð4Þ P^ ½oi j xðnÞ; y^ i
n¼1 N 1P P^ ½oi j xðnÞ; y^ i P^ ðoi Þ ¼ N n¼1
ð5Þ
p½xðnÞj oi ; y^ i P^ ðoi Þ P^ ½oi j xðnÞ; y^ i ¼ K P p½xðnÞj oj ; y^ j P^ ðoj Þ
ð6Þ
where
j¼1
represents the estimated posterior probability of the ith Gaussian given the input x(n). Duda and Hart [5] suggested intuitively an iterative estimation scheme, which has the exact form of eqns. 3–6 but with current estimates on the right side of the equations and new estimates obtained from the left. This scheme is direct, simple and can be a suitable approach for many problems. However, good initial estimates are important for obtaining satisfactory final results, and all the input data are needed for each iteration. This algorithm was later justified by applying the EM algorithm to the problem [7, 8]. The EM algorithm is an iterative ML procedure for parameter estimation for incomplete data or missing data situations [8]. It converges monotonically to a local maximum of the likelihood function. By using the EM procedure, the marginal or incomplete-data likelihood is obtained by averaging the complete-data likelihood with respect to the missing variables using the current parameter estimates—E-step, i.e. Q[Y j Y(k)] ¼ EZ{ln p(Y j Y) j X, Y(k)}, where EZ represents the expectation against Z, and Y, X and Z are the complete, observed and missing data sets, respectively. IEE Proc.-Vis. Image Signal Process., Vol. 148, No. 4, August 2001
Then the new parameter estimates are obtained by maximising this marginal likelihood with respect to each model parameter—M-step, i.e. Y(k þ 1) ¼ arg maxY {Q[Y j Y(k)]}. Despite this algorithm having been re-expressed in adaptive forms by Traven [3] and Tarassenko and Roberts [18], it is a batch operation in nature and a deterministic optimisation procedure, and thus is likely to suffer from slow convergence and is sensitive to initial states. 2.3 Kullback–Leibler information The Kullback–Leibler information metric [19] measures the divergence or ‘distance’ between the estimated and true environmental densities, and is defined as � ð � p^ ðxÞ pðxÞdx ð7Þ I ¼ ÿ log pðxÞ It is also referred to as ‘relative entropy’ [4, 20]. It is an expectation of the negative log-likelihood in the limit of an infinite number of data points, subtracting a bias, which is known as the entropy of the data. It measures the average amount of information remaining in each data point by the estimator. It is always a positive number, and will be zero if and only if the estimated density equals the true one. The sample likelihood, used by the ML and EM methods, is an approximation to the Kullback–Leibler measure. These two will be equal when the size of the sample tends to infinity and the input is an ergodic process. The Kullback–Leibler is arguably a more suitable measure for density estimation and unsupervised learning [14, 15]. It is a natural integration of the accumulative log likelihood. 2.4 Bayesian self-organising map When the density is modelled as a Gaussian mixture, then the partial derivatives of the information I, with respect to unknown model parameters, m ˆ i , Sˆ i and Pˆ (oi), can be obtained as follows: ð ^Þ @I 1 @pðxj Y ¼ÿ pðxÞdx ^ Þ @m ^i ^i @m pðxj Y ð 1 pðxj oi ; y^ i ÞP^ ðoi Þ ^ i ÞpðxÞdx ðx ÿ m ð8Þ ¼ÿ ^Þ S^ i pðxj Y ð ^Þ @I 1 @pðxj Y ¼ÿ pðxÞdx ^ Þ @S^ i @S^ i pðxj Y (ð 1 pðxj oi ; y^ i ÞP^ ðoi Þ ¼ÿ ^Þ 2S^ i pðxj Y h i o ^ i ÞT ÿ S^ i pðxÞdx S^ ÿ1 ^ i Þðx ÿ m ð9Þ � ðx ÿ m i ð ^Þ @I 1 @pðxj Y ¼ÿ pðxÞdx ^ Þ @P^ ðoi Þ @P^ ðoi Þ pðxj Y " # K P @ ^ Pðoj Þ ÿ 1 þl @P^ ðoi Þ j¼1 # ð" 1 pðxj oi ; y^ i ÞP^ ðoi Þ ¼ÿ ÿ lP^ ðoi Þ pðxÞdx ^Þ P^ ðoi Þ pðxj Y ð10Þ where in eqn. 10 the method of Lagrange multipliers is introduced to ensure the constraint of a valid overall P probability, i.e. iK¼ 1 Pˆ (oi) ¼ 1. 235
By letting eqns. 8–10 tend to zero, we could obtain a set of equations for finding the optimal model parameters. However, as the true environmental density is not known, these integrals (i.e. the exact gradients) are not obtainable. So these equations are not directly solvable. Thus a recursive stochastic approximation method, e.g. the Robbins–Monro method [21], has to be used to find these parameters. We wish to find the root of the following integral of random variable Y: ð M ðxÞ � EfY ðxÞg ¼ ypðy j xÞdy ¼ r ð11Þ where the p( y j x) is the unknown density function for y under x and r is a given constant. The Robbins–Monro method estimates the root x ¼ y by using an iterative procedure based on successive observations {y1 , y2 , . . . } on Y at input levels {x1 , x2 , . . . }, i.e. ynþ1 ¼ yn þ an ðr ÿ yn Þ
ð12Þ
where {an} is the learning rate, which is monotonically decreasing and must satisfy certain convergence conditions, i.e. (i) 0 < an < 1; (ii) San ! 1; (iii) Sa2n < 1. The SOM algorithm has identical convergence conditions to those of this method. If M(x) is a gradient function, while {y1 , y2 , . . . } are the instantaneous gradients, eqn. 12 means that the instantaneous gradients are used as the mean gradient in the optimisation. This is the so-called stochastic gradient method. It does not minimise or maximise the objective function monotonically, but the mean of the objective function will decrease or increase monotonically. Regarding the eqns. 8–10, since the true gradients are not solvable, the instantaneous gradients, i.e. the integrands, can be used to find a solution for mean vectors, variances and priors using the method of eqn. 12 and letting the Lagrange multipliers be one in eqn. 10. The following updating equations are then obtained: ^ i ðnÞ þ aðnÞP^ ½oi j xðnÞ; y^ i ½xðnÞ ÿ m ^ i ðnÞ; ^ i ðn þ 1Þ ¼ m m i 2 Zv ð13Þ ^ i ðnÞ S^ i ðn þ 1Þ ¼ S^ i ðnÞ þ aðnÞP^ ½oi j xðnÞ; y^ i f½xðnÞ ÿ m T ^ i ðnÞ ÿ S^ i ðnÞg; i 2 Zv ð14Þ � ½xðnÞ ÿ m P^ i ðn þ 1Þ ¼ P^ i ðnÞ þ aðnÞfP^ ½oi j xðnÞ; y^ i ÿ P^ i ðnÞg
ð15Þ
where Zv is a neighbourhood of the winner v. The above learning algorithm is similar in form to the SOM. The posterior probabilities, Pˆ [oi j x(n), yˆ i], which are greater than zero and smaller than one, act as the neighbourhood functions. At each iteration, like the SOM, the above adaptation has been restricted to a small neighbourhood of the winner, v, which is chosen according to the highest posterior probability, i.e. eqn. 6. This is due to the locality of Gaussians. Only the nodes that are close to the input or to the winner will have effective posteriors. The neighbourhood size Zv can be loosely chosen as long as it covers the influential area of the posteriors and need not shrink. Both the form of the neighbourhood functions and the winning metric have been replaced by an on-line learnt posterior probability in the BSOM. In the SOM, the adaptation extents are pre-specified by an empirical neighbourhood function. While in the BSOM, it is adaptively proportional to the estimated posterior probability of the winning neuron and its neighbours, i.e. the learning is constrained by this posterior factor. This constraint can be 236
understood as a simplest form of Bayesian inference to a neuron’s winning and learning opportunity from the input. At the beginning, each neuron should be assigned with the same mixing priors if no knowledge about the data is available and distributions are assumed uniform—this corresponds to non-informative priors [22]. Full Bayesian inference for all parameters is feasible, and then the joint distribution would integrate over all priors’ distributions (if they can be known or assumed). Such a scheme would require intensive computation. Here we only apply the simplest inference to the neuron’s winning and neighbourhood adaptation mechanisms. Though similar updating formulas have been reported before for Gaussian mixtures, e.g. [23], the above derivation has formally linked the SOM with a density model and revealed the meaning of the neighbourhood function. Besides, the BSOM updates only the neighbourhood, thus has much lighter computational cost than those updating all nodes as is in [23], and has a better convergence in terms of speed and robustness. The learning rate used in the BSOM is similar to that used in the SOM or general stochastic approximation. It has a more relaxed form, unlike those used in [23], which are proportional to the inverse of time. 3 Comparison of convergence rates of the EM and BSOM Both BSOM and SOM are examples of stochastic gradient methods, which generally outperform the deterministic gradient method in terms of better solvability and improved convergence. Kosko has shown that stochastic gradient methods converge exponentially to centroids [24]. This section considers the relative convergence speeds of the BSOM and EM algorithms. The analogy is similar to that between the SOM and the k-means algorithm. Despite the fact that they all operate within the first-order convergent domain, their convergence rates differ, in some cases widely. There are two basic differences between the BSOM and EM algorithms. One is that in the BSOM the update is limited to a small region of the map due to topological ordering (by using the neighbourhood function) and the locality of conditional densities. So the BSOM generally has lower computational cost than the EM algorithm, especially when the number of nodes is large. The second difference is that the BSOM is a stochastic gradient descent method, whilst the EM algorithm is a strict gradient descent=ascent for each batch iteration. This gives the former an advantage over the latter in escaping from ‘shallow’ local minima, and hence there is an increased opportunity in finding the global, or nearglobal, minimum. The batch EM algorithm does not use the learning rate. However, when it is written in adaptive form, its effective learning rate is generally much smaller, while the learning rates in the BSOM (and SOM) are often higher. They are both first-order inverse time series. An index [13] developed for monitoring the convergent speed of the SOM can be used to show the difference of these two algorithms. It can be called the relative convergence index, and is defined as n Y n P xk ðnÞ ¼ 1 ÿ ½1 ÿ aðkÞhðkÞ ð16Þ gðnÞ � k¼1
Qn
k¼1
where xk(n) ¼ a(k)h(k) l ¼ k þ 1, k < n [1 7 a(l)h(l)], a(k) is the learning rate and h(k) is the neighbourhood function. The faster this index approaches unity, the sooner the neurons will converge to near their final positions [13]. IEE Proc.-Vis. Image Signal Process., Vol. 148, No. 4, August 2001
(because of the stochastic gradient nature). This can be observed in the learning curves of both algorithms in the next section. A fast changing learning curve is better than smooth but slow ones as it can accelerate learning to the final stage. In practice, a trade-off can be made between fast and smooth convergence by using different learning rates at different stages. As the EM algorithm is a deterministic method, its final result heavily depends on initial states. Choosing a good initial solution is a necessary prior step for the EM method. The BSOM has a better ability of escaping local minima due to its stochastic gradient descent=ascent nature. The on-line version of the EM algorithm can also employ a stochastic gradient, if it uses generalised learning rates rather than 1=n, as long as it satisfies the convergence conditions of the stochastic approximation method. The stochastic version of the EM algorithm then becomes similar and comparable to the BSOM algorithm. However, the latter uses a neighbourhood conscience learning, which effectively limits the updating to a small local area of the winner. The EM may be applied to update only those nodes whose posteriors have significant values. But, since these nodes are not naturally bounded in a neighbourhood, an exhaustive search for these nodes would be required at each iteration.
For the batch EM algorithm, eqns. 3–5, or its adaptive forms (see [3]), its effective learning rates are b0 ðnÞ ¼ P n
1
n!1
ÿ!
P½oi j xðkÞ
1 nPi
k¼1
That is, the denominator tends to the product of the iteration steps, n and the prior probability, Pi , of each class, while as the prior probabilities tend to constants, the learning rates of the EM algorithm are proportional to the inverse of the learning time, i.e. 1=n, or exactly 1=(nPi). In the BSOM, eqns. 13–15, a more flexible learning rate a is used, such as the form a0=(1 þ n=t), where a0 (0 < a0 < 1) is the initial learning rate and t is a constant and t � 1. a is usually much larger than 1=(nPi), and it is easy to demonstrate that the relative convergent index g(n) of the BSOM is generally faster than that of the EM algorithm in reaching unity. Thus the BSOM converges to near the final result quicker than the EM algorithm. P Another index, which is defined as kn ¼ 1 x2k (n) and has been used to monitor the fluctuation of the convergence [13], indicates that the BSOM has slightly higher fluctuations than the EM algorithm. This means that the convergence in the EM algorithm is slow but smooth, whilst in the BSOM it is faster but more erratic in the early stages 4
3.0
3
2.5
2
2.0 mean variables
1
1.5
0
1.0
-1
0.5
-2
0
-3 -8
-6
-4
-2
0 a
2
4
6
8
10
-0.5 0
2.5
1.0
2.0
0.8
1.5
0.6
1.0
0.4 mean variables
mean variables
-4 -10
0.5 0
8
4
8
epochs b
12
16
20
12
16
20
0.2 0
-0.2
-0.5 -1.0
-0.4
-1.5
-0.6
-2.0 0
Fig. 1
4
4
8
epochs c
12
16
20
-0.8
0
epochs d
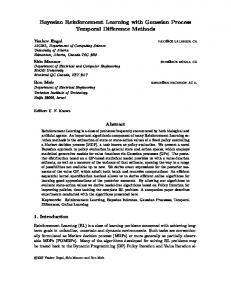
Comparison of convergent speeds of BSOM and EM algorithms
—— BSOM – – – EM a Data scatters b Learning curves for mean vector m1 c Learning curves for mean vector m2 d Learning curves for mean vector m3 IEE Proc.-Vis. Image Signal Process., Vol. 148, No. 4, August 2001
237
Table 1: True parameters and their estimates by the BSOM and EM algorithm after 20 epochs
Preset BSOM EM
4
P1
P2
P3
0.345
0.32
0.335
0.368 0.361
0.320 0.300
0.312 0.339
m1
m2
S1
S2
2.5
ÿ1.8
ÿ0.5
4.0
ÿ0.9
1.0
2.2
ÿ0.5
ÿ0.9
0.3
S3
3.5
0.75
2.0
0.2
0.75
0.3
0.2
0.3
2.52
ÿ1.78
ÿ0.40
4.37
ÿ0.98
3.46
0.75
2.13
0.24
1.04
2.22
ÿ0.48
ÿ0.98
0.32
0.75
0.29
0.24
0.33
2.23
ÿ1.70
ÿ0.41
5.47
ÿ1.32
3.69
0.74
2.14
0.26
1.12
2.19
ÿ0.49
ÿ1.32
0.42
0.74
0.34
0.26
0.31
Experiments and results
4.1 Clustering The BSOM can be used for clustering or unsupervised classification. The following example uses similar data to that in [8]. There are in total 1000 points generated from three Gaussian sources. The data scatters are shown in Fig. 1a and the true parameters for these three Gaussians are given in Table 1 (denoted by Preset). Both BSOM and EM algorithms have been applied to this example. In the BSOM algorithm, three nodes were used. The initial means were set randomly around [0, 0], initial priors were set equal to 1=3, and initial variance matrices were set equally to a diagonal matrix with diagonal values comparable to the raw sample variance, e.g. diag[8, 8]. In such a small net, the neighbourhood covers all nodes. The BSOM converges rapidly to these three clusters after few learning epochs (for each epoch, 1000 points were randomly drawn from the data set). The EM algorithm for these slightly overlapping clusters can also converge to the correct clusters. Typical results of both algorithms after 20 epochs are listed in Table 1. The learning rates in the BSOM were set as a(n) ¼ a0=(1 þ n=t) with a0 ¼ 0.5 and 0.1 for m and for S and P, respectively, and t ¼ 100. The learning curves for the mean vectors during the first 20 epochs are shown in Fig. 1b–d. As can be seen, the convergence speeds of the two methods differ markedly. The BSOM algorithm converges faster, while the EM algorithm has a smooth but slow convergence. This confirms the analysis of the previous section. The only caution that needs to be voiced with the BSOM algorithm is that the learning rates for the covariance matrices and priors should be kept small to avoid the covariance matrices becoming non-positive definite or priors becoming negative during the dramatic early learning stages. It has been found that exact values for these rates are not critical. The algorithm converges to the correct results for a large range of the learning rates. During many independent trials of the two algorithms under the same initial conditions, none of BSOM trials diverged from the correct results but some (about a quarter) of the EM trials became trapped in local minima. 4.2 Spectrum profile estimation Some function profiles such as spectra can be considered as density histograms. If a spectrum consists of many components, then the BSOM can be used to estimate the component profiles of the spectrum. Resampling the observed spectrum will provide distribution data for training. The X-ray diffraction patterns of crystalline complex organic molecules (e.g. proteins) consist of a large number of Bragg diffraction spots. These patterns represent the intensity Fourier transform of the molecular structure (actually the electron density maps), and crystallographers 238
m3
need to determine the precise position of each spot together with its magnitude (i.e. integrated spot intensity). The patterns exhibit relatively high background noise together with spot spreading (due to shortcomings in the experiments or limitations in the detection processes), which results in overlapping spots. The automatic analysis of these patterns is not a trivial task and a variety of signal estimation methods have been employed (cf. [25]). A part of such a pattern image is shown in Fig. 2, which is 8-bit greyscale and of size 88 � 71 pixels. For the BSOM to learn the profiles of these diffraction spots, the image (diffraction intensity function) has to be resampled to provide distribution data. A set of training data (in total 10 647 points) was obtained by double sampling this image. Fig. 3a shows the histograms of the training data. A 400-neuron BSOM, arranged in a 20 � 20 grid, was used to learn this density. In this case, the number of spots (peaks or components) in a pattern (a mixture) will not generally be known a priori. Initially, the neurons were regularly placed inside the data space, i.e. [1, 88] � [1, 71] rectangular grid. The initial variances were assigned equally to a diagonal matrix with the diagonal values equal to a fraction of the grid size, and the initial mixing priors were assigned equally to 1=400. The grid was preordered to save unnecessary computational cost as this is a mapping with the same dimension. After a few learning cycles, the BSOM allocated the spots to the Gaussian kernels and decomposed the overlapping ones. Individual neurons and their parameters provide centre (mean vectors) and width (covariance matrices) information for relevant spots. The total intensity of each peak is readily obtainable and is simply related to
80 70 60 50 40 30 20 10 0
10
20
30
40
50
60
70
Fig. 2 X-ray diffraction image IEE Proc.-Vis. Image Signal Process., Vol. 148, No. 4, August 2001
250 200 150 100 50 0 -50 -100 100
80
60
40
20 0 0
0.03
20
40
60
80
a
0.02 0.01 0 -0.01 -0.02 100
Fig. 3
80
60
40
20
0 0
20
40
60
80
b
Histograms of training data and estimated profiles by a BSOM
a Training data b Estimates
its mixing weight. The result of the estimation after five epochs is shown in Fig. 3b. The number of active nodes, i.e. surviving ones, is much less than the initial guess of 400. The BSOM has dynamically fitted to the correct mixture number and suppressed others. As the updating at each input was limited to a small area (3 � 3, the winner and its first order neighbourhood, in this example), the BSOM required a much lighter computational effort than updating the entire network at each input (as the EM algorithm would require). This becomes particularly advantageous when the number of nodes is large. In this example, the EM algorithm of the same size would require approximately 400=(3 � 3) ¼ 44.4 times more computing effort of the BSOM. 5
Conclusions and discussion
A Bayesian SOM, based on the criterion of minimising the relative entropy, stochastic approximation methods and the SOM principle, is proposed for solving Gaussian mixture densities in an unsupervised manner. The BSOM has been shown, by both formal analysis and experimental results, to be superior to the EM algorithm for the estimation of Gaussian mixtures in terms of robustness, convergence speed and computational cost. The BSOM has transferred the SOM from a minimum mean-square-error based vector quantiser to an entropybased density estimator. The empirical neighbourhood function used in the SOM can be explicitly defined and quantified dynamically according to the learnt posteriors in the BSOM. When the variance matrices tend to zero, the posteriors, acting as the neighbourhood functions, tend to the Kronecker delta and the BSOM degrades to the final stage of classic SOM. The SOM can be seen as a simplified mixture of Gaussian approximators, in which only mean vectors are being learnt. Equal mixing priors and variances IEE Proc.-Vis. Image Signal Process., Vol. 148, No. 4, August 2001
and implied to all nodes. The mixing range is controlled by the neighbourhood size. The neighbourhood function imposes an underlying mixture prototype to the data structure. When Gaussian neighbourhood functions are used in the SOM, as is often the case, the SOM implies a Gaussian mixture to the data density. Larger initial neighbourhood ranges mean little prior information about the data, flatter component distributions and larger overlapping among them. Shrinking the neighbourhood provides an adjustment to the inference and sharpens the component distributions as gradually components are learnt from the data. Although the shrinking procedure chosen may sometimes produce good mapping results in practice, it is entirely empirical. The BSOM’s covergence results, eqns. 3 and 4, are similar to kernel regression concepts [26]. This can be used to infer the role of the neighbourhood function of the SOM as a (predefined) kernel smoother at each winning node on its neighbours (such an interpretation has also been proposed recently in a different context [27]). The similarity between the BSOM and GTM is that both can solve Gaussian mixture densities. There are some differences. The GTM uses spherical Gaussians with identical variance, whilst the BSOM poses no such restrictions. The GTM exercises the EM algorithm, whilst the BSOM is a stochastic approximation. Finally, the GTM employs a low dimensional latent space; this is useful for visualising high dimensional data, whilst the BSOM, mainly proposed for density estimation, places a grid of nodes of the same dimension as the input. The GTM’s latent space method, however, can be introduced into the BSOM to extend its applications. Using a single variance as in the GTM can further simplify the BSOM for general density modelling when a sufficiently large number of nodes are used. However, in some cases (as in the above examples), when the individual profiles are different and their details are desired, only the BSOM will provide a solution. 6
Acknowledgment
This work was supported by a UK Engineering and Physical Science Research Council (EPSRC) grant, GR=M 12889. Authors are grateful to the reviewers for their useful comments. 7
References
1
VAPNIK, V.N.: ‘The nature of statistical learning theory’ (Springer, New York, 1995) 2 TITTERINGTON, D.M., SMITH, A.F.M., and MAKOV, U.E.: ‘Statistical analysis of finite mixture distributions’ (John Wiley, New York, 1985) 3 TRAVEN, H.G.C.: ‘A neural network approach to statistical pattern classification by ‘semiparametric’ estimation of probability density functions’, IEEE Trans. Neural Netw., 1991, 2, pp. 366–377 4 BISHOP, C.M.: ‘Neural networks for pattern recognition’ (Oxford University Press, Oxford, 1995) 5 DUDA, R.O., and HART, P.E.: ‘Pattern classification and scene analysis’ (John Wiley, New York, 1973) 6 DEMPSTER, A.P., LAIRD, N.M., and RUBIN, D.B.: ‘Maximum likelihood from incomplete date via the EM algorithm’, J. R. Stat. Soc. B, 1977, 39, pp. 1–38 7 REDNER, R.A., and WALKER, H.F.: ‘Mixture densities, maximum likelihood and the EM algorithm’, SIAM Rev., 1984, 26, pp. 195–239 8 XU, L., and JORDAN, M.I.: ‘Unsupervised learning by EM algorithm based on finite mixture of Gaussians’. Proceedings of World Congress on Neural Networks, 1993, II, pp. 431–434 9 XU, L., and JORDAN, M.I.: ‘On convergence properties of the EM algorithm for Gaussian mixtures’, Neural Comput., 1996, 8, pp. 129– 151 10 KOHONEN, T.: ‘Self-organised formation of topologically correct feature maps’, Biol. Cybern., 1982, 43, pp. 56–69 11 KOHONEN, T.: ‘Self-organising map’ (Springer, Berlin, 1997) 239
12 RITTER, H.: ‘Asymptotic level density for class of vector quantisation processes’, IEEE Trans. Neural Netw., 1991, 2, pp. 173–175 13 YIN, H., and ALLINSON, N.M.: ‘On the distribution and convergence of feature space in self-organising maps’, Neural Comput., 1995, 7, pp. 1178–1187 14 BENAIM, M., and TOMASINI, L.: ‘Competitive and self-organising algorithms based on the minimisation of an information criterion’. Proceedings of International Conference on Artificial neural networks, ICANN’91, 1991, pp. 391–396 15 WHITE, H.: ‘Learning in artificial neural networks’, Neural Comput., 1989, 1, pp. 425–464 16 YIN, H., and ALLINSON, N.M.: ‘Bayesian learning for self-organising maps’, Electron. Lett., 1997, 33, pp. 304–305 17 BISHOP, C.M., SVENSE, M., and WILLIAMS, C.K.L.: ‘GTM: The generative topographic mapping’, Neural Comput., 1997, 10, pp. 215– 234 18 TARASSENKO, L., and ROBERTS, S.: ‘Supervised and unsupervised learning in radial-basis-function classifiers’, IEE Proc., Vis. Image Signal Process., 1994, 141, pp. 201–216
240
19 KULLBACK, S., and LEIBLER, R.A.: ‘On information and sufficiency’, Ann. Math. Stat., 1951, 22, pp. 79–86 20 HAYKIN, S.: ‘Neural networks: a comprehensive foundation’ (Macmillan College Publishing, New York, 1999) 21 ROBBINS, H., and MONRO, S.: ‘A stochastic approximation method’, Ann. Math. Stat., 1951, 22, pp. 400–407 22 BOX, G.E.P., and TIAO, G.C.: ‘Bayesian inference in statistical analysis’ (Addison-Wesley, Reading, MA, 1973) 23 PRIEBE, C.E., and MARCHETTE, D.J.: ‘Adaptive mixtures: recursive nonparametric pattern recognition’, Pattern Recognit., 1991, 24, pp. 1197–1209 24 KOSKO, B.: ‘Stochastic competitive learning’, IEEE Trans. Neural Netw., 1991, 2, (5), pp. 522–529 25 HELLIWELL, J.R.: ‘Macromolecular crystallography with synchrotron radiation’ (Cambridge University Press, Cambridge, 1992) 26 SILVERMAN, B.W.: ‘Density estimation for statistics and data analysis’ (Chapman & Hall, London, 1986) 27 MULIER, F., and CHERKASSKY, V.: ‘Self-organisation as an iterative kernel smoothing process’, Neural Comput., 1995, 7, pp. 1165–1177
IEE Proc.-Vis. Image Signal Process., Vol. 148, No. 4, August 2001