The programs, listed here, avoid the use of special Apple commands as much ..... 1410 FII !, I 11 Zl FIIl ⢠1 11 hCmD ⢠Clm + llllmi I~ IM I~ I m +. I+ + l~II II ~nllB'i ...
Physiology&Behavior,Vol. 32, pp. 707-710. Copyright© Pergamon Press Ltd., 1984. Printed in the U.S.A.
0031-9384/84 $3.00 + .00
Behavioral Sequences as an Easily Quantifiable Parameter in Experimental Studies B. M. S P R U I J T A N D W. H. G I S P E N 1
Institute o f Molecular Biology and Rudolf Magnus Institute for Pharmacology State University o f Utrecht, Utrecht, The Netherlands R e c e i v e d 16 J u n e 1983 SPRUIJT, B. M. AND W. H. GISPEN. Behavioralsequences as an easily quantifiableparameter in experimentalstudies. PHYSlOL BEHAV 32(5) 707-710, 1984.--In behavioral pharmacology frequencies and/or durations of postures are used as easily quantifiable parameters. However, significant information is also contained in the sequential order of the different behavioral elements; structural changes in behavior are not necessarily reflected in the totals of durations and frequencies. Furthermore, observed changes in these parameters might be better understood if the change in structure is known. Presently, parameters for sequences are barely used, probably because they require larger groups of animals and more sophisticated computer programs. In this paper a procedure, using a simple set of computer programs (see Appendices), is demonstrated for transformation of behavioral sequences into transition matrices, including a procedure for creating the minimal number of transitions required for further statistical analysis. Behavioral analysis
Sequences
Computer programs
IN psychopharmacological studies, quantitative assessment of the structure of animal behavior has been restricted because the observation, as well as the analysis, of the parameters are time consuming and therefore difficult to adapt to experimental designs in which demonstration of differences in behavior as a result of experimental manipulation is the main purpose. However, current techniques for recording animal behavior using a microprocessor can be used for registering behavioral sequences. In addition, changes in frequencies might be better understood if one knows which transitions are affected by the experimental manipulation. The present communication outlines a procedure which demonstrates how sequential events can be recorded and how flexibility in further processing of these data is retained, since all raw data remain available. The proposed procedure was applied in a short experiment in order to reveal the structure of the well known ACTH-induced excessive grooming.
RAM. The system includes a clock card, two disk drives and a printer. Any comparable system might be used.
Software The programs, listed here, avoid the use of special Apple commands as much as possible to improve compatibility with other types of BASIC. Processing has been divided in several sections (see Fig. l): I. Registration of animal behavior, II. transformation into a transition matrix of every individual session, III. addition of matrices of the different sessions, IV. calculation of adjusted residuals of final matrix per group. 1. The program for registration can be used for simultaneous observation of two animals. The program asks for the number of defined behavioral elements and arrays them in two sets: one for each animal. An estimate of the total number of expected elements must be given in advance in order to reserve enough memory. In principle, every key on the key board may represent a behavioral element. With the touch of a key, the clock is read and the time stored in a separate array. This program simply stores sequences of behavioral elements and their concomitantly registered time points in different arrays with the same index. These data are stored on disk under different file names and are always available for further analysis. 2. The next step is to generate a matrix from this sequential order of elements. Usually the last occurring element(s)
METHOD Registration of sequences of behavior requires continuous observation of every animal. In our laboratory a special room with reversed day-night cycle is used. A closed television-circuit allows observation from another room.
Hardware The computer used is an Apple-II Plus, with 48K of
IRequests for reprints should be addressed to W. H. Gispen, Inst. of Molecular Biology, Padualaan 8, 3584 CH Utrecht, The Netherlands.
707
708 is (are) considered as preceding, thus without taking the duration of that (those) element(s) into account. This approach leads to poorly filled matrices. Our procedure considers all behavior occurring in a certain time interval (bout-length) as preceding. This time interval can be chosen by the experimenter. The longer the time interval, the more behaviors will be considered as preceding. This means that the effect of a certain behavior on following behavior is thought to depend on the time interval between the two behavioral elements. In addition, when two behaviors are separated by a long-lasting behavior (sleeping) they are not considered as a sequence, but when they are separated by a short-lasting behavior they are. Moreover, sequences of short lasting elements appear in several cells in the transition matrix leading to a better filled matrix. The criteria one should take into account are as follows: the minimal number of transitions should be 5 times the number of behavioral elements [1] and that not more than 20% of the cells may contain a value lower than 5 [4, 5, 13]. This program does not search automatically for the best discriminating bout-length, but such a subroutine can easily be added. The problem of having matrices with too many zeros can be avoided by lumping different behavioral categories or by prolonging the bout-length. When two animals are observed simultaneously a transition matrix for each animal is generated. Behavioral interactions between animals may be analyzed by generating two additional matrices: the behavior of animal A followed by the behavior of animal B and the behavior of animal B followed by the behavior of animal A (see Fig. 1). Since the attention in this paper is focussed on the sequential analysis, the subroutines in the program for calculating frequencies and durations have not been included (but are still available on request). 3. When the appropriate bout-length is chosen and all matrices of the individual sessions have been generated they can be summed. The final matrix can be followed by a program to calculate the adjusted residuals, and if necessary, different matrices can be compared by a CHl-square. A more detailed discussion of the statistical assumptions underlying the performance of a CHI-square on a transition matrix can be found in Colgan et al. [5]. 4. The method for calculation of adjusted residuals is described by Everitt et al. [6]; adjusted residuals represent the difference between the observed value and the expected value; the adjusted residual is expressed according to a Z-distribution, so p-values can be found in a statistical Z-table. The adjusted residuals are a measure appropriate for composing pathway diagrams. Often in behavioral studies, especially when the transition matrix is not based on all behavior occurring in a discrete time period but on the last preceding element, a behavioral element by definition cannot be followed by itself and this will lead to empty diagonals in the transition matrix. CHIsquare cannot be performed on such a matrix. To calculate the true expected frequencies the method described by Goodman was used [9]. The program presented here provides for correcting empty diagonal cells (see Appendix 4).
SPRUIJT A N l) GISPEN Key 1 Key 6
,,- 5 for A n i m a l A ,.-10 f o r A n i m a l B
Sequential o r d e r of e l e m e n t s : i -- 6 -- 3 - 2 - 7-- 8 -- 9 S e q u e n c e of a c c o r d i n g t i m e p o i n t s : T1-T2-T3-T4-Ts-T6-T7(secl I
I I
.
(1 secI
(3 see)
B1
I
B2
following 12346 2 3 c:D4
transitions within
6 76910 transitions
from A to B
A
•-~ 5 "O ~3 O~ 6 transitions 8 9 I0
from B to A
transitions within
B
P R O G R A M ]~ Registration of sequence of elements and -]~storage on disk of these raw data according time points
PROGRAM II Calculating t ransition matrix
I
If m a t r i x n o t optHmally filled changes bout- length ~.~-storage of m a t r i c e s on d i s k
P R O G R A M TIT Adding
matrices
~ storage of this result on disk P R O G R A M IX:
Calculating ~.~ adjusted print-out
~ pathwaydiagram
residuals
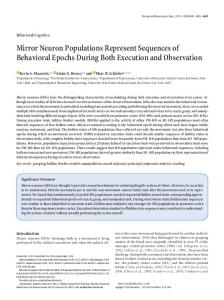
FIG. I. The sequential order of elements and according time points are transformed in a transition matrix by defining a fixed period of time. The longer this bout the more transitions--compare BI (one preceding element) with B2 (3 preceding elements)---are accounted. The transformation from a string of elements into a transition matrix is performed in program II. From every individual session the raw data and an optimally filled matrix remains available for further analysis. The separation into the four different types of matrices representing the four different types of transitions, which can be distinguished--sequential order within the repertoire of animal A, within the repertoire of animal B, elements of A preceding the elements of B and elements of B preceding the elements of A--occurs in program IV.
Experiment
The described technique for quantification of behavioral sequences was used for a detailed description of ACTHinduced excessive grooming [7]. Fourteen male Wistar rats were cannulated according to the method of Brakkee et al. [2]. All animals were continuously observed for 55 rain. Rats
were treated with either saline or 1/~1 of ACTH dissolved in 3/xl of saline both 15 rain prior to the observation. Durations and sequences of the 6 elements of the grooming repertoire were recorded. The resulting transition matrices were trans-
BEHAVIORAL SEQUENCES
A
709
tdi
.~.
,
B
fill
FIG. 2. Pathway diagram of grooming behavior in the rat after intracerebroventricular administration of saline or ACTH. Element durations and transition frequencies were calculated (see text) for proper structure comparison. Area of the circles represents element duration. Thickness of the arrows indicates the frequencies of transitions (adjusted residuals), h face washing; 2: body shake; 3: body grooming; 4: vibration; 5: scratching; 6: tail sniffing; 7: anogenital grooming.
APPENDIX ~ -
E 111~ 5441AEli lie ID li ~ APPENDIX I
II II, I II lllll I
ill I
I I I
-
Regzstrating
~ e q u e r ~ c e s and
according
time
Adchng matrices
I~ I N
II~ I~[f)?'iil
II IIl•'l'll~ I~$II + + '111[ I l l ~ l ' l | l i + l m R I l • I ~I il ~ I i • I I~ 21 ~III~ llll Illlll ~ ~ 'lllIIl+Jl i k 111 I ; I I I l 1410 FII ! , I 11 Zl F I I l • 1 11 h C m D • Cl~m + llllmi I ~ IM I ~ I m + I++ l~II II ~ n l l B ' i I~I~ : I I ~ ' I I I I I IIIII~121 ~ 0 Z41141/'pTIII I I T I +
points
!'i41
I~ IIYl I T II II[ III i fillI 1 ~ ' l l II Till Ill lllh III Ill+IT:~ CIl~lliIll IIIhH ' I llh Ill II411lDIII flY) I# F 1 1 1 1 1 1 1 1 t T I I I I • WillS11 fill ~'I° Ill I~ll~ I~ IF I ) i II~I Ill I&~ 1411)1111~1 IIIII Ill II Ill " II ' I n l Ill
~1 ~11 1 • l 111l; I!1 1 1 I I I II Lllllll ' ~11111111EI II MIIII i l l : "~ I ~ k II11 I1~1III • I
ill IIll • k Ill I i l l IllUl I I Inl~I • 1 8 I ~ l l K ~ l l l l i + ; l l i l l : I I + " i L P : I I • I I + " l P i II111 l l i ' l g ' 1 0 1 1 m i l l l l l l t l l P l l i l l l l lllli I - I i l l f l l 41: I I 1 " II I I ! llllli'i'°llt1411 ~lllll I I I l l f l I 1011 + l . | l I lll~l i l l ~: III111 l t l l ' l l I 11 • T i l • I t t I k l " I # % l p : l l • I i %PI ! I I i l l l l l i I I I fill I • I ! 1 " II ttllT l l l l l l I ' l l l l l N i l I I I l i l i t II I!llll N i l ' I l l I II 12~I llllll l l l l l l l l I P i M I I l t l ' l l ' I l l PEIII l l I ~ t l r l l i IIMT ' ~lill I lll°lilll Illil lllll# lilll I • N i l i141,131ldili/t41 : I l l l I l l . i l i l l i l • i l l I I l I l t l l i I i l l • I l l l I l l l l l l i l : l ~ IlL I l l i l • I IE1411:nlll • I l l l l l l 1141~ID 41. ! ItlllOI 1/,i0 $ • IS + 1 I 1 + ~t~10 1 UI +411 llll0: I 1 ~ Ell
+il ~ ~ • H! Illl'lll:ll • I I ( l ) : l l • Ill + ,+1~':11 • I I + "~1+ $21 I I • II + II ]~ 11 • I ~ ~I i ~ i l l l u ~ l l l i 114111I I M11111 I I I I I I I | D I } ClIlDll • I ~3~ PIIII l l i ' l ~ l l l l I I II i I ~ Pa ~II I • I i k l • I i It I NI'I~IIIII + 141+BI ~ I~ I ~ | I ~IIII I I I ~ U I ' I I I I ~ II I l l ~II IIII I N ~ I I I g t I l • I I I ? (4111)'IJ11 IFF~ ( ) ' P I I I I I I I ~ I ~ II~ ~ I • I • I • 1 1 ' l l k l l • I~ + %1~'111 1 I I + ' , P I H i l l lll'IfgPlll Jill ~11 1 1 I IM+ ~ 1 1 1 , I +1~1 • I t 1 141[t PIII~ MIqllIl~'lltlll IqRIl EIIIIII 11~ H I l l t(l~l): i ' l l ~ !11 I~ refill I I I ' ~ t l I P I U l l • 0
APPENDIX 4 ~ C a l c u l a t i n g APPENDIX 2 matri~
-
Sequential
data
transformed
into
i~ 21 l~ 41 ill Ill
11111 ° l l l l I l l l llTI I I I l l f 1~1111 t l l l i l l . l l 11 I l l f 2" IIlll I ! l l l f11I'111141 • II11141 I l l l l l : l • WL I111:1 • I llPUlI ~;llill • I 141) I l l Ill+Ill I I I l l I 1,l I l l i I11 I i l I l l l I 11 I I • I I i "ll. Illlll ' i l • I i " i P i 411nll i l l l l l 11111 i l l I . i l i l l I 1 li I I I fig + I I i I I I I I I t II t l l I I * I I I I l l • I + li I I I I 1 l t ; l l l l l l I ll12111111l • Illl (111ll I l l l l + 1.51 t I l l ~ I I : 11111 l t l l ~ t I P I l l l : l
i
II • 'i'll
a set
of
four
matrices
lit m ~
Till • I
710 IFFI • 2 I1®1 1 • I # 211, DI i Ill • l I l PI$ I f l l l T l g l , l : l , 1 1 2 1 1 , 1 1 1 : l , I
• I
: C
ill # ; IN + ',~i12'111 + M ÷ , l l ' : llil I I t l ' l l i~l Fil Sl : I /~ Z: F~I $2 : I Ill i:m = I + h l!lllt l l l ' i l l l T f ' i l t l l :
for
?Ira 14111111~l l l D l l Dl , Z l ZlY , l l l
• I i l l i l • In i " i l ~ ' l l l , I + % P
~1~ 11111 l i l ' l P D ' i l l : F I I I • 211 I~1 • I + II l t l l l l l l ' 1 8 1 ' l l l l l l l I M l I l l l i l i t II l l l l i l t i ' ~ U I ' i M : l l i t ! 1 + I I l l - l:lll • 1 If0 l • I l l l - TII - I h IF l f tl lltll I • I + I: lit0 I l l l i t NIR • l i d - TII - 131 l l ) IF I I I I < • I I l M I I I I - I~1 ( = 1 I l l i b 41111I - I~11 : 411111 - lal) + l i t i l l 0 4410 I l l 1~ I I I I ) I I l I l l I l l - I~I ) I / ) I l l t 411111 - I~11 : l l l l l - 1311 + Will m I l l I l l 141I~ : I l l l l ITO 4410 ~ll, I~+ I1 l l l l l i t I l l I I L : 1 I IIIIIII1+11I - LII • I l l l l l , l l l - Ln + h !11 L : I . 01 111 I: 112 0 li~ l i l l l ' l l t l l l i IlllllIl" I f l 11 : I I1 h I I L = I 19 II t1111, 'II411~LII: 1141 L: PIlIT t !11 rl 131 t i t 0 I12 Illlll " i l l l I l l l l l I I l l l ' i i l : 14111 ( ~ ' P I i~ll i141 i l l I I l i l 'I141f ! I1111 IIif Lilt 11 i I it~ltll ltlf I f l l l ' i •
residuals
3t It • t m (ill IlYl ~ i 111 Fgt'l•:le : 14 + "lL$,ll'lll i • + %1" ]~ 15 • Illml (•+l)ll i Ilk (111 411 I l l Ill~l)l I111li'IZ,ID Illl ~ l l l : I I | ITIII: Dill • 1 | ) : I l l Drill IIII FIIZ): Im 4111111 Dill {I[jD q PRLIIINI'I~IPIIIIII • I1 FI! TI • 1 l0 ]1 FII 12 1 1 i l Z I I , I * I1 H i l l • I ' I I P I I I I ~ I ~ / d l I I T I D 41• I , I I I DI I I ( l l l
a transition
m i l l I l S l l l l h •11 l l : •11 I l l Pllli l l i . a m . ; l ! l
~31 1 4 1 1 , 4 T l I + , Z I 2 1 1 , l I l I I , I : + : l I l l F I I I : l I I I: ~II I~ • I ~0 + I ~ If I + I ~ IT~I+I~I i llllllnl
I~
IF I • ;H1B IIUil - 1 I lllR} • lll+l~l
124 If I , 3 I1£1 S+HIIII9 - I I 21 • I{~lml lei ff ] i 4 lllfll I l t l l - l I 2lift + l / / I • IIRII•I l I T IIi ~ Nil MIIII PI~ It PIIII I 41~1 PIIIII I t~l t IItN I I I = i 1 21 ~II m • I 111 I: ~II I~ • I IU 2111 i IT • ~ I l I , t / h [ l • K1 + ~II~IIID •IT l~l~llll mI~
141 f l l ~ 'tlIll111.
'11' " I I I ' I J I I l T & I .
'11" "11
~I~ l~(ll) + ~ I l I l l ) • R l l l l h ~ I l l ) • ~ l l I l l I l • IPDIDII~I • l+l~ + Ii ~ | I t m fm 11 • 1 10 D PIII/ ' W l I 1 D I B I I ~ I ' : PIIII : F • P~ • l 10 1:~11 il • I I~ 11~ • ~ * l a l l l h 1411 4 , I I ~ I I • ~1 I I ~ l i t Sl Illi f01 ~/ : I ~ IIKIIEI : 1011El I nit * ITIEDIW z I~(EI + Ill: • P / E : ~1 ~ • I TI 111t11551 = Illl~l I tilt - Illl~llt 11141~31111 : (lilt • It l I T 14 1210 I 0 ~ , I lll]l F I I ~ , I TIT
Ilm IT • I / I ~ I - llI~I I I~Ik31 I / ~ [2 = ~ IllIlll I [IIl~lli IF El • I / 1 8 E = l: E l i I ~ I m E , El I [~: 11 ~ 0 , M I ~ t • + II/e v l l , iI - I l l ) ; itl l (I - l~Iim) + IIi 1311~lli : g l I I V I D t 4 1 , [ / I I I I C t + , ~ ) : I : I : | I L 0 ¢ 1 1 : li111I:l+lltm:~IIi11'
';:IIT~IPtlII+III~IHIIII:IIII
7m El
formed into pathway diagrams. The width of the arrows representing transition frequencies were based on the adjusted residuals. The area of the circles represents the duration of the behavioral element concerned. RESULTS
The pathway diagram in Fig. 2 demonstrates how the structure of ACTH-induced excessive grooming is visualized. As is already suggested by Gispen and Isaacson [8],
the structure of the grooming bout itself is not changed by ACTH and the number of bouts is also similar. The duration of the bouts, however, increased: because of the resumption of the grooming bout before its termination. Most grooming bouts started with vibration or face washing (Fig. 2, 1 and 4), whereas scratching or tail sniffing ended a bout. The main transitions in both groups are in a cephalocaudal direction from head washing to body grooming to anogenital grooming. Thus, the structure of grooming seen under these condi-
710
SPRUIJT AND GISPEN
tions in saline-treated rats is comparable with home-cage grooming behavior as observed previously by others, also [12] in the present study scratching was unpredictable and interrupted the bouts. In Fig. 2B some extra transitions appear to be responsible for restarting the bout. Body shake and scratching led to hand and face washing (from 3 to 2 and 5 to 4). DISCUSSION This method provides an instrument for describing differences (or similarities) in the structure of behavior between groups of animals. The use of the adjusted residual as a parameter for transition frequency allows statistical interpretation. In our study the significant transitions in the salinetreated group were also found in the ACTH-treated group (all grey arrows, Fig. 2). Moreover, this diagram contained some extra significant pathways. A simple representation of transition matrices, for instance via a log-transformation, may be useful for illustrative purposes, but it prohibits further statistical interpretation. The analysis demonstrates that an experimentally in-
duced change in certain transitions results in an increase m a functional system. The occurrence of the interrupting shaking and scratching leads to a resumption of the grooming bout. The retention of a normal structure in ACTH-induced grooming is an argument in favor of the biological significance of the phenomenon. In this study, the structure of social behavior is not considered; but the same programs have been used for comparing socio-sexual behavior from several inbred-lines of Drosophila melanogaster[14]. It was demonstrated that the information content of the sequential order of courtship acts of the males is used by the females in sexual selection. Crosses between inbred lines showed genetic determination of the sequential order. It is concluded that subtle analyses are available for experimental use when ethological methods and modern recording techniques are combined. The processing of raw data with different sets of programs is not more time consuming than comparable programs already in use [3, 10, I I ]. A very clearly written survey of alternative methods for analyzing sequences of behavior can be found elsewhere [15]. Additional information about the described programs or others in use in our laboratory are available on request.
REFERENCES
1. Baylis, J. R. A Quantitative, comparative study of courtship behavior in two sympatric species of the genus Cichlasoma. Ph.D. Thesis, University of California, Berkeley, 1975. 2. Brakkee, J. H., V. M. Wiegant and W, H. Gispen. A simple technique for rapid implantation of a permanent cannula into the rat brain ventricular system. Lab Anita Sci 29: 78--81, 1979. 3. Carroll, M. E., P. A. Santi and L. R. RudeU. A microcomputer system for the control of behavioral experiments. Pharmacol Biochem Behav 14: 415--417, 1980. 4. Cochran, W. G. Some methods for strengthening the common X-test. Biometrics 10: 417-451, 1954. 5. Colgan, W. Quantitative Ethology. New York: John Wiley and Sons, 1978, pp. 106-109. 6, Everitt, B. S. The Analysis of Contingency Tables. New York: John Wiley and Sons, 1977. 7. Gispen, W. H., V. M. Wiegant, H. M. Greven and D. De Wied. The induction of excessive grooming in the rat by intraventricular application ofpeptides derived from ACTH. Structure-activity studies. Life Sci 17: 645-652, 1975. 8. Gispen, W. H. and R. L. Isaacson. ACTH-induced excessive grooming in the rat. Pharmacol Ther 12: 209--246, 1981. 9. Goodman, L. A. A short computer program for the analysis of transaction flows. Behav Sci 9: 176-186, 1964.
10. Hendrie, R. C. and S. Bennett. A microcomputer technique for the detailed analysis of animal behavior. Physiol Behav 30: 233-235, 1982. 11. Murray, R. B., D. E. Gmerek, A. Cowan and R. J. Tailarida. Use of a programmable timer and data logger in the monitoring of animal behavior. Pharmacol Biochem Behav 15: 135-141; 1981. 12. Richmond, G. and B. D. Sachs. Grooming in Norway rats: The development and adult expression of complex motor pattern. Behaviour 75: 82-95, 1980. 13. Siegel, S. Nonparametric Statistics for the Behavh~ral Sciences. New York: McGraw-Hill Book Co., 1956. 14. Van Dijken, F. R., B. M. Spruijt, D. W. J. D. Van Vliet and P. Wilbergen. The pattern of female and male sexual behavior of three inbred lines of Drosophila melanogaster. Anita Behuv. 1984, submitted. 15. Van Hooff, J. A. R. A. M. Categories and sequences of behaviour Methods of description and analysis, In: Handbook ~f Non-Verbal Communication Research, edited by P. Ekman and K. Scherer. New York: Cambridge University Press, 1982, pp. 362-439.