Chuan-Fong Shih & Alladi Venkatesh
Beyond Adoption: Development and Application of a Use-Diffusion Model The study tests a use-diffusion model in the context of home technology use. The authors combine two constructs, variety and rate of use, to yield four user segments. The results show that user segments vary on the basis of social context and technological makeup of the household as well as personal factors and external influences. Furthermore, user segments differ with regard to users’ satisfaction with technology and interest in acquiring future technologies.
n the field of marketing, research on new product diffusion has traditionally focused on the adoption perspective (Dickerson and Gentry 1983; Mahajan and Muller 1979; Midgley and Dowling 1978; Rogers 1995). We label this the adoption-diffusion (AD) paradigm, which examines the process by which an innovation reaches a critical mass of adopters, the diffusion is accelerated, and innovation is considered successful (Mahajan, Muller, and Bass 1990). Recently, researchers have pointed out the limitations of the AD model, stating that though diffusion processes cannot be understood without studying the nature of adoption, to complete the diffusion story, use-diffusion (UD) processes also need to be examined (Anderson and Ortinau 1988; Golder and Tellis 1998; Lewis and Seibold 1993; Roberston and Gatignon 1986).1 This is especially true of some consumer technologies for which their complexity and evolving nature indicate that the trajectory and time scale of diffusion can be quite prolonged. Accordingly, our current research extends the diffusion concept further with a systematic study of postadoption UD. We believe that the UD framework offers some motivating theoretical and managerial implications for ongoing research in this area and for market segmentation and product development. The specific research questions in this study are as follows: (1) What are the characteristics of UD? (2) What are the determinants and outcomes of UD? (3) Given that users might display different use patterns in
I
1To quote Robertson and Gatignon’s (1986, p. 3, emphasis in original) seminal article, “[T]he speed of diffusion of technological innovation depends on the consumer’s ability to develop new knowledge and new patterns of experience.… Because the emphasis is on technological innovation, adoption is not the only relevant concern of diffusion research. The degree of use of that technology is an important variable that describes the extent of diffusion of that innovation.”
Chuan-Fong Shih is Assistant Professor of Marketing, Babcock Graduate School of Management, Wake Forest University (e-mail: eric.shih@mba. wfu.edu). Alladi Venkatesh is Professor of Management and Computer Science and Associate Director of the Center for Research on Information Technology and Organizations, University of California, Irvine (e-mail:
[email protected]). This study was funded by the U.S. National Science Foundation Grant Nos. IRI-9619695 and SES-0121232.The authors gratefully acknowledge the helpful comments of the anonymous JM reviewers. The authors are listed alphabetically.
Journal of Marketing Vol. 68 (January 2004), 59–72
terms of variety and rate of use, how can users be classified into meaningful categories? and (4) How can the results of our study of UD provide insights or input into market segmentation and new product strategies? To address these research questions, we propose and test a model of UD that can be applied to a range of consumer durables with multiple applications. Examples include, but are not limited to, computer hardware and software, wireless telephones, personal data assistants, home entertainment systems, videogame consoles, and “smart” home appliances.
UD Theory and Model Description Before we present the theoretical UD model, we briefly discuss the underlying structural differences between AD and UD (see Table 1). The variable of interest in the AD model is rate or time of adoption; in the UD model, the variable of interest is use or, more specifically, rate of use and variety of use. The theoretical considerations for the AD model include an S-shaped diffusion curve, speed of penetration and critical mass, and a two-step model of diffusion. The corresponding theoretical elements for the UD model are the evolving nature of use (rate and variety), sustained continuous use (or disadoption), and technology outcome considerations (technology integration, perceived essentialness of technology, impact of technology, and user proneness to adopt new technologies). The standard diffusion theory states that the diffusion curve is divided into three stages: (1) introduction, (2) growth, and (3) maturity. The theory further states that along the diffusion curve lies a typology of adopters (innovators, early adopters, early majority, late majority, and laggards). In the UD model, the proposed categories (which we elaborate on in the next section) are intense users, specialized users, nonspecialized users, and limited users. The models share some common constructs (innovativeness, social communication, complexity, media influence, and relative advantage); however, these constructs may not be identical in their content. For example, adopter innovativeness is not the same as use innovativeness (Price and Ridgeway 1983). There are also criteria that differentiate the models. Unique to the AD model are observability, compatibility, and trialability (Rogers 1995), whereas the UD
Use-Diffusion Model / 59
TABLE 1 Comparing Characteristics of Adoption-Diffusion and Use-Diffusion
AD
UD
Variable of Interest
Typology of Population
Relevant Criteria
Elements Unique to Each Model
Adoption
Innovators Early adopters Early majority Late majority Conservatives
Timing or rate of adoption
Observability Compatibility Trialability
Intense users Specialized users Nonspecialized users Limited users
Rate of use Variety of use
Use
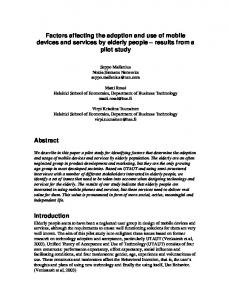
model includes experience with technology (positive and negative), competition for use (among multiple users), sophistication of technology, and satisfaction from use. A Conceptual UD Model The conceptual model that guides our work is presented in Figure 1. The model has three key components: (1) UD determinants, (2) UD patterns, and (3) UD outcomes. Each of these components has some subcomponents. Although all three components are integral to our model, UD patterns (i.e., the typology of uses or, derivatively, typology of users) occupy a special place in the model because of the key role they play in UD. We therefore begin with use patterns.
Product experience Competition for use Sophistication of technology Satisfaction
Elements Common to Both Models
Innovativeness Social communication Complexity Influence of media Relative advantage
UD Patterns We conceptualize usage as comprising two distinct dimensions: variety of use and rate of use. Variety of use refers to the different ways the product is used. Usage rate refers to the time a person spends using the product during a designated period. Although it is conceivable that variety and use are correlated (i.e., the higher the variety, the higher the rate is), their exact relationship has not been empirically examined. However, Ram and Jung (1990) and Ridgeway and Price (1994) note that a higher rate without a higher variety of use may signal routinized needs. Furthermore, different antecedent factors may influence rate and variety of use, and thus they should be treated as distinct.
FIGURE 1 Use-Diffusion Model Determinants of UD
Outcomes
UD Patterns
Perceived impact of technology
Typology Variety of Use
Household Social Context - Household communication (HCI) - Competition for limited resources (USERSPC) - Prior experience with technology in the family (YEARSPC) Technological Dimension - Technological sophistication (PCAGE) - Complementary technologies (TECHOWN) Personal Dimension - Use innovativeness (INNOVATE) - Frustration with technology (FRUST) External Dimension - External communication (ECI) - External technology access (OUTACC) - Family exposure to target media (HHMEDIA)
High
Intense use
Nonspecialized use
Low
Specialized use
Limited use
Interest in future technologies
High Low Rate of Use
Feedback (not tested)
60 / Journal of Marketing, January 2004
Satisfaction with technology
The combination of variety (low/high) and rate (low/ high) yields a fourfold typology of use or users (Figure 1): intense, specialized, nonspecialized, and limited.2 Intense use describes situations in which an innovation is used to a significant degree in terms of both variety of use (time spent per week) and rate of use (number of applications). With specialized use, the focus shifts to increasing rate of use. Such usage behavior essentially treats the innovation as a specialized tool (Tinnell 1985). Nonspecialized use refers to a pattern of use in which variety of use is more critical than rate of use. Such a pattern best (though not exclusively) describes usage based on trial and error. Finally, limited use refers to low variety of use and low rate of use; that is, users find little, if any, worthwhile application potential and therefore relegate the product to a relatively minor role, even to the point of “disadoption” (Lindolf 1992). Note that the fourfold typology we have put forward has face validity because it distinguishes four types of users on the basis of use characteristics, which is the focus of our study. Note also that at any given time, the typology represents mutually exclusive sets of user segments (i.e., a user can belong to only one category); however, user identities need not be fixed over time (i.e., users can move from one category to another given their needs and other situational factors). For example, an intense user may settle down to a routine of limited use over time and thus be reclassified as a specialized user. Such movements between segments are not uncommon in a marketing context, as is noted in psychographic research in which people undergo lifestyle changes and move from one category to another. We present four dimensions that may affect the patterns of use we have described: (1) the household social context in which the user operates, (2) the technological dimension (characteristics associated with the innovation), (3) the personal dimension (e.g., use innovativeness), and (4) external factors (external communication and media exposure). Rate of use represents temporal patterns of use and depends on the user’s specific needs at a given point in time and is less influenced by interactions with others. If a person needs to do more of the same thing that he or she has been doing, that person knows the basis of his or her activity and has less reason to communicate with others. However, if the person is engaged in different activities in connection with technology, he or she is probably exploring different possi-
2Previous researchers, including von Hippel (1986, 1995) and Hahn and colleagues (1994), have attempted to extend the diffusion framework by proposing similar typologies specific to their research concerns. Although both authors’ studies are relevant to our current research and provide the right motivation, there are some key differences in terms of both the theoretical basis and the empirical questions. Von Hippel’s basic interest is identifying lead users in the industrial context and differentiating them from non–lead users. Our focus is on consumer households in the context of their use of complex technologies. In addition, our fourfold typology of users is based on different criteria. Hahn and colleagues focus on a repeat trial model of nondurables (e.g., medical products), whereas our focus is on use-diffusion patterns among users (not repeat users) of durables.
bilities and thus may want to communicate with others because of limits to his or her own knowledge. Variety of behavior implies a process of discovery and thus offers a greater scope for innovativeness. We place variety of use on a slightly higher plane than rate of use because it represents a more complex behavior and involves a higher cognitive effort. This distinction has motivated the way we postulate different hypotheses in our study. Household Social Context The marketing literature recognizes the importance of the social context as a key aspect of diffusion (Fisher and Price 1992). The household social context consists of three variables: (1) household communication, (2) competition for limited resources, and (3) prior experience with technology. Household communication. Literature on diffusion of innovation has always stressed the importance of interpersonal communication (e.g., Kraut et al. 1998; Valente 1995); Dodson and Muller (1978) have shown the key role of wordof-mouth communication in the diffusion process. Communication can be quite intensive in close-knit groups (e.g., families) (Reingen and Kernan 1986). When the user can discuss questions with others, particularly with more knowledgeable users, information can be quickly exchanged to overcome difficulties in using the technology (Kiesler et al. 2001). In contrast, when users are unable to resolve a situation alone, they may be discouraged and either limit the amount of time spent on the technology or abandon it altogether. In addition, it is not the mere existence of communication in the social network that is influential; the level of interaction or intensity of communication also plays a significant role (Blonski 1999; Wasserman and Faust 1994). Although communication is central to usage behavior, its role as applied to rate of use is limited because people are less likely to want to communicate when they are doing the same thing over and over again. When people attempt different things in connection with the technology, there may be a greater need to communicate or consult with others for assistance. Thus: H1: Higher intensity of communication with other users about the product leads to higher variety of use.
Competition for limited resources. Tensions arise because of possible claims to resources that are not available to all members of a social network at all times. Daly (2001, p. 290) calls this “the presence of negative valence.” Salazar (2000) has found that family members negotiate social boundaries in sharing technological space and that electronic and space boundaries are instrumental in determining who uses the computers and when. In Lee’s (2000) work on WebTV, he found that family members, especially children, compete among themselves to watch WebTV. By implication, we argue that limited technological resources have a negative impact on collective use of the technology. However, competition for resources implies access to technology, and access is limited by the amount of time a person can spend with the technology. People do not necessarily compete for how to use the technology (variety), but for how much time to allocate in using the technology (rate). Thus, competition affects rate of use, not variety of use. Use-Diffusion Model / 61
H2: Competition for technology in the household results in lower rate of use.
Prior experience. In addition to interpersonal dynamics, the updating of users’ knowledge may be a relevant variable in predicting the direction of UD. The complexity of technology suggests that user knowledge plays a critical role in shaping the UD pattern (Alba and Hutchinson 1985; Kiesler et al. 1997, 2001; Norman 1999). Technologies change rapidly; thus, users need to update their knowledge to reach a more advanced level of use. User knowledge can come from accumulated experience, which provides users with the skills they need to recognize situations in which the technology can be applied and how to apply it. Hahn and colleagues (1994) refer to positive effects of “direct product experience” as a key precondition for triers (adopters) to become repeaters. Thus, when people gain greater experience with technology, they have developed some efficiencies and perceive themselves as dependent on the technology for their continued use. At the same time, people’s experience teaches them to become more familiar with the technology and its different possibilities, which positively affects both rate and variety of use. Therefore, we hypothesize the following: H3: Higher accumulated product experience results in higher variety and rate of use.
Technological Dimension The technological dimension consists of two variables (technological sophistication and use of complementary technologies) and refers to the overall technological environment. Technological sophistication. Technological sophistication includes the inherent characteristics of the technology, that is, its versatility and capabilities. Technology can be sophisticated without being difficult to use. For example, compared with automobiles of 25 years ago, automobiles today are more technologically sophisticated, but they are also easier to drive. The capabilities of the system define the boundaries of what users can do with it. In general, we expect users with access to more-advanced systems to exhibit a greater variety of use. At the same time, we believe those users are comfortable with the level of technological sophistication and will want to spend more time with the technology, leading to higher rate of use. Thus, we hypothesize the following: H4: Use of more-advanced technology (i.e., technological sophistication) results in higher variety and rate of use.
Complementary technologies (household technological density). Use of any technology must take into consideration the use of other technologies in the home; we refer to this as the “technological density of the home.” Rogers (1995, p. 224) originally proposed this idea, though he refers to it as “technology clusters.” According to Rogers, the existence of technology clusters influences the rate of adoption of new innovations. Vitalari, Venkatesh, and Gronhaug (1985) proposed and tested a similar idea under the rubric of cognate technologies, which share similar characteristics and can be 62 / Journal of Marketing, January 2004
either competing or complementary. In general, competing technologies act as substitutes, and a new technology can displace an existing technology if its performance is superior or more acceptable. This idea is similar to the notion of relative advantage, which is commonly cited in the diffusion literature. Complementary technologies create synergistic effects; that is, they increase the level of use of all the technologies in the cluster. Technology clusters introduce new possibilities for technology use and the ability to exploit the technology in different ways (variety). H5: Use of other complementary technologies results in higher variety of use of the specific technology in question.
Personal Dimension Use innovativeness. The effect of personal variables on usage behavior is an area that is much investigated in previous research. Hirschman (1980) proposes inherent novelty seeking as an antecedent of usage variety, and Price and Ridgeway (1983) develop the use innovativeness scale, which taps into the concept of inherent novelty seeking. Price and Ridgeway hypothesize that for consumers to use existing products in multiple novel ways, they must have the ability (creativity) and the incentive (curiosity) to do so. Ram and Jung (1990) proceed along the same lines and further suggest that involvement and innovativeness have a positive relationship with usage variety, though the effect of involvement is lower in comparison. Consumers’ being innovative means being experimental and having an inclination to try different things. Thus, innovativeness has a direct link to variety of use. On the basis of previous theory and empirical work, we hypothesize the following: H6: Higher use innovativeness results in higher variety of use.
Frustration with technology. Complex technology often frustrates users (Mick and Fournier 1998). Similarly, Mukherjee and Hoyer (2000, p. 470) observe that the reasons for frustration include “associated learning cost and comprehension difficulty … and lack of control.” For this same reason, Lupton and Miller (1992, p. 11) argue that designers have expended significant time “domesticating and humanizing” home-based technologies. An outcome of such arguments is that though a technology may be useful, difficulties in making it perform intended tasks often cause reactions ranging from aggravation to disappointment. Frustration arises because the technology fails to perform reliably or to meet the user’s expectations. As a result, the product is used less frequently (rate of use) and is put to fewer uses than originally intended. This leads us to the following hypothesis: H7: Higher frustration with the technology leads to lower variety and rate of use.
An alternative hypothesis about the level of frustration and use of technology can also be put forward. As Davis (1989) and Mick and Fournier (1998) point out, consumers may continue to use a product despite frustration and difficulty because the product provides certain utility. Thus, if we observe a lack of effect for user frustration, it may be because concerns of utility outweigh levels of frustration.
H8: Level of frustration with technology has no impact on variety or rate of use.
External Factors Factors that are external to the adopting unit may influence usage behaviors. A supportive social environment increases use potential. If a person speaks to friends and coworkers about products, such communication reinforces user belief systems and, consequently, behaviors. Similarly, use of technologies outside of the home (e.g., office, school) also influences the use of technology at home by increasing variety, but it may result in a lower rate of variety because some of the usage time at home is taken up by use outside the home. In addition, we argue that higher exposure to media may stimulate involvement with the technology, which in turn may account for higher levels of use. Therefore, we hypothesize the following: H9: External communication intensity pertaining to the innovation leads to higher variety of use. H10: Access to the innovation outside of the home environment leads to higher variety of use but lower rate of use in the home. H11: Exposure to a more target-related media results in higher variety and rate of use.
UD Outcomes Satisfaction with technology and perceived impact of technology. It has been suggested that a person’s ability to use a product successfully results in higher satisfaction (Anderson and Ortinau 1988; Downing 1999; Kekre, Krishnan, and Srinivasan 1995). It follows that users who exhibit an intense UD pattern are more satisfied with the technology than are users who exhibit limited use. Using the expectation confirmation/disconfirmation paradigm, Bolton and Lemon (1999) find that customer satisfaction and service usage are highly correlated. Furthermore, the relation is dynamic; that is, customers tend to compare actual usage and normative expectations, and when the comparison is favorable, satisfaction increases. Similarly, in product usage, customers may have some normative expectations about product performance. When usage behavior approaches intense use, the actual usage is likely to exceed prior expectations and thus lead to higher product satisfaction. Over time, satisfaction with the technology may spur more usage (as shown by the dotted line in Figure 1) in a dynamic process. The effects of specialized and nonspecialized use on satisfaction are less clear. However, according to Oliver (1980, 1995), consumers’ satisfaction with a product is a function of the product’s ability to fulfill their expectations. As a result, we expect that the adopting unit will exhibit higher satisfaction with specialized use than with nonspecialized use. If we take intense use as the highest end of the technology-satisfaction continuum, we can argue that it is followed respectively by specialized, nonspecialized, and limited use. The degree of use also directly results in the perceived impact of the technology on daily lives. On the one hand, intense use can result in “cultural anchoring,” in which the technology becomes so inextricably part of a user’s life
that it modifies how the consumer operates on a daily basis. On the other hand, limited use will not have the same perceived impact, because it is a less integral part of the user’s activities. Specialized and nonspecialized use result in moderate perceived impact for reasons we stated previously. H12: Intense UD is associated with the highest level of (a) satisfaction with the technology, (b) perception of its essentialness in the home, and (c) impact on daily life, followed by specialized, nonspecialized, and limited use.
Interest in new (futuristic) technologies. Ellen, Bearden, and Sharma (1991) find that the level of satisfaction with an existing technology increases resistance to and reduces the likelihood of adopting an alternative. A natural extension of their finding is interest in acquiring related new technologies. Users who have successfully integrated the technology into their lives should be least resistant to acquiring similar technologies, because past successful experiences reduce the level of perceived risk involved and heighten the possible benefits that can be realized (Venkatesh, Kruse, and Shih 2003). Rogers (1995) presents a similar argument in his discussion of the adoption of technology clusters. In this regard, we expect that the highest interest in future technology acquisition is in the intense use category, followed by the nonspecialized use category. In contrast, specialized use may not result in heightened interest in future technology acquisition, because users have invested time and effort in developing expertise in applying the existing technology to repeated use or to a specialized set of tasks. H13: Intense UD results in the highest level of interest in acquiring new related technologies, followed by nonspecialized use. Specialized use and limited use have the lowest interest in acquiring new related technologies.
Research Methodology A national telephone survey of 910 U.S households that owned computers was conducted by means of the randomdigit dialing method, a well-established procedure in survey sampling. The respondent from each household was selected on the basis of who had the most information about computer use in the household. At the time of data collection (1999 and 2000), the U.S. Census Bureau (1997) estimated that computer penetration in the United States was approximately 60% of the total population, slightly skewed toward higher-income households. Therefore, to maximize the probability of representing the computer-owning households, we oversampled higher-income households. A comparison of our final sample of computer households with the Census report indicated a close match (see Table 2). Before the full-scale study was launched, the questionnaire for the study was pretested among 25 households for accuracy, validity, and ease of administration. Dependent Variable: Variety of Use and Rate of Use We determined variety of use with a checklist of possible uses of the computer (Table 3). We based the checklist items on household activities performed by household members with the help of the computer (Robinson and Godbey 1997; Venkatesh 1996). We randomized the list to eliminate any Use-Diffusion Model / 63
TABLE 2 Demographics of Survey Sample Survey Sample
U.S. Census (1997)
910
17,814
Household Income $15,000 or less 15,001–30,000 30,001–50,000 50,001–75,000 75,001 or greater
2.6% 12.1% 23.2% 22.1% 29.5%
8.1% 14.8% 26.3% 25.4% 25.4%
Racea White Black Hispanic Asian Other
88.1% 3.6% 3.0% 2.2% 1.5%
86.3% 5.3% 3.9% 3.8% .7%
Children in Household Yes No
44.1% 55.9%
47.1% 52.9%
Sample Size (Number of Households)
aRace
taken as the self-reported race of the head of the household.
TABLE 3 List of Activities Covered by Computer Use Activity Space Work/employment related
Activities 1. Job related 2. E-mail (work-related/ school-related)
Family communication
3. E-mail (personal) 4. Writing letters/ correspondence other than e-mail
Family recreation
5. Games/entertainment
Home management
6. Home management (recipes, family records) 7. Health information 8. Travel information/vacation planning 9. Financial management 10. Online banking
Home shopping
11. Shopping (frequently purchased goods) 12. Shopping (large-ticket Items) 13. Shopping (other)
Education/learning
14. School-related
Information center
15. News 16. Sports information 17. Community information
64 / Journal of Marketing, January 2004
ordering effects. In this study, we identified 17 different uses for computers (Table 3), which we grouped into seven major categories that define activity spaces in the home. In terms of UD, variety of use shows how computer use diffuses across different household activities. For each household, we summed the responses (1 = “yes,” 0 = “no”) to the 17 items (i.e., the uses); the mean uses are 8.28, and the median uses are 8. We measured rate of use as the number of hours of computer use at home by the whole family in a typical week. The primary respondent who reported for other household members gathered rate-of-use information on every computerusing member of the household. We dichotomized rate of use from the median high and low rate-of-use behavior. The median use and the mean use for each household were 14.0 and 20.26 hours per week, respectively. To avoid householdsize bias, we normalized the measure by number of users in each household, yielding 6.63 hours for the median and 8.81 hours for the mean. We divided the normalized rate of use by the median into high and low rate of use. Together, variety of use and rate of use formed the 2 × 2 matrix (see Figure 1) of UD patterns. Table 4 gives the percentage of each use pattern in our sample. Determinants Respondents were asked the frequency of computer-related communication with other users in the home, and we constructed a measure as follows: HCI h =
(1)
∑κ
ij
+ λ ij
Hh
,
where HCIh = household communication intensity, λij = frequency of communication between users i and j (2 = “frequently,” 1 = “sometimes”), κij = knowledge of the users i and j (2 = “at least one is an expert,” 1 = “none are experts”), and Hh = number of users in the household. This index makes an upward adjustment when communication about computers between two users is more frequent and when at least one of the users is more knowledgeable about computers. We made these adjustments because we suspect that more frequent communications, particularly among or with expert users in the home, can contribute more to solving usage difficulties.3 To avoid biases toward larger household sizes, we normalized household communication intensity by the number of computer users in the household. We operationalized competition for computers (USERSPC) as the ratio of the number of computers available at home to the number of users. We operationalized experience with computers (YEARSPC) by considering how long (in years) the households had used computers at
3If no communication exists between users i and j, then κ + λ ij ij is set equal to zero.
home. We operationalized technological sophistication of computers (PCAGE) as the age of the newest computer in the home. We reverse-coded the variable so that a newer computer would have higher value (i.e., more sophisticated) than an older computer. Although this operationalization ignores variations of different computer configurations, it is still a fair measure of computing capabilities because, in general, computers purchased in a particular year have more memory (RAM) and faster CPU speed than computers purchased in a previous year. We operationalized complementary technologies (TECHOWN) as the number of complementary information and media technologies other than computers that were used in the household (for a list of technologies, see the Appendix). We measured use innovativeness (INNOVATE) by modifying the scale developed by Price and Ridgeway (1983). We selected the items from each of the four factors reported TABLE 4 Use-Diffusion Patterns UD Intense use Specialized use Nonspecialized use Limited use
Variety of Use
Rate of Use
Percentage of Sample
High
High
29.9
Low
High
20.4
High Low
Low Low
19.4 30.2
and reworded them to fit the context of the study. We randomized the items and measured them on a five-point scale (1 = “not at all,” 5 = “very much”) of how well the statements describe the respondents themselves (see the Appendix). Reliability analysis indicated that the five items have a Cronbach’s alpha of .81, and we took the average of the items as an overall measure of use innovativeness. We measured frustration with technology (FRUST) with a two-item scale in the context of home use (“Computers are difficult to use” and “Often feel frustrated using a computer”); the two items had a Cronbach’s alpha of .70. External communication intensity (ECI) measures the extent to which members of the household communicate with friends, coworkers, or a company help desk for assistance with computer usage. For each of these, we assigned a score of 2 = “frequently,” 1 = “sometimes,” and 0 = “never,” and we summed the scores to form an index. Use of the computer and the Internet outside of the home (OUTACC) is a dummy variable that is equal to 1 if the answer is yes and equal to 0 otherwise. We operationalized media exposure of the household (HHMEDIA) as the proportion of users in the household who are exposed to computer-related magazines. Finally, we included three demographic variables in our analysis: highest education in the household, household income, and age (oldest user in the household). These variables have been discussed in prior research (Dutton, Kovaric, and Steinfield1985; Venkatesh 1996). We included them as control variables to test whether our main hypotheses would hold in the presence of demographic influences. Summaries of independent variables are reported in Table 5.
TABLE 5 Summary of Determinants Variable Name HCI USERSPC YEARSPC PCAGE TECHOWN INNOVATE FRUST ECI
OUTACC HHMEDIA HHEDU INCOME AGE
Variable Description Household communication intensity Competition for technology Experience with technology Sophistication of technology Complementary technology ownership Use innovativeness Frustration with use of technology External communication intensity
Access to technology outside of home Household media exposure Highest education level in the home Household income Age of the oldest user in the household
Measure
Mean
Standard Deviation
(Σλij)/(number of users)
2.843
1.049
(Number of personal computers in use)/(number of users) Years since adoption Age of newest personal computer (reversed) Number of complementary technologies owned
2.049
1.186
6.953 12.096 6.263
5.374 1.768 1.974
3.162 2.391 3.171
1.053 .961 1.394
.654
.476
.236
.344
6.582
2.038
3.882 41.770
1.287 13.688
Five-item scale, α = .81 Two-item scale, α = .70 Sum of degree of communication with friends, coworkers, and other sources (e.g., help lines, online chat groups) for advice about computer use (2 = “frequently,” 1 = “sometimes,” and 0 = “never”) Dummy variable: 1 = if anyone in household has access, 0 = otherwise (Number of users who read computer magazine)/(number of users) Years of education for the most educated member of the household (ten-point scale) Household income (six-point scale) Age of the user
Use-Diffusion Model / 65
Outcome Variables
2SLS Regression Analysis
We determined perceived impact of computers by a randomized ten-item scale (1 = “strongly disagree,” 5 = “strongly agree”) that was meant to tap into effects of using computers on household activities (see the Appendix). A factor analysis with varimax rotation resulted in two underlying factors that explain 52.38% of the total variance. The first factor (eigenvalue = 4.13, Cronbach’s α = .79) is essentialness of the computer at home, and the second factor (eigenvalue = 1.11, Cronbach’s α = .66) is the impact of the computer on daily life. We averaged the items for each factor. We measured satisfaction by using a scale with two items (“experience with computers in general” and “computer’s overall performance”; 1 = “not at all satisfied,” 5 = “very satisfied”). We averaged the two items for overall satisfaction (Cronbach’s α = .75). We assessed interest in future technologies by asking respondents what their level of interest (1 = “not at all,” 4 = “very”) was in technologies that were under development (but not in the market at the time of the study). These technologies are sometimes referred to as “smart-home technologies,” and we selected them on the basis of ongoing industry research and development of the next wave of technologies for the home.
Results for the 2SLS are shown in Table 6. In general, the determinant variables performed better in explaining variety of use (R2 = .326), and seven hypothesized relationships tested significant. In addition, we found one demographic variable to be significant. For rate of use, we found five hypothesized relationships to be significant (R2 = .212) and none to be significant in the demographic category. On the basis of the regression analysis, we were able to find empirical support for H1–H6. As for the competing hypotheses, H7 and H8, our empirical result is consistent with H8 but not H7. H9–H11 were also supported. Because our independent variables use different scales, we subsequently present the standardized coefficients for ease of comparison. In terms of relative magnitude of the explanatory variables, the top three variables for variety of use were use innovativeness, sophistication of technology, and complementary technology. For rate of use, the top three variables were competition for technology, household media exposure, and sophistication of technology. However, without further theoretical justification, at this time we do not attach any significant interpretation to the relative rankings of these determinants. The effect of social dimension on UD received good empirical support. Intensity of household communication was positively related to variety of use (β = .166, p < .001), which confirms that household members, particularly those who have more computer expertise, assist other household members in using technologies for novel consumption situations. The observed interaction among users appears to have introduced and reinforced higher usage behavior as well as new usage behavior, thereby broadening the potential applicability of the technology and diffusion in the home. The effect of competition among users for computing resources in the home is negatively related to rate of use, as we hypothesized (β = –.224, p < .001). Experience with computers had a significant effect on variety and rate of use, as we hypothesized (β = .165, .098, p < .01). The two variables within the technological factor significantly affect UD. Sophistication of the computer system is positively related to variety of use and rate of use (β = .207, .099, p < .001), in confirmation of our hypothesis. Complementary technology ownership affected variety of use (β = .172, p < .001). For the personal dimension, use innovativeness is positively related to variety of use (β = .212, p < .001), which is in agreement with the results that Ridgeway and Price (1994) and Ram and Jung (1990) report. The null effect of frustration with using the computer indicates that adopters are not deterred in their use of the technology despite frustration and difficulties in using it, consistent with H8. For external dimension, external communication index was positively related to variety of use (β = .123, p < .001), and using the computer outside the household had no impact on variety of use but was negatively related to rate of use (β = –.071, p < .05). This indicates a substitution effect. Similarly, media exposure was significant in predicting variety of use and rate of use (β = .132, .107, p < .01). As for the sociodemographic variables we tested, the principal effect we found was for highest education in the
Analyses and Results We believe that variety and rate of use are simultaneously determined. A reason for this is that variety and rate of use can be empirically correlated, such that increases in variety of use often result in increases in rate of use because more time may be needed to perform more uses. All else being equal, less variety of use can lead to lower rate of use because users simply have less to do. In addition, we believe that variety and rate of use depend on the exogenous variables described in the preceding hypotheses. Thus, we specified a two-equation model of variety and rate of use and estimated it with two-stage least squares (2SLS). Although we do not present a complete model of the consequences of variety and rate of use, we investigated the influences of the four diffusion patterns on perceived impact of technology, satisfaction with technology, and interest in future technologies by using a multinomial logit model (MNL). We used the MNL model because of our interest in analyzing the likelihood of the adopting unit experiencing one of the four different nominal, discrete UD patterns and in identifying the variables that are likely to produce this result. In the MNL model, it is customary to use a reference category among the categories that constitute the dependent variable. Limited use is a logical choice for a reference category because it represents the lack of unit UD, whereas intense, specialized, and nonspecialized uses capture UD through rate of use, variety of use, or both. Consequently, we interpreted the coefficients relative to limited use. To test for the UD outcomes, as reflected in H12 and H13, we used a one-way analysis of variance with least significant multiple comparison t-test to test the differences among the four UD categories on the following variables: satisfaction with the computer, perceived impact of the computer on home life, and interest in acquiring future technologies. 66 / Journal of Marketing, January 2004
household, which was positively related to variety of use. Although we did not make explicit hypotheses about these variables, but used them only as control variables, the results are not substantial. MNL Analysis We performed an MNL analysis on the four UD patterns: intense, specialized, nonspecialized, and limited use. Limited use was the control category. Results of the MNL analysis are reported in Table 7. The model –2 log-likelihood is 2008.612 with χ2 = 404.544 (p < .001). Except for frustration, all independent variables were significant in predicting UD patterns. Among the household social dimensionality variables, household communication intensity was significantly related to intense use (β = .201, p < .01) and nonspecialized use (β = .487, p < .01). In contrast, competition for computing resources reduces the likelihood of UD, particularly intense and specialized use (β = –.242, –.462, p < .05), and this confirms the notion that when people compete for limited resources, the synergy of collective usage is affected. Years of experience was significant in predicting intense use (β = .092, p < .001), specialized use (β = .051, p < .05), and nonspecialized use (β = .053, p < .05). This finding suggests that users who interact frequently with other household users tend to develop broader variety of use than do users with limited usage behavior. For technological dimension, the sophistication of the computer increases the probability of intense, specialized, and nonspecialized uses but not limited use. It seems essen-
tial to update technology before it fails to keep up with usage requirements. In contrast, the complementary nature of household technologies is significant in relation to intense use (β = .178, p < .01) but not other uses. It stands to reason that use of related technologies is correlated with variety of uses. By the same token, because we did not observe the impact of extended computer use for a single purpose on specialized use, it is reasonable to suggest that it does not translate into a need for related technologies. For personal dimension, use innovativeness was significant in predicting intense use (β = .710 p < .001) and nonspecialized use (β = .348, p < .01). The findings and interpretation here are similar to those of the regression analysis and consistent with those of Ridgeway and Price (1984). Although we found none of the coefficients associated with frustration to be significant, all were negative as might be expected. External communication index had a positive effect on intense and nonspecialized use (β = .195, .324, p < .05), and outside access had a negative impact on specialized use (β = –.524, p < .05). In effect, communication with people outside of the household has a similar effect as communication with household users, and access to computers outside of the home reduces some of the time spent on computers at home. Media exposure was positively related to intense, specialized, and nonspecialized uses (β = 1.704, 1.098, .826, p < .05). Finally, the only sociodemographic (control) variables we found to have any impact were the effect of education on specialized use (positive) and the effect of income on nonspecialized use (positive). Absent any theory, it is rather difficult to interpret these two results meaningfully.
TABLE 6 2SLS Analysis of Use-Diffusion Variety of Use
Rate of Use
Coefficients
β
Standard Error
Coefficients
β
Standard Error
α HCI USERSPC YEARSPC PCAGE TECHOWN INNOVATE FRUST ECI OUTACC HHMEDIA HHEDU INCOME AGE VARIETY RATE
5.254*** .373*** — .113*** .444*** .322*** .745*** –.158*** .330*** .185*** 1.428*** .167*** .200*** .008*** — –.103***
— .166 — .165 .207 .172 .212 –.041 .123 .024 .132 .092 .070 .030 — –.110
1.257 .067 — .028 .089 .066 .143 .114 .088 .256 .436 .056 .107 .010 — .087
00.948*** — –1.507*** 00.146*** 00.457*** — — 0–.016*** — –1.185*** 02.490*** 00.281*** 0–.419*** 00.045*** 00.927*** —
— — –.224 .098 .099 — — –.002 — –.071 .107 .065 –.018 .066 .244 —
2.439 — .232 .060 .175 — — .267 — .590 .82 .166 .237 .025 .219 —
R2 Adjusted R2 F
.326*** .317*** 34.860***
00.212*** 00.203*** 23.146***
*p < .05. **p < .01. ***p < .001.
Use-Diffusion Model / 67
followed by specialized, nonspecialized, and limited (2.84 versus 2.65 versus 2.09). Similar patterns of ranking hold for overall satisfaction with the computer at home (4.22 versus 3.95 versus 4.06 versus 3.70, p < .05, except between specialized and nonspecialized use). In general, we found that the more extensive the UD of technology in the home, the more impact it has on daily life, the more it is perceived as essential, and the more satisfied adopters are. We also hypothesized that UD patterns are related to adopters’ interest in acquiring new technologies. In particular, we expect that adopters who exhibit higher UD are more interested in futuristic technologies than are adopters with a lower level of UD. In general, this hypothesis was supported. In every case, intense UD pattern ranks the highest with regard to interest in acquiring futuristic technologies,
UD Outcomes: Multiple Comparison Test We found significant differences among diffusion categories on all the outcome variables we examined. The means of each outcome variables investigated are reported in Table 8. Consistent with the predictions, users who experienced an intense UD pattern rated the computer highest with regard to its essentialness in the home, and users who experienced a limited UD pattern rated it lowest (3.65 versus 2.35, p < .05). The remaining two groups, in the categories of specialized and nonspecialized use, were not significantly different from each other (3.01 versus 2.99, p > .10), but both were significantly lower than intense users and significantly higher than limited users. For impact on daily life, all comparisons were significant; intense use was the highest (3.37),
TABLE 7 MNL Analysis of Use-Diffusion Intense α HCI USERSPC YEARSPC PCAGE TECHOWN INNOVATE FRUST ECI OUTACC HHMEDIA HHEDU INCOME AGE
–10.037*** .201** –.242* .092*** .408*** .178** .710*** –.081 .195* –.160 1.704*** .109 .028 –.077
–2 LL Model χ2 Pearson χ2 Pseudo-R2
2008.612 404.544*** 2633.947 .367
Standard Error
Specialized
Standard Error
Nonspecialized
Standard Error
1.207 .074 .113 .023 .069 .060 .116 .113 .080 .235 .344 .057 .092 .255
–3.076** .106 –.462*** .051* .263*** –.013 .204 –.115 –.062 –.524* 1.098** –.123* .006 .333
1.105 .216 .127 .024 .064 .061 .118 .112 .082 .230 .347 .057 .091 .009
–8.089*** .487* .093 .053* .219** .060 .348** –.074 .324*** .186 .826* .062 .303** .335
1.177 .221 .105 .024 .064 .063 .118 .117 .082 .251 .396 .058 .097 .264
*p < .05. **p < .01. ***p < .001.
TABLE 8 Analysis of Outcome of Use-Diffusion
Essentialness Impact on daily life Satisfaction with personal computer Interest in Future Technologies Overall Shopping Home communication Home entertainment Security/home management Home local area network
F
Intense
Specialized
Nonspecialized
Limited
85.35*** 112.51*** 14.08***
3.65c 3.37d 4.22c
3.01b 2.84c 3.95b
2.99b 2.65b 4.06b
2.35a 2.09a 3.70a
22.59*** 4.69** 9.38*** 15.09*** 10.52*** 18.01***
2.58c 1.81b 2.95b 2.67c 2.97b 2.49c
2.45b 1.84b 2.90b 2.47b 2.90b 2.14b
2.12a 1.58a 2.42a 2.18a 2.49a 1.97b
2.13a 1.60a 2.44a 2.23a 2.55a 1.81a
a b c dRow comparison is significantly different at p < .05. *p < .05. **p < .01. ***p < .001.
68 / Journal of Marketing, January 2004
but this interest is weakest in limited UD. For specialized UD, interest in these technologies is the second highest in all cases, and nonspecialized use is not significantly different from limited use. When viewed as a whole, the data suggest that different UD patterns result in differential levels of interest in future technology acquisition and that UD patterns that are higher on variety of use (intense) exhibit a higher level of interest than the others.
Discussion We began by stating that the existing AD paradigm has some gaps. Prior research in marketing supports our position and provides some extensions to the diffusion framework (Hahn et al. 1994; Ram and Jung 1990; Ridgeway and Price 1994; von Hippel 1986). Our main contribution to previous research is the identification of a fourfold typology of users (intense, specialized, nonspecialized, and limited) based on two distinct elements: variety of use (high and low) and rate of use (high and low). Between the two elements, variety of use assumes a slightly more central position because it is one of the key elements of use innovativeness (Ridgeway and Price 1994). It also plays a significant role in identifying intense users. Many new technologies are capable of performing multiple functions and are therefore candidates for variety of use. However, producer-initiated multifunctionality is a necessary condition, but it is the consumer’s actual variety of use that matters in the final analysis. We find that variety of use is not only an intuitive concept but a theoretically rich construct for application in new product development and design. The results also support our typology, which indicates that intense and limited users are at the two extremes and specialized and nonspecialized users are in the middle on many independent measures (Table 8). These categories are roughly analogous to the adopter categories that have been proposed in the diffusion literature. The different users have some distinct characteristics that can be further explored from a marketing standpoint to develop a segmentation strategy and to position new products. Although our empirical investigation is focused on personal computers, the conceptual model can easily be adopted to a wide range of innovations that have multiuse potential. Use/User Typology and Market Segmentation Because product-use patterns determine the formation of segments, the fourfold typology of users we have developed is a constructive way to visualize the market. In terms of the proposed segments, intense users seem to dominate other users, given the number of variables we found to be significant (Table 7). This shows that a critical factor in UD is how involved consumers are in the use of the product in terms of both variety of use and rate of use. In the UD context, intense users may be considered use innovators par excellence because they score high on both variety and rate. We also propose that the other two key segments worthy of market attention are nonspecialized users and specialized users, because they can be considered potential intense users. Limited users may appear less appealing because their product use is not significant; however, they are good candi-
dates for upgrading to a higher level of use if the reasons for their limited use are known in advance. From our study, we were able to show that intense users constitute 30% of the sample, followed by nonspecialized users (20%) and specialized users (19%). Together, these segments constitute approximately 70% of the user population and thus represent a substantial portion of consumers who might be of interest to marketers of key technologies. Although we do not claim that our figures constitute a population estimate, given that our sample is a national one, we believe that the values are plausible. In terms of Hahn and colleagues’ (1994) study, we classify these three segments collectively as “repeaters” in the sense that they have used the product and are ready for repurchase because of their use experience and satisfaction. In addition, intense users represent the highest level in terms of use innovativeness. In many respects, they can be likened to the lead users that von Hippel (1986) identifies in his work on industrial diffusion. We found that use of related technologies is positively related to higher UD levels and therefore leads to higher satisfaction with the technology itself. However, to determine how technology functions can be optimally integrated, we believe the marketer must first understand the nature of use of the technology and its UD path. We also found that adopters with higher UD levels not only are more satisfied with the current innovation but also are more interested in adopting future innovations. In general, we did not find major demographic differences between the groups, though income and education seem to have a marginal impact. A reason for this may be that whereas income and education may differentiate adopters and nonadopters, they may have less significance in determining actual use patterns. Key Variables and Their Implications For the independent variables, the results show (Table 6) that the four dimensions of the UD model (household social, technology, personal, and external factors) explain a large measure of the variance. Among the three major use categories, intense use is the most highly correlated with the variables in the model, followed by nonspecialized use and somewhat distantly by specialized use (Table 7). A possible conclusion is that nonspecialized users can be considered potential intense users, whereas specialized users are less likely to become intense users because they appear to be set in their ways. However, specialized users may be concerned about improvements in existing products that guarantee better performance in their specialized product-use category. In terms of the specific variables, the role of experience is critical in UD because experience leads to cumulative knowledge and learning (Hoch and Deighton 1989). Hoch and Deighton (1989) show that motivated learners exhibit more versatile new product behaviors than do unmotivated learners. We believe that intense users and nonspecialized users are more similar to motivated learners and more likely to take advantage of experiential learning. Competition for resources reduces access potential, which in turn negatively affects a person’s ability to use the technology. Thus, access and use are related. The greater the access, the greater are the opportunities for use (Hoffman, Use-Diffusion Model / 69
Novak, and Venkatesh 1998). If several users need to share the technology, each is limited in his or her use. A solution is to increase the number of units in the home; another solution is to schedule technology use in a way that maximizes opportunities for everyone. The current examples include television sets, telephones, and automobiles. Our results also show that the social contexts of communication and interactions (internal and external) are central to the UD process, as they are to the AD process. Communication among users increases UD, especially with respect to variety of use. Our research examines not only the presence or absence of communication but also the intensity of it, including media exposure, which plays an influential role among different sets of users. Because communication with other users can play a significant role in UD, establishing user groups, either virtual or physical, may encourage users to educate and support one another openly in the UD process. We also found that, in general, exposure to an external source of information, such as other users, fosters a higher level of UD. Additional emphasis should be placed on targeting existing adopters and educating them about potential applications of technology that may not be readily apparent. In terms of technology variables, the presence of complementary technologies increases variety of use, as does ownership of the latest technology, which provides further support to the notion of technology clusters in new product development. However, acceptance of new technologies is not automatic; they must be marketed strategically with different appeals to different segments. For the other key variables, use innovativeness emerges as a key factor. Our results show that use innovativeness affects variety of use, but not rate of use, in a significant way. A question not examined in our study is whether adoption innovativeness and use innovativeness are the same. We know from other studies that children display higher levels of use innovativeness than do adults, though children are not mentioned in the context of adoption. Although we did not specifically investigate this in our study, we use it to illustrate the point made here. That users are frustrated with technology because of its complexity does not seem to have much bearing, presumably because this problem is neutralized by other factors (e.g., perceived benefits of technology). At this point, we speculate on the relationship between two key types of use: intense use and nonspecialized use. Although both types of use are distinct, they are related; that is, nonspecialized use may eventually lead to intense use because the key aspect of nonspecialized use is to explore various technological possibilities. In terms of diffusion outcomes (Table 8), consumers in the intense-use category show greater satisfaction, believe there is a greater impact of technology on family life, and are more likely to regard computers as an essential technology than are other groups. To conclude, when a new product that is capable of fulfilling multiple tasks is introduced into the market, conditions must be created that enable higher variety of use and higher rate of use. For example, the goal of marketing communications can be extended beyond traditional promo-
70 / Journal of Marketing, January 2004
tional strategies that focus on product adoption to include creative uses of the product as well. Our research suggests that to encourage such usage behavior, it is important to disseminate use knowledge and to nurture use-based learning. In practical terms, marketers of these technological products must be creative in presenting new usage scenarios to the adopters and in fostering direct communications among adopters. This suggests that some formal mechanisms should be established for gathering use data on a regular basis. Conclusions and Directions for Further Research Our study uses a national probability sample of households, and therefore the results can be considered reasonably robust. However, the study has some limitations that can be addressed in future studies. First, the study is not longitudinal and therefore does not capture the full dynamism of UD. Thus, our empirical findings are correlational rather than causal. Further research should adopt a longitudinal approach to gain full causal insights. Second, our empirical focus is on a single product. Studies that involve multiple products would yield some richer insights on how UD varies across different product categories. For example, the complexity of a product category with respect to UD can be tested across different segments. The impact of different levels of multifunctionality on UD can also be tested. We urge researchers to address these issues.
Appendix Details of Items Employed in the Study Technologies in the Home •Electronic organizer or handheld computer •Fax or telex machine •Pager •Voice mail or answering machine •Video-game console •Digital videodisc, DivX, or laser disc player •Stereo system or compact disc player •Satellite television •Cable television •Video camera •VCR •Digital camera
Use Innovativeness Scale (Adopted from Price and Ridgeway [1983]) •I am creative with computers. •I am very curious about how computers work. •I am comfortable working on computer projects that are different from what I am used to. •I often try to do projects on my computer without exact directions. •I use a computer in more ways than most people do.
Perceived Impact of Computer (Two Factors) 1. Factor 1: Essentialness of Computer at Home •The computer is as essential in my home as is any other household appliance. •It would be difficult to imagine life without a computer in my home. •Households with a computer are run more efficiently than those without a computer. •The computer has saved me time at home. •The computer has become part of the daily routine in my home. 2. Factor 2: Impact of Computer on Daily Life •The computer has changed the way I do things at home. •The computer has replaced the telephone as the major communication device in my home. •I have more contact with friends as relatives now that I have e-mail. •My family watches less television as a result of using the computer or the Internet. •The computer has increased the amount of job-related work I do at home.
Interest in Future-Oriented Technologies Cost aside, how interested would you be in having this for your home. Would you be “not at all interested,” “slightly interested,” “somewhat interested,” or “very interested” in having this product, or do you already have something like this in your home? (List read in random order) •A refrigerator with a computer screen on the door that would allow you to keep track of food inventories and would be linked to the Internet so you could order food and other supplies online. •An audiovideo system linked to units in each room that would allow you to share home theater events, share VCR programs, and share stereo sound to each room. •A communication system that combines your telephone, computer, Internet access, and television in one single unit. •A home computer control system that manages lighting, temperature, home security, and appliances in any and all rooms of your home. •A local area network for the home that connects multiple computers, printers, and data sources so that you can share information between computers or send information to any printer in your home.
REFERENCES Alba, Joseph and J. Wesley Hutchinson (1985), “Dimensions of Consumer Expertise,” Journal of Consumer Research, 13 (March), 411–54. Anderson, Robert L. and David J. Ortinau (1988), “Exploring Consumers’ Postadoption Attitudes and Use Behaviors in Monitoring the Diffusion of a Technological-Based Discontinuous Innovation,” Journal of Business Research, 17 (3), 283–98. Blonski, Matthias (1999), “Social Learning with Case-Based Decisions,” Journal of Economic Behavior and Organizations, 38 (1), 59–78. Bolton, Ruth N. and Katherine N. Lemon (1999), “A Dynamic Model of Customers’ Usage of Services: Usage as an Antecedent and Consequence of Satisfaction,” Journal of Marketing Research, 36 (May), 171–86. Daly, Kerry J. (2001), “Deconstructing Family Time: From Ideology to Lived Experience,” Journal of Marriage and Family, 63 (2), 283–94. Davis, Fred D. (1989), “Perceived Usefulness, Perceived Ease of Use, and User Acceptance of Information Technology,” MIS Quarterly, 13 (September), 319–39. Dickerson, Mary Dee and James W. Gentry (1983), “Characters of Adopters and Non-Adopters of Home Computers,” Journal of Consumer Research, 10 (September), 225–35. Dodson, Joe A., Jr., and Eitan Muller (1978), “Models of New Product Diffusion Through Advertising and Word-of-Mouth,” Management Science, 24 (November), 568–78. Downing, Charles E. (1999), “System Usage Behavior as a Proxy for User Satisfaction: An Empirical Investigation,” Information and Management, 35 (4), 203–216. Dutton, William, Peter Kovaric, and Charles Steinfield (1985), “Computing in the Home: A Research Paradigm,” Computers and the Social Sciences, 1 (1), 5–18. Ellen, Pam Scholder, William O. Bearden, and Subhash Sharma (1991), “Resistance to Technological Innovation: An Examination of the Role of Self-Efficacy and Performance Satisfaction,” Journal of the Academy of Marketing Science, 19 (4), 297–307.
Fisher, Robert J. and Linda L. Price (1992), “An Investigation into the Social Context of Early Adoption Behavior,” Journal of Consumer Research, 19 (December), 477–85. Golder, Peter N. and Gerard J. Tellis (1998), “Beyond Diffusion: An Affordability Model of the Growth of New Consumer Durables,” Journal of Forecasting, 17 (3–4), 259–80. Hahn, Minhi, Sehoon Park, Lakshman Krishnamurthi, and Andris A. Zoltners (1994), “Analysis of New Product Diffusion Using a Four-Segment Trial-Repeat Model,” Marketing Science, 13 (3), 224–47. Hirschman, Elizabeth C. (1980), “Innovativeness, Novelty Seeking, and Consumer Creativity,” Journal of Consumer Research, 7 (3), 283–95. Hoch, Stephen J. and Joh Deighton (1989), “Managing What Consumers Learn from Experience,” Journal of Marketing, 53 (April), 1–20. Hoffman, Donna L., Thomas P. Novak, and Alladi Venkatesh (1998), “Diversity on the Internet: The Relationship of Race to Access and Usage,” in Investing in Diversity: Advancing Opportunities for Minorities and the Media, Amy K. Garmer, ed. Washington, DC: The Aspen Institute, 125–92. Kekre, Sunder, Mayuram S. Krishnan, and Kannan Srinivasan (1995), “Drivers of Customer Satisfaction for Software Products: Implications for Design and Service Support,” Management Science, 41 (9), 1456–70. Kiesler, Sara, Robert Kraut, Vicki Lundmark, William Scherlis, and Tridas Mukhopadhyay (1997), “Usability, Help Desk Calls, and Residential Internet Usage,” Conference Proceedings on Human Factors in Computing Systems, Steven Pemberton, ed. New York: ACM Press, 536–37. ———, Bozena Zdaniuk, Vicki Lundmark, and Robert Kraut (2001), “Troubles with the Internet: The Dynamics of Help at Home,” Journal of Human–Computer Interaction, 15, 323–51. Kraut, Robert, Ronald E. Rice, Colleen Cool, and Robert S. Fish (1998), “Varieties of Social Influences: The Role of Utility and Norms in the Success of a New Communication Medium,” Organization Science, 9 (4), 437–53.
Use-Diffusion Model / 71
Lee, Wai On (2000), “Introducing Internet Terminals to the Home: Interaction Between Social, Physical, and Technological Spaces,” in People and Computers XIV—Usability Or Else! S. McDonald, Y. Waern, and G. Cockton, eds. New York: Springer, 14–29. Lewis, Laurie K. and David R. Seibold (1993), “Innovation Modification During Intraorganizational Adoption,” Academy of Management Review, 18 (2), 322–54. Lindolf, Thomas R. (1992), “Computing Tales: Parents’ Discourse About Technology and Family,” Social Science Computer Review, 10 (3), 291–309. Lupton, Ellen and J. Abbott Miller (1992), The Bathroom, the Kitchen, and the Aesthetics of Waste. Cambridge: Massachusetts Institute of Technology Visual Arts Center, distributed by Princeton Architectural Press. Mahajan, Vijay and Eitan Muller (1979), “Innovation and Diffusion and New Product Growth Models in Marketing,” Journal of Marketing, 43 (Fall), 53–68. ———, ———, and Frank M. Bass (1990), “New Product Diffusion Models in Marketing: A Review and Direction for Research,” Journal of Marketing, 54 (January), 1–26. Mick, David and Susan Fournier (1998), “Paradoxes of Technology: Consumer Cognizance, Emotions, and Coping Strategies,” Journal of Consumer Research, 25 (2), 123–43. Midgley, David F. and Grahame R. Dowling (1978), “Innovativeness: The Concept and Its Measurement,” Journal of Consumer Research, 4 (March), 229–42. Mukherjee, Ashesh and Wayne D. Hoyer (2001), “The Effect of Novel Attributes on Product Evaluation,” Journal of Consumer Research, 28 (December), 462–72. Norman, Donald A. (1999), The Invisible Computer. Cambridge: Massachusetts Institute of Technology Press. Oliver, Richard L. (1980), “A Cognitive Model of the Antecedents and Consequences of Satisfaction Decisions,” Journal of Marketing Research, 17 (November), 460–69. ——— (1995), “Attribute Need Fulfillment in Product Usage Satisfaction,” Psychology and Marketing, 12 (1), 1–17. Price, Linda L. and Nancy M. Ridgeway (1983), “Development of a Scale to Measure Use Innovativeness,” in Advances in Consumer Research, Vol. 10, Richard P. Bagozzi and Alice Tybout, eds. Ann Arbor, MI: Association for Consumer Research, 679–84. Ram, S. and Hyung-Shik Jung (1990), “The Conceptualization and Measurement of Product Usage,” Journal of the Academy of Marketing Science, 18 (1), 67–76.
72 / Journal of Marketing, January 2004
Reingen, Peter H. and Jerome B. Kernan (1986), “Analysis of Referral Networks in Marketing: Methods and Illustration,” Journal of Marketing Research, 23 (November), 370–78. Ridgeway, Nancy M. and Linda L. Price (1994), “Exploration in Product Usage: A Model of Use Innovativeness,” Psychology and Marketing, 11 (1), 69–84. Robertson, Thomas S. and Hubert Gatignon (1986), “Competitive Effects on Technology Diffusion,” Journal of Marketing, 50 (July), 1–12. Robinson, John P. and Geoffrey Godbey (1997), Time for Life. University Park: Pennsylvania State University Press. Rogers, Everett M. (1995), Diffusion of Innovations, 4th ed. New York: The Free Press. Salazar, Christine (2000), “Building Boundaries and Negotiating Work at Home,” working paper, Department of Computing and Software Systems, University of Washington. Tinnell, Carolyn S. (1985), “An Ethnographic Look at Personal Computers in the Family Setting,” Marriage & Family Review, 8 (1–2), 59–69. U.S. Bureau of the Census (1997), Current Population Survey, October 1997. Washington, DC: U.S. Bureau of the Census. Valente, Thomas W. (1995), Network Models of the Diffusion of Innovations. Cresskill, NJ: Hampton Press. Venkatesh, Alladi (1996), “Computers and Other Interactive Technologies for the Home,” Communications of the ACM, 39 (12), 47–54. ———, Erik Kruse, and Chuan-Fong Shih (2003), “The Networked Home: An Analysis of Current Developments and Future Trends,” Cognition, Technology, and Work, 5 (April), 23–32. Vitalari, Nicholas P., Alladi Venkatesh, and Kjell Gronhaug (1985), “Computing in the Home: Shifts in the Time Allocation Patterns of the Households,” Communications of the ACM, 28 (5), 512–22. von Hippel, Eric (1986), “Lead Users: A Source of Novel Product Concepts,” Management Science, 32 (7), 791–805. ——— (1995), The Sources of Innovation. New York: Oxford University Press. Wasserman, Stanley and Katherine Faust (1994), Social Network Analysis. Cambridge, UK: Cambridge University Press.