The Journal of Systems and Software 79 (2006) 1233–1248 www.elsevier.com/locate/jss
Beyond source code: The importance of other artifacts in software development (a case study) Gregorio Robles a
a,*
, Jesus M. Gonzalez-Barahona a, Juan Julian Merelo
b
Grupo de Sistemas y Comunicacciones, Departamento de Ingenieria Telematica y Tecnologia Electronica, Universidad Rey Juan Carlos, Tulipan s/n, 28933 Mostoles, Madrid, Spain b Grupo Geneura, Universidad de Granada, Campus Aynadamar, Daniel Saucedo Aranda s/n, 18071 Granada, Spain Received 24 February 2006; accepted 25 February 2006 Available online 21 April 2006
Abstract Current software systems contain increasingly more elements that have not usually been considered in software engineering research and studies. Source artifacts, understood as the source components needed to obtain a binary, ready to use version of a program, comprise in many systems more than just the elements written in a programming language (source code). Especially when we move apart from systems-programming and enter the realm of end-user applications, we find files for documentation, interface specifications, internationalization and localization modules and multimedia data. All of them are source artifacts in the sense that developers work directly with them, and that applications are built automatically using them as input. This paper discusses the differences and relationships between source code (usually written in a programming language) and these other files, by analyzing the KDE software versioning repository (with about 6,800,000 commits and 450,000 files). A comprehensive study of those files, and their evolution in time, is performed, looking for patterns and trying to infer from them the related behaviors of developers with different profiles, from where we conclude that studying those ‘other’ source artifacts can provide a great deal of insight on a software system. Ó 2006 Elsevier Inc. All rights reserved. Keywords: Mining software repositories; Source code analysis; Source code management systems
1. Introduction Software systems have evolved during the last decades from command-line programs to huge end-user applications full of graphics and multimedia elements. Besides, a piece of software has nowadays to be adapted to different cultural environments (language and notational conventions) if it aims to become mainstream. All this has caused that software development is an endeavor that is no longer carried out only by software developers. In many cases it has become an activity that requires the coordinated work of several groups, with different backgrounds and that perform different tasks such as internationalization and local-
ization (from now on i18n, short for internationalization and l10n, short for localization1), graphic design, user interface design, writing of technical and end-user documentation and creation of multimedia elements. During the software construction process these diverse elements are handled together, conforming an integral body that has to be developed, managed and maintained. Despite this new environment, ‘classical’ source code analysis is still focused on the output of the work performed by software developers: source code written in a programming language. The rest of the elements mentioned above are
1
*
Corresponding author. Tel.: +34 91 488 81 06; fax: +34 91 664 74 94. E-mail address:
[email protected] (G. Robles). URL: http://gsyc.escet.urjc.es/~grex (G. Robles).
0164-1212/$ - see front matter Ó 2006 Elsevier Inc. All rights reserved. doi:10.1016/j.jss.2006.02.048
Internationalization is the process of designing applications so that they can be adapted to various languages and regions without engineering changes. Localization is the process of adapting software for a specific region or language by adding locale-specific components and translating text.
1234
G. Robles et al. / The Journal of Systems and Software 79 (2006) 1233–1248
usually not considered, even though they are in many cases a fundamental and non-trivial part of the application. In this paper, our intention is to provide some insight into all those elements that conform a modern end-user software system. We propose a methodology for such a study, and offer a software tool that implements it in an almost-automatic way. Our assumption is that many traditional concepts from software engineering may be generalized for other artifacts. For instance, in the same sense in which source code suffers from software aging (Parnas, 1994), all these artifacts have to be updated and handled conveniently to avoid similar effects. To accomplish this goal, we identify the several kinds of files found in a versioning system, mining in its historical information database for different patterns and behaviors. From the analysis of the files and their evolution in time we may not only infer the importance that a given software project allocates to the various activities, but also many other facts that may provide comprehension of the project and the whole development process. We will do this from several perspectives, focusing both on technical and human-related aspects. The structure of this paper is as follows: next section deals with related research, while Section 3 is devoted to explain our methodology. The methodology has been applied in Section 4 to the KDE project, a libre2 software desktop environment with hundreds of applications and a large development community, showing several ways of analyzing the data. The diversity of the files in KDE as well as some main characteristics of the human resources will be addressed in it. Finally, conclusions, lessons learned about the KDE project and some ideas for further work will be drawn. 2. Related work There is a good amount of literature devoted to the analysis of source code, both in the proprietary and in the libre software realms, but only a part of it is related directly to this paper. Especially akin are the works that have focused on software development historic databases, extracting information from them to better understand and improve the underlying development process. In any case, these studies usually target only source code files. For instance this is the case of the analysis of the evolution of several large industrial software systems, which have been used as the basis for the formulation of Lehman’s laws of software evolution (Lehman and Belady, 1985). Many research groups have started to look at meta-data provided by versioning systems, focusing on aspects that are beyond source code, such as the impact of software tools on the development process (Atkins et al., 2002) or the identification of the reasons for changing the software
2 Throughout this article we use the term ‘libre software’ to refer both to free and open source software.
(Mockus et al., 2000). Some authors have proposed that text should be treated as software and that the analysis of software repositories should routinely be augmented with the text that is used to develop the software systems (Dekhtyar et al., 2004). In this regard, the recent public availability of many repositories has made the task of mining them more attractive for researchers, especially concerning maintenance activities (Zimmermann et al., 2005; Purushothaman and Perry, 2005). This is notably the case of libre software systems, which in general offer public access to all the project-related information, including their versioning system archives. The study of libre software has gained special attention by the research community in the last years (Mockus et al., 2002; Fuggetta, 2003; Dinh-Trong and Bieman, 2005) and some efforts towards automatically measuring the information surrounding these software projects have already been proposed and undertaken (German, 2004a). The high amount of data offers the possibility of empirical studies at a fine-grained level of detail (German, 2004b). For instance, some human factors may be analyzed in depth, such as what files have been ‘touched’ by whom and when, resulting in a developer territoriality map (German, 2004c). The ‘human’ factor becomes especially interesting for two reasons. First, attending to Conway’s law, organizations which design systems are constrained to produce designs which are copies of their communication structures (Conway, 1968). And second, it may be used to infer the development and maintenance costs of the software development life cycle. Some works have already studied the latter aspect, trying to figure out, by means of studying software repositories, how much effort is to be applied when changing a software system (Graves and Mockus, 1998). It should be emphasized that the human factor is especially interesting in the environment of our case study, as the project that has been selected is part of the libre software phenomenon. In this kind of environments, some traditional rules are not maintained and projects are at least partially (if not fundamentally) based on volunteer activity and self-selecting task fulfillment; self-organization seems to arise (Lopez et al., 2004) and an underlying community structure is created (Gonzalez-Barahona et al., 2004).
3. Methodology The methodology described in this paper is based on the analysis of the log entries from versioning repositories, such as the widely used CVS (Concurrent Version System). For every interaction (i.e. commit) with the CVS repository performed by a commiter,3 the following data are collected
3 A commiter is a person who has write access to the repository and performs a commit on it at a given time.
G. Robles et al. / The Journal of Systems and Software 79 (2006) 1233–1248 Table 1 (Incomplete) set of matches performed to identify the different file types File type
Extension/filename matching
Documentation Images i18n ui Multimedia Code Build Devel-doc
*.html *.txt *.ps *.tex *.sgml *.png *.jpg *.jpeg *.bmp *.gif *.po *.pot *.mo *.charset *.desktop *.ui *.xpm *.theme *.mp3 *.ogg *.wav. *.au *.mid *.c *.h *.cc *.pl *.java *.s *.ada configure.* makefile.* *.make readme* changelog* todo* hacking*
in the logs: commiter username, date, filename, revision number, number of lines added, number of lines removed, and an explanatory comment introduced by the commiter. In addition, there is some file-specific information in the CVS logs that can be skimmed, such as whether a file has been removed.4 Before describing the methodology in detail, it is worth noticing that we have automated the whole process with the CVSAnalY tool (Robles et al., 2004). This tool consists of a set of scripts that retrieve and extract information from the CVS logs, feeding a database and later querying it to perform statistical analysis, calculate several inequality and concentration indexes, and generate graphs for the evolution in time of some interesting parameters (commits, commiters, LOCs . . .). Results can be accessed through a publicly accessible web interface that permits easy inspection. Other research groups have also used this tool for longitudinal analysis of software systems (Massey, 2005). 3.1. File discrimination Although versioning repositories were originally designed for the management of several versions of source code files, in today’s projects some other artifacts, such documentation, translations and images as are also included. For our purposes, we will classify files that we could find in a software development repository into documentation, images, translation (i18n), user interface (ui), multimedia and source code files. For the latter type, we have used a more detailed analysis, and will distinguish between source code that is part of a software application (code) from the one that helps in the building process (build) and from documentation files that are tightly bound to the development and building process (devel-doc). The discrimination process is accomplished with the help of heuristics that take into account the extension of the files, and in some cases the whole filename. Hence, for every file type we have built a list of extensions and common filenames (Table 1 gives an excerpt of these lists). 4
In CVS there is actually no file removal: files that are not required anymore are stored in the Attic and may be called back anytime in the future.
1235
Every file in the repository is then matched against these lists in order to find out its file type. For instance, it is common that a .c file contains source code (usually in the C programming language, although that level of detail is not important in our case). Files that do not fall into any of the previous categories (generally those without or with an infrequent extension) have been labeled as ‘unknown’. Our experience with several large libre software projects with hundreds of thousands of files is that usually through manual inspection the amount of commits performed to unknown files can be minimized to values under 6% so that their effect is relatively small. 3.2. Data mining and analysis Once the CVS logs have been parsed and filenames have been identified and sorted into the corresponding file type, the resulting information is fed into a database. Later this database is queried for patterns and behaviors for the selected file types, and for the commiters that have worked on them. For the complete understanding of our analysis, it is important to define the notion of atomic commit.5 Unfortunately CVS does not keep track of the files have been committed (almost) at the same time and the absence of this concept may introduce some distortion into our analysis. Hence, we have implemented a sliding window algorithm proposed by German (German, 2004a) that identifies atomic commits from the CVS logs by grouping commits that have been done (almost) simultaneously. This algorithm considers that commits performed by the same commiter in a time interval can be marked as an atomic commit. The time interval is not constant as commit operations may take several seconds or minutes – especially if many files are involved (Zimmermann and Weigerber, 2004), and therefore the sliding capacity. Since we are interested in the behavior of distinct file types in the repository, our initial intention was to classify one to one file types with atomic commits. This is, of course, only possible if atomic commits contained only files from a single file type. As this is not the general case, we have figured out the concept of predominant file type for a given atomic commit. The idea is very simple: we attribute an atomic commit to the file type that appears most frequently in it; in the case of having two or more file types that are equally represented, the predominant file type will be selected randomly among them. 5
The concept of atomic commit can be found in literature with different wordings; some authors have used transaction (Zimmermann and Weigerber, 2004) or modification request (German, 2004c) to refer to the same idea. The term modification request is due to the influence of the first studies using historic databases of industrial large-scale systems (Mockus et al., 2000); in those environments maintenance activity had to be specified in documents called modification requests and these usually involved several changes (i.e. commits) that were conceptually tight together but not necessarily had to be performed at the same point of time.
1236
G. Robles et al. / The Journal of Systems and Software 79 (2006) 1233–1248
3.3. Limitations and further possibilities
Table 2 General statistics for the KDE project
There are several limitations on the methodology that we propose. The first one is related to the data source and the restrictions that may exist for having write access to the CVS, especially in the case of libre software systems. In those development environments, not everybody can commit to the repository, and in many cases changes, modifications and patches are centralized in a small set of developers (maybe just one), producing a gate-keeper effect. In industrial environments, this limitation should be negligible, since these activities are performed by staff members, not supposed to have such restrictions. Although the set of files that cannot be sorted can be minimized to statistically insignificant values, another limitation is given by the fact that our methodology is based on identifying and sorting files uniquely by their name without taking their content into account. Intrinsic errors in this process could be surpassed just by studying the file content. So, for instance, we have assumed in our methodology that all files with an .xml extension contain documentation as we have observed this is the predominant use of this extension in our case study. Of course, this may not be the general rule. For instance, the categorization of .xml files as documentation would not be a proper choice for projects using the Java-based Ant build tool. Extending the current method with heuristics that consider the content of files should not be a difficult task and would offer better results. This type of heuristic could be enhanced with the file placement within the directory tree as usually files from the same type are grouped together in directories.
Software size Number modules Number files Number commiters Number commits Number atomic commits Lines added Lines removed First commit Last commit Number of days
4. Case study: KDE The K Desktop Environment (KDE) is a multimillion source lines of code (SLOC) libre software project, aimed to build a software graphical desktop environment for UNIX-like operating systems. Besides the window manager and desktop facilities, it offers as the KDE distribution an application development framework and a great number of applications that range from the KOffice office suite to the KDE-games game package. It is mainly written in C++, although some other programming languages are also used. The desktop and its applications are built by making use of their application development framework, the Qt toolkit. A large community has flourished around KDE and the number of commiters is over one thousand. The inner functioning, decision structure and organization of KDE is similar to the one described in German (2004d) (although that study was performed on GNOME, another libre software desktop environment similar in goals, size and technological complexity). Table 2 gives a brief summary of KDE, its size in source lines of code, number of modules, files, commiters, com-
8134 KSLOC 90 442,445 1163 6,790,240 480,897 324,925 K 297,294 K 1997-04-09 2005-04-21 2934
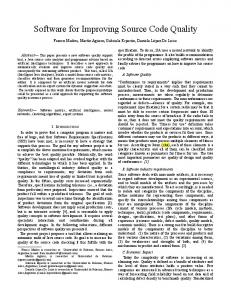
Fig. 1. Log–log representation of file types among KDE CVS modules. The vertical axis gives the number of commits, while the horizontal axis shows the number of modules. Modules have been sorted by number of commits, so those with higher number appear nearer to the origin.
mits, atomic commits, lines added and removed.6 We have added the time of the first commit (when the repository was set up) and the one for the last commit considered in this study to show that our study considers 8 years of development from the beginnings of KDE to its most current state. We have applied our analysis to the whole KDE CVS repository, although we could have limited our research to a smaller granularity level such as CVS modules or others (such as applications or directories). In the KDE case, a CVS module may contain an application or a set of applications. For instance, there is a 750 KSLOC KOffice module that groups some office applications (word processor, spreadsheet and presentation program, among others). The reason for this can be inferred from Fig. 1 which presents the distribution of commits per module for the selected file types (both axes are in logarithmic scale), being development the sum of code, build and devel-doc file
6
Note that we consider SLOC as ‘‘a line that finishes in a mark of new line or a mark of end of file, and that contains at least a character that is not a blank space nor comment’’, in opposition to lines that consider not only comments and blank lines in source code, but also, for instance, text lines in documentation files.
G. Robles et al. / The Journal of Systems and Software 79 (2006) 1233–1248
types. We can see from this figure that not all modules contain files from all the file types considered in this study (the point where the curves cross the horizontal axis is indicative – in logarithmic scale – for the number of modules that contain that specific file type). On the other hand, some modules contain a high amount of translation files, documentation files or images, a fact that can be read from the place where the curves cross the vertical axis. Further inspection of these modules has led to the conclusion that they do not contain a big share of other elements and that their purpose is project-wide. We have found that some modules serve for the project’s own administrative tasks, and that there also exists a module that stores all translation (i18n) files. Hence, for a complete analysis of the file types of KDE the whole repository had to be considered. Regarding the shape of the curves in Fig. 1, we had selected a log–log axis in order to identify the type of distribution. We expected to find power law distributions, common in other dynamic and social systems such as computer networks (Albert et al., 2000), as they are among the scaling laws that describe a fractal growth behavior. However, the curves point out to follow Poisson distributions, which differ qualitatively from power laws. At the time of this study, we cannot indicate if such a shape is the consequence of coordinated management in the KDE project, and it would be interesting to investigate if software projects with no coordination at all result in power law distributions as we had assumed. Probably the study of other repositories, like the one of the GNOME project (which should yield KDE-like results, i.e. Poisson distributions) and of all the projects hosted at SourceForge.net (where there is no joint management effort, i.e. presumably resulting in power laws) would provide some insight into this issue.
1237
A first impression offers some interesting information. KDE is clearly a software development project (code is the largest portion in the pies in Figs. 2 and 3). But the effort invested into development only reaches around 50% if we consider atomic commits as a measure of activity and around 25% if we take the number of files into account. The amount of translations is also a good indicator of the widespread adoption of the KDE project around the globe. Documentation and images are also heavily represented. The results also show how the number of multimedia files is minimal (in some sense denoting that KDE is not content-driven), while the user interface fraction (around 15%) is large enough to properly argument that
devel—doc
documentation
i18n
build
multimedia
ui unknown
code
images Fig. 2. Number of files by file type in KDE.
devel —doc
documentation build
i18n
ui unknown images
4.1. Basic statistics multimedia
Entering into detail, Table 3 sums up the main statistics for the KDE CVS repository: number of files, commits and predominant atomic commits for the distinct file types. These figures may provide an idea of the activity around any given file type that we are investigating.
code Fig. 3. Number of atomic commits by file type in KDE.
Table 3 Basic statistics on the KDE repository by file type: number of files (and share), number of commits (and share), number of predominant atomic commits (and share) and number of commiters (and share) File type
Files
%
Commits
%
Pred.At.Com.
%
Commiters
%
All file types Documentation Images i18n ui Multimedia Code Build Devel-doc Unknown
442,445 67,395 88,901 83,415 19,144 2354 107,855 39,337 8443 25,602
100 15.2 20.1 18.9 4.3 0.5 24.4 8.9 1.9 5.8
6,790,240 546,487 174,881 4,045,496 546,443 4703 1,074,018 203,298 65,451 129,463
100 8.0 2.6 59.6 8.0 0.1 15.8 3.0 1.0 1.9
480,897 41,266 8807 123,566 19,903 200 231,785 31,217 12,242 11,911
100 8.6 1.8 25.7 4.1 0.1 48.2 6.5 2.5 2.5
1163 692 606 399 754 88 974 898 741 744
100 59.5 52.1 34.3 64.8 7.6 83.7 77.2 63.7 64.0
1238
G. Robles et al. / The Journal of Systems and Software 79 (2006) 1233–1248
it is actually a desktop-targeted environment. Finally, the share of atomic commits corresponding to the unknown file type lies under 3%, although they suppose around 6% of the total number of files. Another characteristic that we can infer from Table 3 is that there exists some specialization among the commiters that devote their time to KDE (see column ‘Commiters’ and its share). This can be seen from the fact that none of the file types has been touched by all commiters. The most ‘popular’ file type is code with over 80% of the commiters ever having commited at least one code file, while multimedia files have been handled by just a few. The rest of the values, besides i18n, lie from more than 50% to some less than 80%. Commits to translation files can be observed only in one of every three commiters. We have to point out that there exist severe differences if we consider the data from the point of view of single commits or do it by means of grouping them into atomic commits. This is especially the case for the i18n file type that drops down from an almost 60% share in number of commits to around 25% in the number of atomic commits. We will devote the next section to a detailed analysis of atomic commits where we will gain some insight into this circumstance. 4.2. Atomic commits Atomic commits may provide an interesting point of view of the change patterns that occur in a repository. In this sense, we could look for coupling among source code files by identifying those files that are always committed together as done by Gall et al. (1997), denoting an inefficient system architecture if this behavior arises frequently. Similar concepts could be found for other file types or even among file types (for instance, if changes in the code are introduced simultaneously into the documentation). In this section we want to further understand atomic commits looking for evidences that we may infer from them. Table 4 gives the distribution of number of files that belong to atomic commits. In the case of KDE, most of the atomic commits contain a unique file. From previous research works, we know that this means that the use of a ChangeLog file that is updated at the same time as Table 4 Distribution of the number of files per atomic commit # Files
Atomic commits
%
Commits
%
1 2 3 4 5 >10 >25 >50 >100 >500 >1000
207,533 90,506 34,524 28,444 15,357 60,805 26,782 15,745 10,030 3153 878
43.2 18.8 7.2 5.9 3.2 12.6 5.6 3.3 2.1 0.7 0.2
207,533 181,012 103,572 113,776 76,785 5,777,911 5,224,383 4,839,605 4,432,171 2,937,576 1,294,392
3.1 2.7 1.5 1.7 1.0 85.1 76.9 71.3 65.3 43.3 19.0
changes are introduced is not common practice in KDE (German, 2004b). Although being the most frequent, atomic commits with one unique file only group around 3% of all the commits done to the repository. We can see that there exist many atomic commits with many files, which seems surprising at first. For instance, atomic commits that affect more than 1000 files correspond to only 0.2% of the total number of atomic commits, but almost to one out of every five commits. A more detailed analysis of the logs shows that this type of atomic commits belongs mainly to administrative and related tasks, such as checking in an initial version of the software, changing the year in the copyright notice, releasing software versions and moving, copying or removing a large number of files. We can conclude that the inclusion of atomic commits has as its first side effect that it filters out noise in our analysis, making the importance of the changes that have been introduced more conform with the actual change patterns of the project. As pointed out in the section devoted to the description of the methodology, we have sorted atomic commits by means of identifying the most predominant file type found in them. Table 5 tries to give further insight into this process for our case study; especially for auditing if this classification can be treated as accurate enough. In this sense, we can see that almost 85% of the atomic commits are composed of file types of the same sort (see row =100%). Of course, this number comprises all the atomic commits with one file (which sum up to 43% of all the atomic commits). In order to avoid the effect of having high percentages because of a reduced number of files in an atomic commit, we have considered in separate columns those atomic commits that group more than five files (which sum up to 104,533 atomic commits) and more than 50 files (of which we have 15,745 atomic commits). For these medium-sized and large atomic commits having all files of the same file type is uncommon, but the figures from Table 5 give evidence that the attribution to a single file type has a high validity. So, only 10.7% of all atomic commits do not have a predominant file type that supposes at least 80% of its files (for atomic commits with more than five files the Table 5 Predominance of a file type in atomic commits Predominance
Atomic commits
%
>5
(>5) %
>50
(>50) %
All =100% 50 files
%
>100 files
%
>1000 files
%
All Documentation Images i18n ui Multimedia Code Build Devel-doc Unknown
15,745 967 518 9476 2152 24 2009 368 17 214
3.3 2.3 5.9 7.7 10.8 12.0 0.9 1.2 0.1 1.8
10,030 578 235 6559 1626 12 739 166 7 108
2.0 1.4 2.7 5.3 8.2 6.0 0.3 0.5 0.1 0.9
878 207 15 593 22 0 21 6 0 14
0.18 0.50 0.17 0.48 0.11 0.00 0.01 0.02 0.00 0.12
The share gives always the fraction of atomic commits that affect >50, >100 and >1000 files related to the total number of atomic commits per file type.
1239
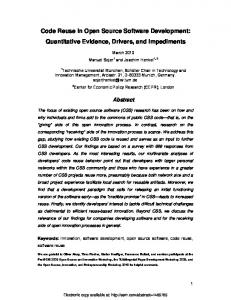
desktop-wide changes may introduced. So, changing some visual configurations affects many files, yielding a behavior similar to the one observed when source code has (too much) common coupling. Interesting is also the high amount of large atomic commits in which build files are predominant as we would assume that these files are modified in conjunction with code. Having that many atomic commits that mainly involve build files is indicative for frequent changes in the build procedures. On the other hand, this means that there may be also a high common coupling among these files in the sense that if a makefile has to be modified due to the introduction of a new flag, many files have to be ‘touched’ and committed. A higher level of abstraction for this task should be desirable, although this probably means migrating to a new build system or surpassing the limitations of current tools with a better design. 4.3. Evolution This section tries to apply Lehman’s software evolution methodology to the file types that we are investigating, especially in regard to the growth of the software systems (Lehman et al., 1997). As Lehman used source code files7 as the basic unit to measure software evolution this is an easy task with our methodology. There have been some previous studies on libre software from the software evolution perspective, being especially important a work by Godfrey et al. that showed a super-linear growth for the Linux kernel (Godfrey and Tu, 2000). Such a growth does not comply with the laws of software evolution and has been labeled by Lehman as an anomaly, inviting for further research on this topic (Lehman et al., 2001). Recent research has shown from the study of 22 large libre software projects that the most frequent growth trend is linearity, being Linux an exceptional case (Robles et al., 2005a). All in all, even with a linear behavior, the performance of such systems seem to be superior than the one inferred from (or predicted by) the laws of software evolution (Turski, 1996). Our goal in this subsection is to find out how the file types we have selected perform in time and if there are substantial differences in their behavior. Therefore, for every file type we plot the evolution of the number of files in the repository (total), the number of files in the attic (i.e. that have been removed) and the actual number of files that somebody obtains when retrieving the current version of the project (delivered). Of course, the delivered number of files, the only of the three that Lehman took into account, is the result of the total files minus the removed files. For the sake of brevity, we have included only two of the plots, one for the evolution of the number of code files 7
Lehman uses the concept of ‘‘module’’ in his writings to refer to a source code file. We will stick in this work to source code file in order to avoid the confusion with CVS module.
1240
G. Robles et al. / The Journal of Systems and Software 79 (2006) 1233–1248 120000
100000
we find in KDE, typically small sound effects) usually do not require the joint work of many people. We can imagine that there exists a high specialization for this type of tasks and will investigate this issue in Section 4.6. And second, these files are mainly binary and CVS does not have a good support for those type of files; developers seem to avoid in these cases the use of CVS until it is finally necessary.
delivered total inAttic
80000
60000
40000
4.4. Territoriality
20000
In a case study performed on source code files of a 200 KSLOC libre software application developed by a software company with the help of the community, a common pattern was observed and reported: that certain files were only ‘touched’ by the same developer (German, 2004b). This means, that even in the libre software field, where source code is publicly available and third parties are invited to join development, code territoriality may exist. Our intention in this subsection is to check first, if this is also the case in larger environments such as the KDE project and second, if this is a general pattern for all file types. Territoriality is of interest for maintenance purposes at least regarding source code (but probably for many other file types) for various reasons (Gıˆrba et al., 2005): first, it may allow to infer the organizational structure of the project, which may give some insight about the technical one (Conway, 1968). Second, it allows to identify the original authors, supposed to have knowledge and experience on the underlying elements. And third, many commiters working on the same file could signify that peer review is done. Hence, we have counted the number of commiters that have performed changes to a given file and have analyzed results statistically, discriminating by file type. The results are exposed in tabular form in Table 7. Again, i18n seems to have a behavior clearly different from the rest. Almost all (if not all) translation files have been changed by at least two commiters. This is surprising as KDE usually does not provide write access to the CVS to all translators of each language, but only for a small set of them, and in Section 4.2 we had found a gate-keeper effect. An inspection of the commits and the responsible commiters has given us the answer: some commiters (probably with the help of scripts) are responsible for a high amount of commits to i18n files, mainly for administrative reasons as copying and removing files. On the other hand, we can observe how the number of commiters in the last decile have very values compared to other text-based file types. This can be easily explained if we have in mind the diversity of languages into which KDE is translated; in this sense, we have many small teams that work independently on supporting a language. Finding a i18n file with many contributors will then be seldom the case. The binary file types (mainly images and multimedia) present low number of authors, due in part to the limitations that CVS exhibits with this type of files.
0 1997
1998
1999
2000
2001
2002
2003
2004
2005
2006
Fig. 4. Growth of the number of code files in time. The vertical axis gives the number of files, while the horizontal one gives the time.
(see Fig. 4) and another one for the evolution of i18n files (see Fig. 6) in a significant size and have summed up the rest in a smaller size in Fig. 5. Fig. 4 shows a super-linear growth trend for code files in the early stages of the project for the three ways of counting modules that we have considered. From 2002 onwards, the number of total files shows a clear linear trend, but the number of files that have been removed clearly slows down yielding an accelerated growth pattern for the number of delivered files. It should be noted that we are considering the whole project repository and that this means that we are really looking at an aggregate measure of many CVS modules (which may be at the same time the aggregation of several applications). In other words, the current behavior may be the effect of multiple independent development groups whose interactions are rare or at least limited. This was one of the arguments that Godfrey used to explain the super-linear growth of the Linux kernel: many parts could be developed and maintained independently (Godfrey and Tu, 2000). This may be also the case for KDE, as the six KDE applications studied in Robles et al. (2005a) have linear or near-to-linear behaviors.8 Fig. 5 shows that all other file types follow similar patterns for delivered, total and removed files than the ones shown for code files. The results for multimedia files are the only ones that differ significantly from the rest as it can be seen from Fig. 6. For this file type, files are introduced and removed from the repository in a non-continuous way from time to time (with a rhythm that is similar to the main releases of KDE) and in large amounts, producing discontinuous curves. This may be explained in several ways. First, multimedia files (at least the ones
8 The reader should note that the sum of linear behaviors may give super-linearity; this is because linearity is observed only once the project has started and not before. So, the aggregation of two linear projects results linear iff the projects have started at the same time.
G. Robles et al. / The Journal of Systems and Software 79 (2006) 1233–1248 40000 35000
9000
delivered total inAttic
1241
delivered total inAttic
8000 7000
30000
6000
25000
5000 20000 4000 15000
3000
10000
2000
5000
1000
0 1997 1998 1999 2000 2001 2002 2003 2004 2005 2006
0 1997 1998 1999 2000 2001 2002 2003 2004 2005 2006
(a) Build
(b) Devel-doc
70000 60000
delivered total inAttic
50000 40000 30000 20000 10000 0 1997 1998 1999 2000 2001 2002 2003 2004 2005 2006
(c) Documentation
90000 80000
90000
delivered total inAttic
80000
70000
70000
60000
60000
50000
50000
40000
40000
30000
30000
20000
20000
10000
10000
0 1997 1998 1999 2000 2001 2002 2003 2004 2005 2006
delivered total inAttic
0 1997 1998 1999 2000 2001 2002 2003 2004 2005 2006
(d) Images 20000 18000
(e) i18n delivered total inAttic
16000 14000 12000 10000 8000 6000 4000 2000 0 1997 1998 1999 2000 2001 2002 2003 2004 2005 2006
(f) ui Fig. 5. Growth plots (delivered, total and removed files) for the specified file types in time. In all of them the vertical axis gives the number of files, while the horizontal one gives the time.
On the other hand, the need to change this type of files is usually lower than for the rest of text-based file types.
Regarding code, while the median value is two commiters, we have to wait until the forth decile to find files with two commiters. But interestingly enough, source code is the
1242
G. Robles et al. / The Journal of Systems and Software 79 (2006) 1233–1248 2500
based file types achieve in the last two deciles. In this sense, they stay in the same order of magnitude as i18n. This may be indicative for a small set of commiters having the required knowledge to change ui files. In Section 4.6 we will try to find out if these commiters are mainly devoted to interface design tasks or if they are code developers that also modify the interface. Finally, we can observe from the table that files that have been sorted as unknown do not have many commiters working on them. The results for these files shows that the mean value lies between the binary file types and the textbased.
delivered total inAttic
2000
1500
1000
500
4.5. File archeology 0 1997
1998
1999
2000
2001
2002
2003
2004
2005
2006
Fig. 6. Growth of the number of multimedia files in time. The vertical axis gives the number of files, while the horizontal one gives the time.
60000
50000
40000
documentation images i18n ui multimedia code build devel-doc unknown
30000
20000
10000
0
1999
2000
2001
2002
2003
2004
2005
Fig. 7. File archeology for all file types. Absolute values in the vertical axis measured in number of files. The horizontal axis is given by time starting January 2001.
only file type that has a B80/T20 value9 that is above 1 meaning that the weight of the two last deciles is not that significant as in all other cases (i.e. programming work is more equally distributed than it is for the other file types). Documentation is a task that shows to have a very personal behavior, being the number of files that have been worked on by several commiters very low. As we have considered HTML pages as part of documentation, we expected these type of files to be changed frequently and by several persons. This may raise the question if enough effort is dedicated to this task in KDE. User interface files show a clearly different pattern with few files touched only by a single commiter (between 20% and 30%), but on the other side do not reach the high numbers that other text-
9 The B80/T20 value gives a comparison of the contribution of the bottom 80% compared to the top 20%. If the B80/T20 value is 1, then we would have a situation where the bottom 80% contributes as much as the top 20%.
Software archeology may provide a useful metaphor (Hunt and Thomas, 2002; Robles et al., 2005b) of the tasks that a software developer has to face when performing maintenance on large software projects: the source code of a program at any point in time is the result of many different changes introduced in the past, usually by several people. In this respect, the maintenance process can be thought in general to be more easy if affected files are not old (legacy) code. Our assumption is that files that are too ‘old’ (remain in the system unchanged from early stages in the development process) are less maintainable, since the developers that created them may not be part of the team anymore. The archaeological point of view is conceptually very close to the idea of code decay as proposed by Eick et al. (2001) and tightly related to the software evolution results shown above. In the case of the super-linear growing Linux kernel, Godfrey stated that one of the causes for such growth could be the presence of many old files, especially drivers, that are not maintained but that are kept in the kernel as some users may still use them (Godfrey and Tu, 2000). As we have seen, KDE also exposes a super-linear growth trend for almost all of its file types, so an archaeological analysis may show if this is because of the presence of massive legacy code. The methodology supporting archeology is very simple: we will look at the files that the current version has (so, we do not take into account those that have been removed) and find out when they were modified last. Fig. 7 is an aggregated plot of the files that remain unmodified since 2001; hence, the curves for all file types end April 2005 with their current number of files. We can observe from this figure that most file types show a similar trend having few files that were modified last in 2001 or earlier and an increasing number of files that have been created or modified in recent times. Especially acute is the case for i18n files, where almost no files prior to mid-2004 are delivered currently. This means that translations files are updated continuously; the explanation for this behavior is that any new functionality in a graphical environment has a side effect on the menus of the applications. This requires to modify the files
G. Robles et al. / The Journal of Systems and Software 79 (2006) 1233–1248
1243
Table 7 Territoriality (in number of commiters) for files grouped by file type File type
Files
Mean
D1
D2
D3
D4
Median
D6
D7
D8
D9
D10
B80/T20
Build Code Devel-doc Documentation i18n Images Multimedia ui Unknown
39,337 107,855 8443 67,395 83,415 88,901 2354 19,144 25,602
2.39 2.88 1.9 1.88 3.37 1.45 1.41 3.08 1.7
1 1 1 1 2 1 1 1 1
1 1 1 1 2 1 1 1 1
1 1 1 1 2 1 1 2 1
2 2 1 1 3 1 1 2 1
2 2 1 1 3 1 1 2 1
2 2 2 2 3 1 1 2 2
2 3 2 2 4 2 2 3 2
3 4 2 3 5 2 2 4 2
4 6 3 3 6 2 2 7 3
86 104 52 164 22 8 9 27 278
0.81 1.13 0.81 0.76 0.57 0.46 0.47 0.92 0.64
The columns labeled as D* correspond to the deciles (the median is the 5th decile), while the B80/T20 column gives the results of dividing the sum of the bottom 80% with the top 20%.
that contain the menu labels to be translated. Usually, labels are grouped at the application level in one file per language, so even one modification in a code file that changes a label implies many commits to i18n files. Of course, this provides another explanation of why the number of commits for i18n files is that large. Fig. 8 gives the same information than the one depicted in the previous figure, but this time the vertical axis is relative to the total number of files for each file type. Besides the already mentioned findings for the i18n files, we can see a curious effect for the devel-doc files, for which almost 20% still persist in the version that was introduced in the repository in the year 1999. We have inspected what provokes this behavior and have found that it is due to the introduction April 30 that year of 853 .lsm files. These files are used as entries for the Linux Software Map, a project with the objective of listing all software available for Linux. On the other hand, it should be noted that more than half of the files (of all file types) have been modified in the last 2 years. This may give an idea of the vivacity of the project as well as a good indicator of the maintainability in the next future as many of the commiters that performed the last modifications are probably part of the current team.
100 90 80 70
documentation images i18n ui multimedia code build devel-doc unknown
60 50 40 30 20 10 0 1999
2000
2001
2002
2003
2004
2005
Fig. 8. File archeology for all file types. Relative values in the vertical axis measured in percentage (100% gives the files delivered currently). The horizontal axis is given by time starting January 1999.
4.6. Commiter specialization In libre software projects write access to the versioning system is usually not granted to everybody. This privilege is typically limited to contributors who reach a certain degree of commitment with the project and its goals. The relationship of the human resources with the file types and with each other deserves a study, especially in the libre software environment where developers and the tasks they devote their time to are self-selected and in general selforganized. Heat maps may provide a visual idea of the specialization of commiters, showing at the same time the relationship that exists between file types. Therefore, we have selected those commiters that have worked on a given file type and compute the number of atomic commits they have performed on it. Then, for the same set of commiters we look at their contribution on other file types (again in number of atomic commits). The fraction of the latter divided by the former will give us the relationship. This idea can be summarized in following equation, where i gives the row, j the column index and atomic commitsjji means atomic commits done to j by active commiters for i: P atomic commitsjji Relationshipði; jÞ ¼ P ð1Þ atomic commitsj If this fraction is close to 1 it will correspond in the heat map with a hot zone, represented as a dark color, while values close to zero will correspond to cold zones, represented by clear colors. In order to make the reading of the heat map easier, white has been reserved as background color and appears in the diagonal (that really should be black, since all its values are 1). Applying this idea on our case study will make the methodology clearer. In any case, it should be noted that the relationship shown in the heat maps has not to be symmetric, as in general Relationship(i, j) 5 Relationship(j, i). Since historical data for the project is available, we may also study the evolution of specialization. In this regard we have taken ten equally large time slots from the first commit to its present state, and have produced a heat map for each time slot. In the case of KDE, the first commit was done in April 1997, while the last one considered in
G. Robles et al. / The Journal of Systems and Software 79 (2006) 1233–1248
documentation
documentation
images
images
i18n
i18n
ui
ui
multimedia
multimedia
code
code
build
build
devel—doc
devel—doc
unknown
unknown
(a) 1st time slot
unknown
build
devel—doc
code
ui
multimedia
i18n
images
pattern is to have dark (hot) zones, i.e. high degrees of relationship. However, Fig. 9(b) shows that no such uniformity exists in the last time slot; lighter zones have become more frequent. In addition to multimedia files, we see that a new specialized group has emerged: translators (see i18n column). Also interesting is the fact that documenters do not have a big overlap with user interface and development documentation files, hinting to a trend towards becoming a more identifiable group in the next future. In any case, we can infer without doubt from inspecting both heat maps that the KDE project has undergone a specialization process that has occurred in parallel to its growth in the last years. At the beginnings, contributors were active within all file types (with the exception of multimedia), while as the project has evolved and has become larger in software size and in number of developers, we observe a clear tendency to find contributors that have a specific task in the project. It should be interesting to see how much this has been the effect of the investment that some software companies have made in KDE, especially in the sense of hiring already active developers or adding external man-power to the project. The previous heat maps raise the question if different commiter communities coexist in the project, with members of each community targeting a specific task and thus working predominantly on a given file type. We have therefore come up with an idea in which we use scatter plots that
unknown
build
devel—doc
code
ui
multimedia
i18n
images
documentation
this study dates from April 2005. Hence, the interval corresponding to each time slot lasts for about 293 days (almost 10 months) of activity. Fig. 9(a) corresponds to the time period from April 1997 to February 1998, while Fig. 9(b) corresponds to the last time period (from June 2004 to April 2005). Examining Fig. 9(a) may illustrate how a heat maps work. The first row shows the relationship of documentation with all other file types considered in this study. As noted before, the intersection of documentation with itself has been left white. The second column shows the fraction of all atomic commits on documentation that corresponds to commiters who have contributed both to documentation and images. This is a very hot zone (with values that lie between 0.8 and 1). The next column provides information about the number of atomic commits to documentation by those committing files to documentation and i18n. The relationship here is mild, as it lies between 20% and 50%. The contribution of commiters to documentation that have also worked on the user interface (forth column of the first row) lies between 50% and 80% and on multimedia (fifth column) is very cold being between 0% and 20%. In general terms, the most significant result from the analysis of the first time slot is the light color for the multimedia column. This means that we have found a specialized group of commiters who was responsible for the multimedia elements in KDE for the investigated time slot. We could point this out as an exception as the common
documentation
1244
more than 80%
more than 80%
> 50%
> 50%
> 20%
> 20%
> 0%
> 0%
0%
0%
(b) 10th (last) time slot
Fig. 9. File type relationship heat maps for the first and tenth (last) time slots.
G. Robles et al. / The Journal of Systems and Software 79 (2006) 1233–1248
1245
Table 8 Shapes used in the scatter plots that allow to identify the file type for which commiters have been more active (in number of atomic commits) File type
Shape
Development Documentation i18n Images Multimedia ui Unknown
Open rectangle Plus (+) Open circle Filled rectangle Filled circle X Point
Development groups code, build and devel-doc.
allow us to see on a two-to-two basis how commiters behave for two selected file types. The distribution of commiters in the XY space will give an idea of the specialization of commiters as well as the possible relationships that may exist between file types. In the scatter plots any point corresponds to a commiter. The shape of the point is given by the file type in which a commiter is being more active. Shape assignation follows the rules that are summarized in Table 8. In order to make the data offered by the scatter plots easier to work with we have taken the natural logarithm of the commits done by commiters. On one axis of the scatter plots contributions to a given file type are shown, while on the other axis contributions to some other file type are displayed. Commiters with commits on both file types will appear somewhere in the first quadrant, while those who only have commits on any of the two file types will be on the respective axis. This means that only active commiters will be shown (those who have at least one commit in any of the two file types under consideration). This confronts us with the problem of commiters who have not done commits to one of the file types but with a notable contribution to the other. In order to have them included, we have considered commiters that have 20 or more commits10 in one file type to have at least one commit to the other (if no commit had been done this was added automatically). This should not be a dramatic distortion of the data and should give us valuable information. The first scatter plot that we will examine is shown in Fig. 10(a), and presents development (which groups the code, build and devel-doc file types) contributions in the X-axis vs documentation in the Y-axis. There are several interesting facts that can be learned from this figure. First, that the development ‘population’ (open rectangles) is by far larger than any other one. Second, the location of commiters whose primary task is none of the two depicted is also interesting: translators (open circles) are generally grouped with documenters (pluses), while those who work on the user interface (X) appear in the open rectangle development dust of developers. Third, we can find among
10
ln(20) is almost 3.
Fig. 10. Community scatter plots. Number of commits of developers on the given file types. Axes in both figures are in logarithmic scale.
the most contributing commiters (log(commits) > 10, i.e. more than 20,000 commits) to the development file type nine persons, but only five of them have development as their first activity. Two more are mainly translators (open circles) and the other two are primarily documenters. Fig. 10(b) puts the documentation commits in the X-axis and sets in the Y-axis the ones related to i18n. It can be seen once more how there are several patterns followed by points of the same shape. It is interesting that the Y-axis
1246
G. Robles et al. / The Journal of Systems and Software 79 (2006) 1233–1248
contains only open circles, which means that many commiters only perform translation-related tasks. From this fact again we can infer some degree of specialization in a project: almost half of the translators in the KDE project do not perform any documentation activity at all. Another interesting finding is that commiters whose priority are code commits appear usually mixed with documenters but not with translators, meaning that the affinity of these two groups may be bigger than with the people who do i18n. 5. Conclusions, lessons learned and further work In this article we have shown that looking at the versioning repositories for source artifacts beyond source code gives much insight into a software project from both a technical and management point of view. Therefore, we have proposed a methodology, created a tool that automates the analysis and exposed the possibilities of our ideas with a case study. One of the most important lessons learned is the possibility of using objective criteria to characterize software systems based on the relative importance of the various activities that take place during the development process. We have shown that taking commits as the main activity measure of a project may be misleading and that the use of the concept of atomic commits, which virtually groups files committed (almost) at once into a unique interaction, provides more realistic results. We have also introduced the notion of predominant file type for an atomic commit in order to further study the change patterns that arise for the elements under study. This idea has been completed with the observation of those atomic commits that are composed by large number of files, supporting the assumption that ideas used so far only for source code, like coupling, could also be adopted for other elements. On the other hand, we have generalized the concept of software evolution by applying it to all other file types. We have observed how this can be used to infer some characteristics of the software system under study. Innovative has also been the inclusion of the evolution of the number of files removed, although further research should study in depth this issue. Another idea that has been presented is file archeology, which is a measure of how old files are. We have demonstrated that this perspective allows to get information about the vivacity of the software system, a characteristic that could be especially interesting for companies wanting to adopt libre software systems, as these are generally developed in environments difficult to control and assess (participation of volunteers, global software development, lack of traditional practices, among others). From the management point of view, three key concepts have been handled: territoriality, specialization and communities. All of them have to be seen as a first attempt towards identifying the organizational structure of a project. Territoriality has been introduced to see how many developers collaborate on files for each type, trying to find
out if files are ‘‘touched’’ by one or two developers (indicative for high territoriality) or by more. Gate-keeper effects and distribution of work can be identified by means of this analysis. Further insight is provided by the study of specialization, concerned with the number of file types that developers work on; if in general they attend many file types then the specialization in a project is low, while if they focus on a reduced set of file types we have specialized developers. Companies wanting to invest on a libre software development project could use this information to see where their investment could be more beneficial; if low specialization is the case, specialized contributions could be required. A longitudinal analysis, as the one we have performed, gives us evidence about project members becoming more specialized in time or not. Finally, we have studied the various commiter communities that arise in the project, with members of each community targeting specific tasks. By means of scatter plots we have showed a graphical way that allows to infer how these communities relate one to each other. 5.1. Lessons learned about the KDE project In order to illustrate the possibilities and interest of our methodology, we have applied the methodology to KDE, a large libre software system. But beyond some implementation details, our methodology should be applicable to almost any industrial environment that makes use of a versioning tool for development and maintenance tasks with independence of the granularity level (from whole repositories to directories). We have recognized that many of the patterns found for the various file types are due to the use of a versioning system, specifically CVS, which has been conceived for supporting the development of code, but is not suited for other file types. This is the case for binary files (especially multimedia files), as its evolution and territoriality pattern evidence, and for i18n, where a gate-keeper effect appears. Contributors to the project that attend other elements that are not code have to adapt their way of working to the versioning system, although the contrary should be the ideal case. KDE has recently switched from CVS to a more modern system, Subversion, which at least solves the limitations with binary files. We have evidenced that beyond work on source code, the KDE project devotes much effort to other tasks, especially i18n and documentation, By considering commits as the measure of activity, we have found that i18n files are over-represented; the introduction of the concept of atomic commit and other analysis show that many of those commits are due to administrative work (copying/removing files), some of it probably in a semi-automatic way. In addition, the study of the predominant file type in atomic commits has given as result that build and ui show a behavior similar to (too much) common coupling for source code. This is the consequence of observing that atomic commits for those file types have frequently many
G. Robles et al. / The Journal of Systems and Software 79 (2006) 1233–1248
files, so we assume that changes to one of the files propagates to the other ones. We have noticed that the KDE project throws a superlinear growth as it has been previously reported for other libre software systems, such as the Linux kernel, and in contradiction with some of the laws of software evolution. Interestingly enough, this growth pattern has been observed for almost all file types considered in the study. On the other hand, thanks to the archaeological study, we have a measure of the vivacity of the project. In the case of KDE, more than half of the files for all file types have been modified in the last 2 years, a fact that is indicative for the recent work that has been undertaken in the project and for the support that this community may offer in the near future. In general, we have also evidenced that the contributors to the KDE project have become more specialized in time. We have seen that for some file types specialization is given from the beginnings, while for other file types this has occurred more recently as the software project has grown in size and number of contributors. 5.2. Future work The findings related to specialization and communities that have been presented in this article are especially interesting for non-hierarchical environments like the ones found in the libre software world, where self-organization and volunteer work applies. Hence, we find that further research could help lowering the gap between the software industry and the libre software world and should focus on finding out how software companies could benefit from this type of environments with the help of analysis like the ones proposed here. From a more technical point of view, an interesting follow-up could be to deepen in the discrimination of the files, attending to their content and widening the classification. So, code files could be sorted by programming language. New communities could be identified and new relationships would probably arise. Another possible research line is the identification of groups of files that are regularly part of the same atomic commits. This has already been studied in literature for source code, and we have seen some hints about this for other file types in this paper. But a more general study could be made, attending not only to the study of coupling for each file type on its own, but also considering coupling among them. Acknowledgements The work of Gregorio Robles and Jesus M. GonzalezBarahona has been funded in part by the European Commission, under the CALIBRE CA, IST program, contract number 004337, in part by the Universidad Rey Juan Carlos under project PPR-2004-42 and in part by the Spanish CICyT under project TIN2004-07296.
1247
References Albert, R., Barabasi, A.L., Jeong, H., Bianconi, G., 2000. Power-law distribution of the World Wide Web. Science 287, 2115a. Atkins, D.L., Ball, T., Graves, T.L., Mockus, A., 2002. Using version control data to evaluate the impact of software tools: a case study of the version editor. IEEE Transactions on Software Engineering 28 (7), 625–637. Conway, M., 1968. How do committees invent? Datamation 14 (4), 28–31. Dekhtyar, A., Hayes, J.H., Menzies, T., 2004. Text is software too. In: Proceedings of the International Workshop on Mining Software Repositories, Edinburg, Scotland, UK, pp. 22–25. Dinh-Trong, T.T., Bieman, J.M., 2005. The FreeBSD project: a replication case study of Open Source development. IEEE Transactions on Software Engineering 31 (6), 481–494. Eick, S.G., Graves, T.L., Karr, A.F., Marron, J.S., Mockus, A., 2001. Does code decay? Assessing the evidence from change management data. IEEE Transactions on Software Engineering 27 (1), 1–12. Fuggetta, A., 2003. Open source software – an evaluation. Journal of Systems and Software 66 (1), 77–90. Gall, H., Jazayeri, M., Klo¨sch, R., Trausmuth, G., 1997. Software evolution observations based on product release history. In: Proceedings of the International Conference on Software Maintenance, Bari, Italy, pp. 160–170. German, D.M., 2004a. Mining CVS repositories, the softChange experience. In: Proceedings of the International Workshop on Mining Software Repositories, Edinburgh, UK, pp. 17–21. German, D.M., 2004b. An empirical study of fine-grained software modifications. In: Proceedings of the International Conference in Software Maintenance, Chicago, IL, USA, pp. 316–325. German, D.M., 2004c. Using software trails to reconstruct the evolution of software. Journal of Software Maintenance and Evolution: Research and Practice 16 (6), 367–384. German, D.M., 2004d. The GNOME project: A case study of Open Source, global software development. Journal of Software Process: Improvement and Practice 8 (4), 201–215. Gıˆrba, T., Kuhn, A., Seeberger, M., Ducasse, S., 2005. How developers drive software evolution. In: Proceedings of the International Workshop on Principles in Software Evolution, Lisbon, Portugal, pp. 113– 122. Godfrey, M.W., Tu, Q., 2000. Evolution in Open Source software: a case study. In: Proceedings of the International Conference on Software Maintenance, San Jose, California, pp. 131–142. URL: http:// plg.uwaterloo.ca/migod/papers/icsm00.pdf. Gonzalez-Barahona, J.M., Lopez-Fernandez, L., Robles, G., 2004. Community structure of modules in the Apache project. In: Proceedings of the 4th Workshop on Open Source Software Engineering, Edinburg, Scotland, UK. Graves, T.L., Mockus, A., 1998. Inferring change effort from configuration management databases. In: 5th IEEE International Software Metrics Symposium, Bethesda, Maryland, USA, p. 267. Hunt, A., Thomas, D., 2002. Software archaeology. IEEE Software 19 (2), 20–22. Lehman, M.M., Belady, L.A. (Eds.), 1985. Program Evolution: Processes of Software Change. Academic Press Professional, Inc., San Diego, CA, USA. Lehman, M.M., Ramil, J.F., Wernick, P.D., Perry, D.E., 1997. Metrics and laws of software evolution – the nineties view. In: Proceedings of the Fourth International Software Metrics Symposium, Albuquerque, NM, USA, pp. 20–32. Lehman, M.M., Ramil, J.F., Sandler, U., 2001. An approach to modelling long-term growth trends in software systems. In: International Conference on Software Maintenance, Florence, Italy, pp. 219–228. Lopez, L., Gonzalez-Barahona, J.M., Robles, G., 2004. Applying social network analysis to the information in CVS repositories. In: Proceedings of the International Workshop on Mining Software Repositories, Edinburg, Scotland, UK, pp. 101–105.
1248
G. Robles et al. / The Journal of Systems and Software 79 (2006) 1233–1248
Massey, B., 2005. Longitudinal analysis of long-timescale Open Source repository data. In: Proceedings of the International Workshop on Predictor Models in Software Engineering (PROMISE 2005), St. Louis, MI, USA. Mockus, A., Votta L.G., 2000. Identifying reasons for software changes using historic databases. In: Proceedings of the International Conference on Software Maintenance, San Jose, CA, USA, pp. 120–130. Mockus, A., Fielding, R.T., Herbsleb, J.D., 2002. Two case studies of Open Source software development: Apache and Mozilla. ACM Transactions on Software Engineering and Methodology 11 (3), 309–346. Parnas, D.L., 1994. Software aging. In: Proceedings of the International Conference on Software Engineering, Sorrento, Italy, pp. 279–287. Purushothaman, R., Perry, D.E., 2005. Toward understanding the rhetoric of small source code changes. IEEE Transactions on Software Engineering 31 (6), 511–526. Robles, G., Koch, S., Gonzalez-Barahona, J.M., 2004. Remote analysis and measurement of libre software systems by means of the CVSAnalY tool. In: Proceedings of the 2nd ICSE Workshop on
Remote Analysis and Measurement of Software Systems (RAMSS), Edinburg, Scotland, UK, pp. 51–55. Robles, G., Amor, J.J., Gonzalez-Barahona, J.M., Herraiz, I., 2005. Evolution and growth in large libre software projects. In: Proceedings of the International Workshop on Principles in Software Evolution, Lisbon, Portugal, pp. 165–174. Robles, G., Gonzalez-Barahona, J.M., Herraiz, I., 2005. An empirical approach to software archaeology. In: Poster Proceedings of the International Conference on Software Maintenance, Budapest, Hungary, pp. 47–50. Turski, W.M., 1996. Reference model for smooth growth of software systems. IEEE Transactions on Software Engineering 22 (8), 599–600. Zimmermann, T., Weigerber, P., 2004. Processing CVS data for finegrained analysis. In: Proceedings of the International Workshop on Mining Software Repositories, Edinburg, Scotland, UK, pp. 2–6. Zimmermann, T., Weigerber, P., Diehl, S., Zeller, A., 2005. Mining version histories to guide software changes. IEEE Transactions on Software Engineering 31 (6), 429–445.