BIOINFORMATICS APPLICATIONS NOTE Systems biology
Vol. 26 no. 20 2010, pages 2639–2640 doi:10.1093/bioinformatics/btq436
Advance Access publication August 11, 2010
MetDAT: a modular and workflow-based free online pipeline for mass spectrometry data processing, analysis and interpretation Ambarish Biswas1 , Kalyan C. Mynampati1 , Shivshankar Umashankar1 , Sheela Reuben1 , Gauri Parab2 , Raghuraj Rao1 , Velayutham S. Kannan1 and Sanjay Swarup1,2,3,∗ 1 Singapore-Delft
Associate Editor: Trey Ideker
ABSTRACT Summary: Analysis of high throughput metabolomics experiments is a resource-intensive process that includes pre-processing, pretreatment and post-processing at each level of experimental hierarchy. We developed an interactive user-friendly online software called Metabolite Data Analysis Tool (MetDAT) for mass spectrometry data. It offers a pipeline of tools for file handling, data pre-processing, univariate and multivariate statistical analyses, database searching and pathway mapping. Outputs are produced in the form of text and high-quality images in real-time. MetDAT allows users to combine data management and experiment-centric workflows for optimization of metabolomics methods and metabolite analysis. Availability: MetDAT is available free for academic use from http:// smbl.nus.edu.sg/METDAT2/. Contact:
[email protected] Received on May 3, 2010; revised on July 20, 2010; accepted on July 25, 2010
1
INTRODUCTION
Metabolomics experiments conducted using mass spectrometry produce spectral outputs amounting to gigabytes of data. This is a result of elaborate experimental set-ups with several replicates, time-series studies and different types of treatment parameters for a single sample. Datasets from such experimental set-up can be very complex. Querying information from several subsets of complex datasets and deriving meaningful biological interpretation is very challenging. To overcome this problem in data handling and analysis, the metabolomics research community has recommended a minimal set of reporting standards and general guidelines for data analysis, interpretation and exchange of metabolomics experiments (Fiehn et al., 2008; Goodacre et al., 2007; Sansone et al., 2007). Data pre-processing generally involves removal of noise and reduction of baseline of the raw data. The resulting data are normalized and scaled for univariate and multivariate statistical analysis. Visualization of the resultant output helps to understand and interpret experimental results. A number of standalone data analysis tools for preprocessing, statistical analysis and pathway mapping (mzMine, XCMS, MassTrix, Metexplore, Bioconductor) are freely available on the web (Jourdan et al., 2010; Katajamaa et al., 2007; Lommen, 2009). Currently, these available data analysis tools do ∗ To
whom correspondence should be addressed.
not have the means to include information from experiment such as hierarchical data structure. As a result, meaningful inferences based on comparisons at the various levels of data structure are not straightforward and their associated effects are not easily interpreted. Most of the available tools require continuous interaction with users in the programs leading to delayed output. Here, we present Metabolite Data Analysis Tool (MetDAT) to address gaps in the currently available software for mass spectrometry data analysis in a systems-centric approach. MetDAT is a web-based tool with an open and integrated system that performs data preprocessing, analysis followed by database searches with filters to refine the output. MetDAT also provides interactive and customizable modules and user-driven analysis of data at hierarchical levels.
2 2.1
METHODS AND IMPLEMENTATION Computational model and user interface
MetDAT is a platform-independent web application, which works well with most widely used web browsers such as Mozilla Firefox (above 3.2), Internet Explorer (above 6), Google Chrome and Safari. The web interface of MetDAT is developed using HTML and CGI-Perl scripts. Computational functions of MetDAT are written in Perl and R languages, while graphics are generated using Gnuplot (Williams et al., 1993) and R packages (R Development Core Team, 2008). The software is hosted on a server running Red Hat Enterprise Linux Server release 5.4. MetDAT accepts input data as tab-delimited text files in a single zipped file which is then converted into a matrix by ‘Prepare Dataset’ module. The standalone modules run seamlessly on uploaded data and show the results instantaneously but these results are not saved on MetDAT’s server. All MetDAT programs can be used without any log-in. However, loggedin users have the benefit of creating custom workflows or using a default one. The workflows are designed such that the data can be cleaned up, analyzed, visualized and interpreted all in one smooth pipeline. Two default workflows—one for differential metabolite analysis and another for method optimization are provided in MetDAT. The uploaded datasets, workflows and results are automatically stored on MetDAT server and can be retrieved at a later time. MetDAT has no restrictions on the number of files to be processed. However, larger datasets would require longer processing time. This software has a combination of 23 most commonly used programs by metabolomics researchers for pre-processing, pre-treatment, data analysis, visualization, metabolite database search and pathway mapping. Other programs like self organizing map, Random forest and support vector machine are not available in this version of the software. These programs have been streamlined such that they can be used readily by beginners while providing ample controls
© The Author 2010. Published by Oxford University Press. All rights reserved. For Permissions, please email:
[email protected]
[18:24 20/9/2010 Bioinformatics-btq436.tex]
Downloaded from bioinformatics.oxfordjournals.org at National University of Singapore on October 26, 2010
Water Alliance, National University of Singapore, Singapore 117576, 2 Small Molecules Biology Laboratory, Department of Biological Sciences, National University of Singapore, Singapore 117543 and 3 NUS Environmental Research Institute (NERI), #02-01, T-Lab Building (TL), 5A Engineering Drive 1, Singapore 117411
2639
Page: 2639
2639–2640
A.Biswas et al.
multiple filters for better and targeted results. The database search includes a feature for metabolic pathway identification. Key differential metabolites are highlighted for users to focus on selected parts of metabolic networks.
3
CONCLUSIONS
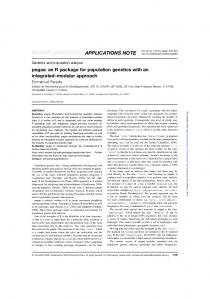
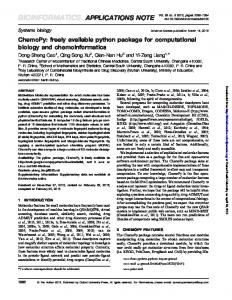
ACKNOWLEDGEMENTS The authors gratefully acknowledge the support and contributions of the Singapore-Delft Water Alliance (SDWA). The research presented in this work was carried out as part of the SDWA’s Aquatic Science Centre at Ulu Pandan programme. Fig. 1. Screen shot from MetDAT v2.0 software. Individual programs are accessible by left panel. Important functions such as workflow creation, data management, account details and visualization can be accessed via dashboard. Graphical outputs from the various programs in MetDAT are shown at the bottom. for customization by advanced users. User interface provides a dashboard for easy access to the programs and results (Fig. 1). A standalone visualization module that is accessible from the dashboard has two types of interactive plots—X–Y plot and barchart. These require Adobe Flash plug-in to be installed in the browser. Algorithms for programs, references, user guide and examples are included in the manual at the website for easy reference.
2.2
Data processing, analysis and output
The pre-processing and pre-treatment modules in MetDAT include removing noise, correction of base lines and normalizing or scaling the data to increase signal-to-noise ratio. Data analysis includes a range of statistical techniques such as analysis of variance, principal component analysis, partial least square (PLS), partial least square-discriminant analysis (PLS-DA), linear discriminant analysis and t-test. The major strength of this software is the power to analyze data at various hierarchical levels such as samples, treatments, time points, biological repeats and technical replicates. Datasets for the different hierarchical levels can be assigned at data preparation. It provides users the option to perform intensive statistical analysis at any of these levels. Differentially expressed metabolites are listed based on fold change and t-test analysis. The listed metabolites can further be searched against four databases—Aracyc (Mueller et al., 2003), HMDB (Wishart et al., 2009), Plantcyc and KEGG (Kanehisa and Goto, 2000) along with
Funding: Singapore-Delft Water Alliance (WBS No: R-264-001002-272). Conflict of Interest: none declared.
REFERENCES Fiehn,O. et al. (2008) Quality control for plant metabolomics: reporting MSI-compliant studies. Plant J., 53, 691–704. Goodacre,R. et al. (2007) Proposed minimum reporting standards for data analysis in metabolomics. Metabolomics, 3, 231–241. Jourdan,F. et al. (2010) MetExplore: a web server to link metabolomic experiments and genome-scale metabolic networks. Nucleic Acids Res., 38, W132–W137. Kanehisa,M and Goto,S. (2000) KEGG: kyoto encyclopedia of genes and genomes. Nucleic Acids Res., 28, 27–30. Katajamaa,M. et al. (2007) Data processing for mass spectrometry-based metabolomics. J. Chromatogr. A, 1158, 318–28. Lommen,A. (2009) MetAlign: interface-driven, versatile metabolomics tool for hyphenated full-scan mass spectrometry data preprocessing. Anal Chem., 81, 3079–3086. Mueller,L.A. et al. (2003) AraCyc: a biochemical pathway database for Arabidopsis. Plant Physiol., 132, 453–460. R Development Core Team (2008) R: a language and environment for statistical computing. R Foundaton for Statistical Computing, Vienna, Austria. Available at http://www.R-project.org. Sansone,S.A. et al. (2007) The metabolomics standards initiative. Nat. Biotechnol., 25, 846–848. Williams,T. et al. (1993) ‘gnuplot’. Available at http://www.gnuplot.info Wishart,D.S. et al. (2009) HMDB: the Human Metabolome Database. Nucleic Acids Res., 35, D521–D526.
Downloaded from bioinformatics.oxfordjournals.org at National University of Singapore on October 26, 2010
Metabolic perturbation studies involve understanding effects of variation in a statistically robust fashion. This software is created with the vision of biologists for data analysis and interpretation. MetDAT platform simplifies and standardizes data analysis for usage with minimal training. MetDAT provides data processing and analysis, database search for metabolite identification, pathway mapping and a rich palette of visualization tools. The combination of data management and customizable workflow makes data analysis faster thereby saving researchers time.
2640
[18:24 20/9/2010 Bioinformatics-btq436.tex]
Page: 2640
2639–2640