BIOINFORMATICS APPLICATIONS NOTE Data and text mining
Vol. 30 no. 16 2014, pages 2379–2380 doi:10.1093/bioinformatics/btu203
Advance Access publication April 20, 2014
MRMPROBS suite for metabolomics using large-scale MRM assays Hiroshi Tsugawa1,2,*, Mitsuhiro Kanazawa3, Atsushi Ogiwara3 and Masanori Arita1,4 1
RIKEN Center for Sustainable Resource Science, Tsurumi-ku, Yokohama, Kanagawa 230-0045, Japan 2Department of Biotechnology, Graduate School of Engineering, Osaka University, Suita, Osaka 565-0871, Japan 3Reifycs Incorporated, 1-6-12 Nishishinbashi, Minato-ku, Tokyo 105-0003, Japan and 4National Institute of Genetics, Mishima, Shizuoka 4118540, Japan
Associate Editor: Jonathan Wren
ABSTRACT Summary: We developed new software environment for the metabolome analysis of large-scale multiple reaction monitoring (MRM) assays. It supports the data format of four major mass spectrometer vendors and mzML common data format. This program provides a process pipeline from the raw-format import to high-dimensional statistical analyses. The novel aspect is graphical user interface-based visualization to perform peak quantification, to interpolate missing values and to normalize peaks interactively based on quality control samples. Together with the software platform, the MRM standard library of 301 metabolites with 775 transitions is also available, which contributes to the reliable peak identification by using retention time and ion abundances. Availability and implementation: MRMPROBS is available for Windows OS under the creative-commons by-attribution license at http://prime.psc.riken.jp. Contact:
[email protected] Supplementary information: Supplementary data are available at Bioinformatics online. Received on February 21, 2014; revised on April 2, 2014; accepted on April 13, 2014
1 INTRODUCTION Many metabolomics studies rely on the ‘large-scale’ multiple reaction monitoring (MRM) assay. Wide-targeted analysis is an example; 41000 MRM transitions (precursor–product ion pairs) are monitored per single run using high-end machines. For MRM assays, we previously reported an objective strategy for metabolite identification from large-scale chromatographic data (Tsugawa et al., 2013). This report highlights its recent features, especially new algorithms for peak detection, normalization, and their new graphical user interfaces (GUIs). Peak quantification is the most important and sensitive process during MRM assays. There is no inherent universal algorithm that can perfectly recognize peak edges because they depend on chromatographic conditions; each research group has its own criteria for recognition (Sugimoto et al., 2012). For the accurate detection of peak-left and peak-right edges, in practice, multiple chromatograms must be checked and compared using a visualization tool. This process is also necessary to avoid misidentifications. For this purpose, we developed an interactive chromatogram viewer that *To whom correspondence should be addressed.
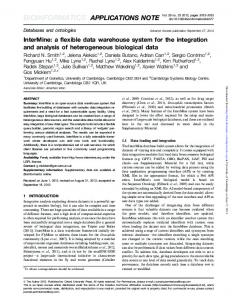
can overlay multiple chromatograms in each window to visualize our peak detection algorithm (Fig. 1). Moreover, it can interpolate missing values (Supplementary Information), and it can adjust signal changes or metabolite-dependent drifts using locally weighted least-square regression (locally estimated smoothing function, LOESS) and cubic spline with quality control (QC) samples. Together with these features, standard MRM measurements were made available on the PRIMe (Platform for RIKEN Metabolomics) Web site (http://prime.psc.riken.jp) for 301 metabolites (755 transitions); their precursor–product ion pairs, retention time and ion abundances are provided. The retention time and ion abundances are particularly useful for the accurate identification of metabolites because these features are comparable across certain instrument types (Kind et al., 2013) as long as the experimental conditions are similar. The algorithmic highlights are introduced below.
2
PEAK DETECTION AND VISUALIZATION
The peak detection algorithm is fully refurbished. On scanning a given chromatogram, three median values are computed to evaluate noise: AF for the amplitude, FF for the first-order derivative and SF for the second-order derivative. The scan detects the maximum amplitude differences between two adjacent points and the maxima of the first- and second-order derivatives at each point. The derivatives are calculated by using the five-point cubic SavitzkyGolay filter (Savitzky et al., 1964). Only values below 5% of the maximum are applied to compute their medians, i.e. AF, FF and SF. When a computed median is near zero, 0.0001 is used instead. Peaks are detected by their AF, FF and SF. The left edge is recognized when the amplitude and the first-order derivative both exceed AF and FF in two adjacent points. To locate the edge more accurately, the local minimum of the adjacent five-point window is explored by back-tracking from the detected start position. The tip of the peak is recognized when the sign of the first-order derivative changes and the second-order derivative is less than SF. The right edge is recognized by the same criteria as the left edge. When ‘peak area’ is used for quantification, manual curation is necessary to adjust the peak edges. This manual process may be skipped if ‘peak height’ is used instead; however, visualization continues to be necessary for verification. The system can simultaneously display up to 15 MRM chromatograms from designated file sets or metabolites in each single window (Fig. 1).
ß The Author 2014. Published by Oxford University Press. All rights reserved. For Permissions, please e-mail:
[email protected]
Downloaded from https://academic.oup.com/bioinformatics/article-abstract/30/16/2379/2748170 by guest on 27 August 2018
2379
H.Tsugawa et al.
Fig. 1. Screenshot of the MRMPROBS chromatogram viewer. A user can tune the peak edge through this GUI
This drawing style facilitates the speedy checking of the peakpicking results and the curation of the peak-left and peak-right edges. It also helps to locate misidentification.
3
QC SAMPLE-BASED NORMALIZATION
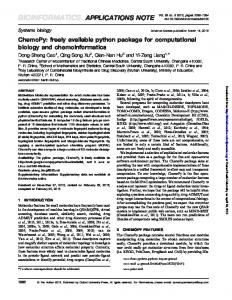
In long-term studies, a QC sample, or the standard, is necessary for normalizing the signal intensity. A mixture of all subject samples can serve this purpose (Dunn et al., 2011). Our software uses the LOESS and the cubic spline for normalization. In our program, measurement data are iteratively fit to the preselected standard by the LOESS of the second-degree least-squares with a robust tri-cubic weight function (Cleveland et al., 1979). After the fit, a correction curve for the whole analytical run is interpolated by the cubic spline. Lastly, the entire dataset is aligned to the spline result. This procedure adjusts the attenuation of the peak response over an analytical run (Fig. 2).
4
DATA IMPORT AND EXPORT
As in our previous work (Tsugawa et al., 2013), we used a common file format (ABF format; Reifycs Inc.) for rapid data retrieval for efficient data access to MRM data. To convert MRM raw data files to the ABF format, the file-format converter supports four vendor formats with the data suffixes (.D) for Agilent Technologies, (.LCD) for Shimadzu, (.Wiff) for AB SCIEX and (.Raw) for Thermo Fisher Scientific. The converter is independently and freely available at http://www.reifycs.com/ english/AbfConverter/. License information is available on the same page. In addition, our program supports the mzML data format, which is used by open-source file translators such as ProteoWizard (Chambers et al. 2012). Through this software, data import from Waters (.Raw) became possible indirectly. As for the output, all results including data tables and statistical analyses such as principal component analysis (PCA) can be exported in tab-separated text and image formats (JPEG, PNG, BMP, TIFF and GIF) for PCA.
5
CONCLUSION AND DISCUSSION
We created a suite of GUI for our MRMPROBS program to deal with the entire process pipeline from data import to statistical analysis. The platform, originally developed for metabolomics, can be applied to lipidomics and proteomics studies. Its advantage is efficient, on-demand visualization, yielding more
Fig. 2. The normalization results by (a) divided by an internal standard compound, and (b) an internal standard and the LOESS/cubic spline. The QC variables of Fig. 2a (left) are gradually increasing along the analytical run. On the other hand, Fig. 2b (right) shows the flat profile, meaning that the program successfully corrects the amplitude drift. Data are taken from our previous report on S.cerevisiae (Tsugawa et al., 2013)
objective quantification and identification of a large number of targeted metabolites. Application to our previous dataset on Saccharomyces cerevisiae (Tsugawa et al., 2013) yielded 152 metabolites successfully. Funding: JST, Strategic International Collaborative Research Program, SICORP for JP-US Metabolomics. H.T. and M.A. are supported by Grant-in-Aid for Young Scientists (B) 25871136 and MEXT 23310143, respectively. Conflicts of Interest: none declared.
REFERENCES Chambers,M.C. et al. (2012) A cross-platform toolkit for mass spectrometry and proteomics. Nat. Biotechnol., 30, 918–920. Cleveland,W.S. et al. (1979) Robust locally weighted regression and smoothing scatterplots. J. Am. Stat. Assoc., 74, 829–836. Dunn,W. et al. (2011) Procedures for large-scale metabolic profiling of serum and plasma using gas chromatography and liquid chromatography coupled to mass spectrometry. Nat. Protoc., 6, 1060–1083. Kind,T. et al. (2013) LipidBlast in silico tandem mass spectrometry database for lipid identification. Nat. Methods, 10, 755–758. Savitzky,A. et al. (1964) Smoothing and differential of data by simplified least squares procedures. Anal. Chem., 36, 1627–1639. Sugimoto,M. et al. (2012) Bioinformatics tools for mass spectroscopy-based metabolomic data processing and analysis. Curr. Bioinform., 7, 96–108. Tsugawa,H. et al. (2013) MRMPROBS: A data assessment and metabolite identification tool for large-scale multiple reaction monitoring based widely targeted metabolomics. Anal. Chem., 85, 5191–5199.
2380 Downloaded from https://academic.oup.com/bioinformatics/article-abstract/30/16/2379/2748170 by guest on 27 August 2018