Biophysical Controls on Soil Respiration in the Dominant Patch Types of an Old-Growth, Mixed-Conifer Forest Siyan Ma, Jiquan Chen, John R. Butnor, Malcolm North, EugCnie S. Euskirchen, and Brian Oakley Abstract: Little is known about biophysical controls on soil respiration in California's Sierra Nevada oldgrowth, mixed-conifer forests. Using portable and automated soil respiration sampling units, we measured soil respiration rate (SRR) in three dominant patch types: closed canopy (CC), ceanothus-dominated patches (CECO), and open canopy (OC). SRR varied significantly among the patch types, ranging from 2.0 to 4.5 pmol me2 s- and from 0.9 to 2.9 pmol m-2 s-' during the 1999 and 2000 measuring periods, respectively, with the maximum in CECO and the minimum in OC. Multiple peaks of seasonal SRR were functions of soil temperature and moisture dynamics. The relationship between SRR and soil temperature switched from a positive to a negative correlation when soil moisture dropped from saturation to drought. Time lag, as a function of soil moisture, was included in an exponential model to assess the effects of soil moisture on SRR in this seasonal water-stressed ecosystem. The total soil C flux summed by an area-weighted average across all three patch types was 660 2 163 g C m-2 from May to Oct. 2000. These results may be applicable to other water-stressed forests in the Mediterranean climate Lone, and have implications for the conservation of soil carbon. FOR.SCI. 5 1(3):221-232.
'
Key Words: Soil CO, efflux, soil temperature, soil moisture, Sierra Nevada, California.
S
C FLUX IS A CRITICAL COMPONENT of the terrestrial CO, cycle under changing climatic conditions. The terrestrial ecosystem releases 50-70 Pg C yr-' from the soil to the atmosphere, over 10 times the quantity of CO, released through combustion of fossil fuels (Raich and Schlesinger 1992). Although forests play an important role in C uptake through photosynthesis, they also release C via autotrophic and heterotrophic respiration (Singh and Gupta 1977, Raich and Schlesinger 1992). Soil respiration is related to many ecological processes, such as photosynthesis, root respiration, organic matter decomposition, and microbial activity (Splrensen 1974, Bunnell et al. 1977, Orchard and Cook 1983, O'Connell 1990, Ryan et al. 1996, Mallik and Hu 1997, Lomander et al. 1998, Hart and Sollins 1998, Hogberg et al. 2001). These processes are interrelated and affected by multiple biophysical factors in an ecosystem. Soil respiration is also associated with physical CO, diffusion processes affected by physical properties of soil and litter. Interpretation and prediction of soil respiration depends strongly upon ecosystem type, and it is difficult to apply one model consistently across a variety of ecosystems. For example, the Q,,, model has been used in several OIL
ecosystem models, but the Q , , value is not necessarily a constant (Rustad et al. 2001, Xu and Qi 2001, Janssens and Pilegaard 2003) and can bias soil respiration estimation. Numerous efforts have been made to understand the mechanisms behind the fluctuation of soil respiration and develop empirical models to predict soil respiration from biophysical factors, such as soil temperature and moisture (Singh and Gupta 1977, Schlentner and Van Cleve 1985, Gordon et al. 1987, Zimov et al. 1993, Pajari 1995, Simmons et al. 1996, Billings et al. 1998, Davidson et al. 1998, Lomander et al. 1998, Russell and Voroney 1998, Law et al. 2000, Maier and Kress 2000, Xu and Qi 2001, Liu et al. 2002, Euskirchen et al. 2003). Although a positive relationship has been reported between soil respiration and temperature at Inany sites (Lloyd and Taylor 1994), the relationship can be very weak or even negative when soil moisture is limited (Bunnell et al. 1977, Xu and Qi 2001). Such negative correlations between soil respiration and soil temperature have been observed in Mediterranean climate zones (Wildung et al. 1975, Carlyle and Ba Than 1988, Luo et al. 1996, Wang et al. 1999, Casals et al. 2000, Ma el al. 2004). A key question is what are the mechanisms that
Siyan Ma, Ecosystem Science Division, ESPM, 151 Hilgard Hall, University of California at Berkeley, Berkeley, CA 94720-31 10-Phone: (510) 642-2421; Fax: (510) 543-5098;
[email protected])'.edu. Jiquan Chen. Department of Earth, Ecological. and Environmental Sciences, Utiiversity of Toledo, 2801 West Bancroft Street, Toledo, OH
[email protected]. John R. Butttor, USDA Forest Service. Southern Research Station, 3041 Cornwallis Road. Research Triangle Park, NC
[email protected](i.us. Malcolm North, Sierra Nevada Research Center, Department of Environmental Horticulture, University of California at Davis, Davis, CA
[email protected]. EugCnie S. Euskirchen. Institute of Arctic Biology, University of Alaska Brian Oakley, College of Forest Resources, University of Washington, Seattle, WA 98195Fairbanks, Fairbanks, AK
[email protected]. boakley @u.wnshington.edu. Acknowledgements: We tltarlk Rhonda Roberts, Eric I-Iuber, Nathan Williamson, J i n ~I~lnes,Lee Swoger. Martin Oliver, and Rui Zhou who helped with ntaintaining instruments and collecting field data. We appreciate Soung-Ryoul Ryu and Arity Concilio for providing their unpublished root biomass data. We gratefully thank the anonyrnous reviewers and associate editor for their constructive comnients. The USDA Forest Service, Pacific Southwest Research Station and Mcintire-Stennis funds at Michigan Technological University provided firtancia1 support for the project. The USDA Forest Seivice, Southern Research Station provided the Autortlatic Carbon Efflux Systein (ACES) unit. Manuscript rece~vedJune 23, 2003, accepted September 14, 2004.
Copyrtght 0 2005 by the Soclety of Aiilerican Foresters
determine this inverse relationship? Examining specific biophysical controls on soil respiration in these ecosystems is needed to address this question. Unlike many temperate forests, California's Sierra Nevada mixed-conifer forest has readily delineated patches with distinct microclimate, soil, and vegetation characteristics. The forest experiences a typical Mediterranean climate of hot, dry summers and cold, wet winters. The summer drought conditions constrict aboveground and belowground processes (Schimel et al. 1999, Law et al. 2000, Royce et al. 2001a and b, Chen et al. 2002). Recent research has emphasized the significant influence of carbon assimilation on soil respiration and the importance of vegetation conditions in understanding soil respiration patterns (Hijgberg et al. 2001, Giardina and Ryan 2002, Giardina et al. 2003), but the combination of temperature and soil moisture in seasons may profoundly influence not only the aboveground but also belowground processes. We conducted this research in the heterogeneous mixed-conifer forest to gain more complete understanding of the vegetation distribution and biophysical controls on soil respiration, and to develop empirical models for estimating soil respiration that might be applied to other water-stressed ecosystems. Specifically, the objectives of this study were to (1) examine the differences of soil respiration between dominant patch types; (2) investigate temporal variations in soil respiration and its relationship to soil temperature and moisture; and (3) estimate annual soil carbon efflux using empirical models based on field measurements.
Methods Study Site Our study was conducted in the Teakettle Experimental Forest (TEF, 36'58' N, 119'2' W) located at 1,880-2,485 m elevation in the Sierra National Forest, California. The average annual precipitation at the TEF is 1,250 mm, but most of it falls during intense winter snowstorms between Nov. and Apr. The depth of the winter snowpack is an important factor influencing the soil water conditions of the forest during the following summer. The mean air temperature in July is 14.5" C, whereas the mean air temperature in Jan. is 1 .O0C. Soils are generally Xerumbrepts and Xeropsamments typical of southwestern slopes of the Sierra Nevada. The granite-based soils have a coarse sandy loam texture throughout the relatively shallow profile (75-100 cm), with -18-2096 volume soil water-holding capacity. Soil bulk density at 20-25 cm depth is 1.09 g cm-'. Duff and litter comprise 90.5% of soil cover, bare soil 5.8%, and large woody debris 3.7%. Organic matter content within the 0-10-cm depth of the mineral soil is 6.4% (North et al. 2002 and references therein). In the TEF old-growth mixed-conifer forest, the major conifer species include white fir (Abies concolor), wgar pine (Piitus lanzbertiana), incense cedar (Calocedrus decurrens), Jeffrey pine (Pinus jeffreyi), and red fir (Abies magnificu). The mixed-conifer forest is a matrix of tree clusters punctuated with gaps averaging 5-20 m in diameter. Gaps 222
Forc~stScience 5113) 200.7
are occupied by bare ground and several shrubs, particularly Ceanothus cordulatus. Previous research at TEF investigated the percent cover of vegetation, canopy cover, coarse woody debris (CWD, >lo-cm diameter), bare ground, and rock at 402 grid-sampling points. At each point, vegetation cover (including herbs, shrubs, and seedlings) was visually estimated after calibration with a standard cover size, i.e., one sheet of regular paper = 1.5% cover of 10-m2 plots. Canopy cover was measured using a moosehorn (a funnel with a bubble level, a 30" angle of view off vertical, and a transparent grid with 100 intersections affixed over the top of the funnel). Litter depth (cm) was also measured by averaging three separate measurements from the top of the organic layer to the mineral soil. All the information was grouped with hierarchical clustering using Ward's method and a relative Euclidean distance measurement (McCune and Grace 2002). Pruning of the dendrogram to establish the optirnai nurnber of clusters was done using Indicator Species Analysis (Dufrene and Legendre 1997). Three patch types were classified, including closed canopy tree groups (CC), patches of whitehorn ceanothus (Ceunothus cordulatus) (CECO), and open canopy (OC). The CC, CECO, and OC occupy 67.7, 13.4, and 4.7% of the entire forest, respectively, with most of the remainder composed of exposed granite (North et al. 2002).
Soil Respiration Measurements Soil respiration rates (SRR, pmol m-' s-I) were measured using an EGM-2 Environmental Gas Monitor equipped with a SRC-I Soil Respiration Chamber (PP Systems, Hitchin, Herts, UK) and an automatic soil-respiration measuring system, the Automatic Carbon Efflux System (ACES, US patent no. 6,692,970, Butnor 1999, Butnor et al. 2003). Both systems were used to measure SRR from dynamic chambers and analyzed CO, concentration with the same model of infrared gas analyler (EGM-2 Environmental Gas Monitor, PP Systems). However, the two systems used different chamber designs and measurement techniques. The PP Systems SRC-I has a tendency to overestimate SRR on sites that have soil (or litter) with high air content or porosity, whereas the ACES has an integrated calibration that is accurate regardless of soil or litter condition (Le Dantec et al. 1999). We took parallel measurements using these two units and established a linear equation (SRR,,, , = 0.467 SRRSKC-lmc d ,, red + 0.123, R, = 0.91) to correct the PP systems SRC-I biases. The two sets of EGM-2 infrared gas analyzers were calibrated using a standard CO, gas (700.1 ppm) under actual air pressure once a week. The SRC-I uses a smaller chamber (78.5 cm') with a "closed" gas-sampling design. It is portable and therefore was used to measure SRR rapidly over an extensive area. We used an SRC-I unit and measured daytime (is., between 0900 and 1600 local hours) soil respiration once a week during June-Aug. 1999 and once another week or once a month during May-Oct. 2000. In 1999, we randomly selected six replications from each of the three patch types.
In 2000, we increased the total sample size from 18 to 64, and expanded the sample area. The replications for CC, CECO, and OC were 27, 20, and 17, respectively. At each sampling point, four 10-cm diameter PVC collars were installed several days before taking SRR measurements to allow for settling. Air pressure was measured with a pocket barometer to correct the original field data using companyrecommended equations (PP Systems EGM-2 manual 1997). The ACES uses larger steady-state soil chambers (490.8 cm2) with an "open" gas-sampling design, i.e., the chambers have pressure-equilibration ports and are always in direct communication with atmospheric pressure. The unit can be left in place for extended periods to detect subtle changes in SRR over time. In this study, the ACES chambers covered the sampling area during one sampling period, typically 2-3 days, and then the chambers were opened for maintenance purposes. If it rained, the chambers were moved to next-wet spots right after the rain. Fifteen chambers were connected to a central manifold and gas analyzer via flexible tubing (15.5 m) and were measured sequentially. Because it took 10 min for each chamber to come into equilibrium and complete a single measurement, nine measurements were taken at each of the fifteen chambers during a 24-hour cycle (i.e., with intervals of 2.667 h). When the chambers were not actively being sampled, they were continuously refreshed by an exhaust pump system. Multiple 12-V marine batteries were connected in parallel to power the ACES. The batteries were replaced and recharged every 3-4 days to assure steady power supplies. An ACES unit was located randomly at three areas from May 14 to June 12, from June 13 to June 30, and from July 1 to July 9. To measure the CO, concentration in the soil profile, we connected an aquarium air stone to a plastic tube and inserted it into the soil. The middle of the air stone was inserted to depths of 5, 10, and 20 cm from the surface, and the other end of the tube was connected to the EGM-2 "Gas In" connector. CO, concentration was recorded when the reading became stable. Because the flow rate of EGM-2 is low (-300 ml min I), we assumed that there was no significant influence on the CO, profile during a measuring period less than one minute. We placed a plastic cap on the top of the tube in the ground to prevent gas leaking through the tube. CO, concentrations were measured weekly at 18 sampling points.
Elzviroizmerztal Variable Measurements While measuring SRR, we simultaneously recorded soil temperature at 5-crn depth (T,,, "C) and volumetric soil moisture within the 0-15-cm depth (M,, %). For the SRC-I. T,i was lneasurcd using a digital thermometer (Taylor Digital MaxMin, Forestry Suppliers, Inc., Jackson, MS). T,, associated with ACES was measured using therlnocouple probes installed inside each chamber (Butnor 1999). A Time Domain Reflectometry unit (TDR, Model 6050XI Soil moisture Equipment Corporation, Santa Barbara, CA) was used to measure M, within 0-1 5-cm depth at
each of the SRR measuring locations for both systems (Gray and Spies 1995). Two 30-cm-long stainless steel rods were inserted into the mineral soil at a 30' angle to the surface to increase the sensitivity of TDR measurements in parallel. We performed a calibration function and calculated soil water volumetric content (O,, %) based on the TDR reading (At, ns): 8, = - 10.16 + 10.34 X At (Gray and Spies 1995). TDR measurements were taken from probes located within 10 c n ~of each ACES chamber once a week lhroughout the measuring period. The M, readings associated with ACES were converted to soil water volumetric content using a predefined function. Soil surface temperature (T,, "C) and soil water potential at 15-cm depth (SWP, kPa) were continuously measured using Model 257 Soil Moisture Sensors connected to a CRlO datalogger (Campbell Scientific, Inc. Logan, UT).
Data Analysis Analysis of variance (ANOVA) was used to test significant SRR differences among three dominant patch types within each of the sampling years (i.e., 1999 and 2000). We also used ANOVA to test the significant effects of canopy cover, CWD cover, eeanothus cover, and litter depth on soil respiration variation. These analyses were performed using the General Linear Model for unbalanced data sets (Cody and Smith 1997). We calculated Pearson correlation coefficients (r) between SRR and time-lagged T,, in a 24-h period. Linear regression analysis was applied to establish the exponential model between SRR and T,, coupling with M , and time lag in different patch types.
where cu and p are coefficients estimated by the general linear regression model. Lag, is the time lag between SRR and T,,, which is determined by M,. One unit of lag time is equivalent to 2.667 h associated with the ACES system design. Mean T,, for 2.667-h intervals was calculated from soil surface temperature (T,,, "C) based on the following linear regression models developed for our study site (T,, = 0.7741T,, + 3.15, R2 = 0.95). Soil water potential (SWP) was converted to M, based on an empirical soil-water characteristic curve established by regressing the paired M, and SWP data at the same sampling point in the field (M, = 7.9244 SWP-~""~, R2 = 0.94). Based on the model, SRR was estimated for each patch type, and then soil carbon flux for the entire forest was summarized from the weighted contribution of each patch type to the total area. All analyses were performed with SAS (VX.0, SAS Institute Inc., Cary, NC) with a significance level of 0.05.
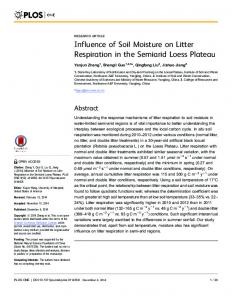
Results SRR in the Three Patch Types The mean SRR using the SRC-I unit was significantly different among the three patch types (F = 35.17, P < 0.0001), ranging from 2.0 to 4.5 pmol m-, s p l and from
0.9 to 2.9 pmol m-* s-' during June-Aug. 1999 and May-0ct. 2000, respectively. Mean SRR in CECO was the highest in the three patch types, whereas mean SRR in OC was the lowest (Figure 1). SRR increased with an increase in canopy cover (Figure 2a). SRR was positively correlated with increases in CECO cover 580%, but decreased with CECO cover >80% (Figure 2b). The maximum SRR occurred at 20% CWD cover, whereas the minimum occurred at sample points with (20% or >60% CWD cover (Figure 2c). SRR increased with increases in litter depth up to 10 cm (Figure 2d). Canopy and CWD cover were not significantly associated with SRR variation, whereas litter depth and CECO cover were significant (Table I).
enced by M,, because M , was influenced by precipitation events and varied at a relatively larger temporal scale. The seasonal patterns of SRR were also associated with seasonal changes in T,,, M,, and CO, concentration in the top 0-20 cm of the mineral soil (Figure 4, a-d). Although a high T,, and M , were recorded on day 167, peak SRR on day 179 was recorded. This peak was followed by a sharp decrease in SRR as T,, and M , continued to decrease. Around day 250, M , increased to 8% while temperature dropped, but there was no SRR response to these changes. At the end of the dry summer, M , declined to -5%. CO, concentration fluctuated in the soil profile over time, and the patterns matched changes measured on the soil surface.
Changes over time
Empirical Models
SRR fluctuated over time and responded to changes of soil temperature and moisture. Temporal SRR patterns, measured with the ACES unit, appeared to be more dynamic in the CC and CECO patch types than in the OC patch type during the 29-day period from May 14 to June 12 in 2000 (Figure 3, a-c). Temporal SRR patterns in the CC and CECO patches followed changes in T,, measured at the same time but were confounded by changes in SWP (Figure 3d). Low SRR between days 135 and 142 was coupled with low T,, (slightly above 0" C), which was likely related to a snowstorm (1 2-31 cm deep) on May 15, 2000 (day 135). However, SRR was low between days 156 and 160 while T,, was high, and high SRR was measured while T,, was low after day 160. A significantly elevated SWP resulted from the precipitation on day 156. The responses of SRR to the change of T,, varied before and after the rain event. SRR had clear diurnal patterns in the three patch types, and these patterns varied greatly throughout the season (Figure 3, a-c). During the measurement period, the greatest daily range of SRR generally occurred in CECO. Compared to CC and CECO, OC had the smallest range in daily pattern, but this was coupled with the largest daily temperature range. The diurnal pattern did not appear to be influ-
Seasonally, the relationship between SRR and temperature switched from positive to negative, and changes in M , were associated with changes in the degree and direction of the correlation (Figure 5). SRR was positively correlated to T,, when M, was higher than 10% (Figure 5a) in all three patch types, with an R* value of 0.79, 0.43, 0.48 in the OC, CC, and CECO patches, respectively. These positive relationships were weakened when M , decreased to 5-10% (Figure 5b) and were negative for the CC and CECO patch types when M , was 5 5 % (Figure 5c). The peaks in r values between SRR and time-lagged T,, indicate that SRR was positively correlated to the current T,, at any time of the day regardless of the patch type when soil moisture was high. When soil became dry, SRR was negatively correlated to current T,, but positively correlated to the temperature that occurred 5-1 0 h before SRR measurements (Figure 6). On the basis of this finding, we modeled SRR changes to T,, time-lagged by three M , levels. The confounding variance of patch type, T,,, and M , accounted for 52-91 % of the SRR variation (Table 2). The empirical model estimated that cumulative SRR was 372,s 19, and 7 16 g C m- * in OC, CC, and CECO, respectively, during the measuring period from May to Oct. 2000. Using these cumulative SRRs and the percent cover of each patch type, we calculated the 163 g C m-, beweighted average soil C flux as 660 tween May and Oct. 2000 in this mixed-conifer forest.
+
Discussion
Figure 1. Means and standard deviations of soil respiration rate (SlZK) in three dominant patch types of mixed-conifer forest: open canopy (OC), canopy cover (CC), and ceanothus shrub (CECO) during (left) June-Aug. 1999 and (right) May-Oct. 2000.
The finding that soil respiration is significantly difrerent among patch types supports other research suggesting the importance of vegetation, roots, and microbial communities in understanding variable soil respiration patterns within heterogeneous forests (Buchmann 2000, Raich and Tufekcioglu 2000). Patch type may explain the differences in soil rcspiration from three perspectives: root respiration, rhizospheric microbial respiration, and frce-living microbial respiration (Kelting et al. 1998). Hanson et al. (2000) concluded that the amount that root respiration contributes to total soil respiration depends on ecosystem type and seasonal pattern. In the TEF, fine-root biomass is greater in CC than in CECO and OC within the top I0 cm of soil. Higher
0.0 0
20
40
60
80
100
Canopy (%)
0
40
20
60
CWD (%)
80
CECO (%)
100
0
5
10
15
Litter Depth (em)
Figure 2. Change in soil respiration rate (SRR) with change in canopy cover, ceanothus shrub cover (CECO), coarse woody debris cover (CWD), and litter depth. Black dots are mean values, and the error bars indicate standard errors. Table 1. Results of an ANOVA test of the significance of canopy, coarse woody debris (CWD), ceanothus (CECO) cover, and litter depth on soil respiration variation.
Source
DF*
SS'
MS*
' "F
Model Canopy CWD CECO Litter Depth
24 8 4 6 5 25 49
62.895 8.616 1.513 15.186 12.325 17.089 79.984
2.621 1.077 0.378 2.531 2.465 0.684
3.83 1.58 0.55 3.70 3.61
Error Total
* Degrees of
0.001 0.183 0.698 0.009 0.014
freedom
' Sum of square Mean sum of square
;
9staristics "robability
> F value
sol1 respirdtion in cc may result from greater fine-root biomass than in OC. OC patches have kw fine roots, and heterotrophic respiration from the mineral soil is low (Kelting et al. 1998). Nevertheless, root biomass does not account for all the patterns we measured. The highest SRR in CECO may be the result of the presence of the symbiont Fmnkia spp., a type of N-fixing actinomycete that
provides high nitrogen availability in the ceanothus r h i ~ o sphere (Oakley et al. 2003). Symbiotic and free-living microbes in the rhizosphere likely play an important role in SRR in CECO. Unfortunately, there is no data for directly comparing the physiological processes and seasonal dynamics between trees and shrubs, but tree growth has been shown to significantly slow during the summer drought in the Sierra Nevada (Royce and Barbour 2001b). Consequently, root respiration may contribute relatively less to soil respiration than heterotrophic respiration during the water-stress season (Hanson et al. 2000). Water stress would limit photosynthesis and reduce current carbon assimilation, resulting in a decrease in living root respiration (Hogberg et al. 2001, Shah and Paulsen 2001). The significant association between SRR and litter depth and CECO cover implies that heterotrophic respiration may become relatively more important than root respiration during the dry season. Soil respiration generally increased with increases in litter depth (Figure 2d), suggesting that aboveground productivity influenced soil respiration (Euskirchen et al. 2003). Further studies are needed to understand the decrease in SRR asrociated with litter deeper than 10 cm. We also noticed that the relationship between CWD and SRR was nearly parabolic, Forest S c i ~ n r e51j.5') 2005
225
Day of Year Figure 3. Changes in soil respiration rate (SRR, dark lines), soil temperature at 5-cm depth (T,,), and soil water potential (SWP) in three patch types: (a) canopy cover (CC), (h) ceanothus shrub (CECO), and (c) open canopy (OC) from May 14 to July 12,2000.
perhaps indicating that microbial community structure, the biomass, or activities are different in different substrate natures of litter and CWD (Bunnell et al. 1977). Belowground processes, such as decomposition of the litter and organic matter, are critical to future investigations of SRR in water-stressed ecosystems.
We organi~edour data from the biophysical perspective, but the diurnal and seasonal patterns of soil respiration reflect changes in the related ecological processes and their interactions with the biophysical environment. In mesic ecosystems, soil respiration usually reaches its maximum between noon and late afternoon, and the minimum occurs
-----------
cc CECO, OC j
Figure 4. Seasonal changes in (a) soil respiration rate (SRR), (b) soil temperature at 5-cm depth (T,,), (c) soil moisture (M,), and (d) CO, concentration (ppm) within 0-20 soil depth in three dominant patch types: close canopy (CC), ceanothus shrub (CECO), and open canopy (OC) during May-Oct., 2000.
between midnight and early morning (Singh and Gupta 1977 and references therein). In thcse ecosystems, soil respiration is clearly regulated by the diurnal patterns of photosynthesis. However, in water-stressed ecosystems, the diurnal patterns of soil respiration appear to be different. We graphed Figure 5 using time of day on the horizontal axis and found that the maximum rate of soil respiration occurred at night, whereas the minimum occurred between noon and late afternoon. Microbial respiration involves physiological and biochemical processes, which differ from those associated with root respiration. Because microbes have different sensitivity to changes in the biophysical environment (Boone et al. 1998), these unusual diurnal patterns reinforce the notion that heterotrophic respiration may be more important than root respiration when soil
moisture limits photosynthesis (Singh and Gupta 1977 and references therein). Thus, soil moisture is a critical biophysical factor controlling the magnitude and pattern of soil respiration in water-stressed ecosystems. In this study, the seasonal patterns of soil respiration differ from the bell-shaped seasonal pattern reported in temperate and boreal forests, where soil water does not limit plant physiological processes during the growing season (Schlentner and Van Cleve 1985, Gordon et al. 1987, Zimov et al. 1993, Pajari 1995, Simmons et al. 1996, Billings et al. 1998, Davidson et al. 1998, Russell and Voroney 1998, Maier and Kress 2000). In our study site, high soil moisture usually occurs during the period immediately after snowmelt (early May) and ends at the beginning of the summer drought (the end of June). During this "wet" season, air temperature increases to over loo C, and rapid vegetation growth is associated with relatively high temperature and moisture availability (Royce and Barbour 2001b). During this period, soil respiration reaches its seasonal peak and may be largely governed by the vegetation community. After the snowmelt, soil moisture dramatically declines and quickly reaches a point where plant physiological processes become stressed, resulting in decreased root respiration (Hogberg et al. 2001, Shah and Paulsen 2003). At times when soil moisture may be too low to be used by plants, there may still be sufficient moisture for microbial communities, because microbes respond differently to changing biophysical environments (Boone et al. 1998). Therefore, soil respiration is more driven by microbial respiration and remains relatively stable (Giardina and Ryan 2000). Soil respiration is also related to a physical process, CO, diffusion, especially when rain events occur (Cook et al. 1998, Bouma and Bryla 2000). High CO, concentration in the soil profile generally indicates high soil respiration rates. However, the current chamber technique may not be able to detect the actual increase in soil profile. For example, we notice that SRR immediately decreases after the rain regardless of soil temperature, gradually returning to its prerain level, and occasionally remaining elevated, perhaps because of the reduction of CO, diffusion-the blocking effect of rain event (Figure 3 and 4). Bouma and Bryla (2000) reported that soil CO, concentration increased after imgation, but CO, eftlux on the soil surface decreased. This finding suggests that CO, may not be released to the air from the soil surface immediately despite high belowground CO, concentrations from moisture-driven root and microbial respiration. Thus, soil CO, profile measurement is more proper to examine the biological processes under the ground. In contrast, 0, is necessary for the respiration process of roots, many microbes, and soil fauna. As soil water content increases, soil aeration and 0, availability decreases, and soil respiration decreases (Vor et al. 2003). With high soil moisture, elevated CO, production from root and microorganisms can produce a high concentration of CO, in the soil, which can reduce root and microbial activity accordingly. In turn, SRR after a lasting rain cvent may be greatly reduced. The blocking effect related to rainfall in arid ecosystems may involve several key soil processes that
---
CECO
OC I
Figure 5. The relationship between soil respiration (SRR) and soil temperature at 5-cm depth (T,,) under three soil moisture (M,) conditions: (a) M, > lo%, (h) 5% < M, = lo%, and (c) M, = 5% in three patch types: canopy cover (CC), ceanothus shrub (CECO), and open canopy (OC). The least-square smoothed lines show the change in the relationships from positive to negative. Table 2. Discrete models relating soil temperature at 5-cm depth (T,,, "C) and at three soil moisture (M,, 70) levels to predict soil respiration rate (SRR, pmol m-2 s-')
Patch Model SRR = aeK5(la,o,)
M,
Type
a
p
Lag,
R'
P>F
n
2 10.0
CC CECO OC CC CECO OC CC CECO OC
3.109 3.723 0.531 3.774 2.271 1.882 2.076 2.039 1.050
0.059
0
0.91