L. Klüser[1,2], K. Schepanski[3,4], Thomas Holzer-Popp[1]. [1] German Aerospace Center .... cloud-free by APOLLO for dust detection. Night-time clouds are ...
Bitemporal Mineral Dust Detection from MSG-SEVIRI Observations L. Klüser[1,2], K. Schepanski[3,4], Thomas Holzer-Popp[1] [1]
German Aerospace Center (DLR), German Remote Sensing Data Center (DFD), Weßling, Germany [2] University of Augsburg, Institute of Physics, Augsburg, Germany [3] Leibniz Institute of Tropospheric Research (IfT), Leipzig, Germany [4] Leibniz-Institute of Marine Sciences (IFM-GEOMAR) Kiel, Germany Abstract Many processes have been suggested by which transported mineral dust interacts with different components of the climate system (e.g. radiation balance, atmospheric stability, convective clouds, wind direction and speed). Thus satellite monitoring of mineral dust activation and transport is needed to observe and quantify the impact of mineral dust on several components of the climate system. Remote sensing of mineral dust in the atmosphere mostly relies on measurements of reflected solar radiation and thus is often limited to regions with dark surfaces. Over vegetated or generally dark surfaces many methods are available to derive mineral dust optical depth from remote sensing data of polar orbiting or geostationary satellites. But in most cases these methods fail over bright surfaces as they are common in the desert regions, e.g. in the Sahara. Thus infrared measurements have to be used to derive dust information also over desert surfaces. The presented new method for the detection and analysis of mineral dust over (cloud-free) land combines day- and night-time data from two infrared channels of Meteosat Second Generation (MSG). The Bitemporal Mineral Dust Index (BMDI) uses brightness temperature differences between the 10.8μm and 12.0μm channels at day- and at night-time (03 UTC and 12 UTC respectively) together with the difference in 10.8μm brightness temperature between day and night. As mineral dust is quite absorptive in the 10.8μm region and less in the 12.0μm region, the use of brightness temperature differences between those bands is rather common to detect mineral dust from infrared measurements. MSG offers measurements in both wavelength bands from a geostationary orbit, thus the combination of day- and nighttime observations to a bi-temporal dust index becomes possible. Thus a dust mask over land for further applications can be derived together with the dust index by applying additional threshold tests. Comparisons of one year of BMDI observations with Aerosol Robotic NETwork (AERONET) aerosol optical depth (AOD), MODerate resolution Imaging Spectroradiometer (MODIS) “Deep Blue” AOD and Ozone Monitoring Instrument (OMI) Absorbing Aerosol Index (AI) show good results in the ability to detect airborne dust and also estimate the dust load to some degree with the BMDI. 1 Introduction Operational aerosol optical depth (AOD) products from geostationary satellites are mainly derived over dark surfaces like oceans or vegetated areas (King et al., 1999). Additionally there are some strategies to derive mineral dust load over deserts from thermal infrared (IR) observations (e.g. Legrand et al., 2001; Li et al., 2007). Those IR dust detection strategies rely on comparisons of observed and estimated clearsky (dust-
and cloud-free) brightness temperatures. Estimation of the clearsky brightness temperatures is often based on observations of a dust-free brightness temperature from some days ago. Brooks and Legrand (2000) and Legrand et al. (2001) use the difference between METEOSAT IR brightness temperatures and the maximum of observed brightness temperatures of a 15 days period prior to the observation. This difference, the Infrared Difference Dust Index IDDI, is then regarded as an indicator of the atmospheric dust load. A similar approach is used in Li et al. (2007) for dust detection. Those authors use the brightness temperatures of one day manually classified as dustfree as an estimation of the clearsky values in a case study of the March 2004 dust storm. This approach is affected by variations in background conditions such as surface temperature and may easily produce misleading results. Especially surface temperatures are reduced in dust storm conditions (e.g. King et al., 1999), leading to an overestimation of mineral dust when assuming the higher clearsky brightness temperature being representative for surface conditions. The new method presented here for Meteosat Second Generation (MSG) IR dust detection makes use of the presence of two split window channels (Schmetz et al., 2002), which were not available on the first generation METEOSAT satellites used e.g. by Legrand et al. (2001). Furthermore the day-night contrast of IR observations is used for dust detection instead of assumptions of clearsky brightness temperatures. 2 The Bitemporal Mineral Dust Index The Bitemporal Mineral Dust Index BMDI is composed of day and night observations in two wavelength bands of the Spinning Enhanced Visible and InfraRed Imager (SEVIRI) on MSG (Klüser and Schepanksi, 2008). Day-time observations are acquired at 12:00 UTC and night-time observations are those from 03:00 UTC. Those timeslots are representative for times of maximum and minimum dust mobilisation in the Sahara. The wavelength band used for the BMDI are 10.8μm and 12.0μm. The presence of mineral dust in the atmosphere leads to stronger absorption in the 10.8μm band than at 12.0μm (Ackermann, 1997; Pierangelo et al., 2004). Thus the brightness temperature difference (BTD) between those observations,
BTD = T10.8 − T12.0
(1)
is very useful for dust detection (e.g. Sokolik, 2002; Pierangelo et al., 2004, Chaboureau, 2007; Li et al., 2007). In general, BTD values are reduced in the presence of airborne mineral dust. BTD is not only sensitive to mineral dust, but also to the atmospheric water vapour content (Schroedter-Homscheidt et al., 2008). The Water vapour effect on BTD works in an opposite direction to the dust effect, so that dust detection is enhanced in dry environments, while high humidity can reduce the dust effect to some extent (Chaboureau et al., 2007). Due to the subsidence of the atmospheric boundary layer, during night airborne dust load reaches its minimum while increasing in the morning hours (Schepanski et al., 2008). As the 11μm brightness temperature reduction by dust due to absorption and scattering is relative to the emitted radiation and thus to the temperature of the emitting surface, the brightness temperature reduction is lower during night than it is during day in terms of absolute values. This effect is increased by the reduction of surface insolation during day due to the solar optical depth of the dust, which leads to reduced surface temperatures and thus to reduced thermal emission (Brooks and Legrand, 2000). Additionally during night
the dust load is lower, as described above. Thus also the day to night contrast of 10.8μm brightness temperatures,
ΔT10.8 = T10.8 (day) − T10.8 (night)
(2)
can be used for dust detection, as well as the day to night contrast of BTD,
ΔBTD = BTD(day) − BTD(night)
(3)
Day-time cloud screening in the BMDI processing is achieved by the Avhhr Processing scheme Over Land, cLouds and Ocean (APOLLO), described in Kriebel et al. (2003). Due to the problems in distinguishing between cloud and aerosol in the “twilight zone” between them (Koren et al., 2007), an area of 3x3 pixels has to be identified to be cloud-free by APOLLO for dust detection. Night-time clouds are flagged out by additional threshold tests. Also viewing zenith angles Θv larger than 60° are not taken into account due to possible limb darkening effects (Minnis et al., 1991) on the dust detection. For pixels, which passed those restrictions, the BMDI is calculated by:
T10.8 ≥ 273K NAPOLLO = 0 BTD < 1K BTD < 0K Θ v < 60° (3x3 pixel) at 03 : 00 at 12 : 00, 03 : 00 at 12 : 00 3 1444444444444 424444444444444 BMDI = ΔBTD +
(4)
1 ΔT10.8 7
As airborne mineral dust reduces both, BTD and T10.8, and thus also ΔBTD and ΔT10.8 due to the generally lower dust load and lower surface temperatures during night, high dust load is represented by low BMDI values. The spectral absorptivity of dust depends also on chemical composition and dust partical size to some degree (e.g. Li et al., 2007), while the reduction of 11μm brightness temperatures is dependent on the height of the dust layer (Pierangelo et al., 2004). Thus it is assumed, that the BMDI values are the result not only of atmospheric dust load, but also of chemical composition, particle size and transportation layer height of the mineral dust. 3 Evaluation of the Bitemporal Mineral Dust Index (BMDI) BMDI -5K
0K
5K
10K
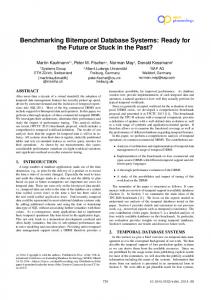
Fig. 1 EUMETSAT "dust" colour scheme RGB image of 08.03.2006, 12:00 (left) and corresponding BMDI image (right) for the Sahara domain
Figure 1 shows the March 2006 dust storm as seen by MSG. The left image is the EUMETSAT “dust” colour scheme RGB composite image, obtained by [R,G,B] = [T12.0-
T10.8, T10.8-T8.7,T10.8(inv)] for 08.03.2006, 12:00 UTC. The right image is the corresponding BMDI image of 08.03.2006. The patterns of dust storm activity in the Sahara as indicated by the RGB composite image are well represented by the BMDI (where not obscured by clouds at 03:00 or 12:00 UTC). If one is interested in temporal averages of dust load as indicated by BMDI, those averages are strongly biased in regions where strong dust outbreaks occur only sporadically, as e.g. in the Sahel domain (see e.g. the left side of fig. 2). Thus for averaging, missing values are replaced by the maximum possible BMDI value 10K, indicating dust-free conditions regardless of the reason for the missing BMDI value.
BMDI
= ∑t =1BMDI(t) n
⎧10K, BMDI =' missing value' BMDI(t) = ⎨ ⎩BMDI, BMDI valid
(5)
Fig.2 (right) shows the time-averaged BMDI for the year 2006 obtained by Eq.5, while Fig.2 (left) shows the corresponding temporal variance of BMDI values..
Fig. 2 Mean BMDI as determined from Eq.5 (left) and temporal variance of gridbox BMDI values (right) for the year 2006 in the Sahara domain.
The main source regions for mineral dust like the Bodélé depression and the Western Sahara domain (Schepanski et al., 2007; Schepanski et al., 2008) are well represented in those images (Klüser and Schepanski, 2008). Observations from eight stations of the AErosol RObotic NETwork AERONET (Holben et al., 1998) have been used to further evaluate the dust detection potential of the BMDI. The stations used for comparison are listed in Tab. 1 together with their height above sea level and the number of observation days available in 2006. Together they form a database of 1939 observations available for comparison with BMDI.
station Agoufou Banizoumbou Dakar Djougou DMN Maine Soroa IER Cinzana Niamey Solar Village
position 15.34°N / 1.48°W 13.54°N / 2.67°E 14.48°N / 16.96°W 9.76°N / 1.59°E 13.22°N / 12.02°E 13.28°N / 5.93°W 13.48°N / 2.17°E 24.91°N / 46.40°E
height a.s.l. 305m 250m 0m 400m 350m 285m 205 764m
days with observations 258 286 283 245 222 250 112 283
Tab. 1 List of used AERONET stations together with geographical positions, station heights and numbers of days with available AOD observations.
AERONET observations provide AOD at different wavelengths, from which Ångström exponents α can be derived by
AOD 0.44 ⎛ 0.87μ. ⎞ =⎜ ⎟ AOD 0.87 ⎝ 0.44μ. ⎠
α
(6)
AERONET AOD indicates the attenuation of sunlight by all kinds of aerosols suspended in the atmospheric path. Scenes with significant mineral dust contribution to AOD are selected by the dust filtering criterion originating from Dubovik et al. (2002) AOD 1.020 α
≥
0.1
< 0.6
(6)
as described in detail in Klüser and Schepanski (2008). Figure 3 shows AERONET AOD observations plotted against corresponding BMDI values. Symbol colours indicate Ångström exponent classes. The overall linear correlation between AERONET AOD and BMDI is r=0.796, a reasonable good value given the fact, that AERONET and BMDI observe different atmospheric columns, use different spectral regions and thus are sensitive to different species of aerosol.
Fig. 3 BMDI observations plotted against AERONET AOD. Symbol colours correspond to Ångström exponent classes.
Not only AERONET surface observations have been used to evaluate the BMDI, but also aerosol observations from other satellites. Two algorithms capable for the detection of mineral dust over deserts from reflected solar radiation are the “Deep Blue” algorithm for MODerate resolution Imaging Spectro-radiometer (MODIS) observations (Hsu et al., 2004) and the Absorbing Aerosol Index (AI) of Ozone Monitoring Instrument (OMI) observations (Torres et al., 1998). The corresponding satellites are Terra for MODIS and Aura for OMI. In contrast to “Deep Blue” AOD (Hsu et al., 2004), the OMI-AI is height dependent and sensitive to aerosols above heights of ca. 1.5km only (Herman et al., 1997; Torres et al., 1998). MODIS AOD has been mapped onto a 0.5° grid for comparison, while daily OMI-AI observations are distributed on an 1.0° grid.
Fig. 4 Spearman rank-correlations between BMDI and MODIS AOD (left) and between BMDI and OMI-AI (right)
Correlations between BMDI and MODIS AOD (left) and between BMDI and OMI-AI (right) are shown in fig. 4 for the Sahara domain. Correlation coefficients are Spearman rank correlations (Spearman, 1908), correlations with significance lower than 90% are treated as missing data values. Especially in the Southern part of the Sahara and the Sahel region as well as in the main dust source regions (Schepanski et al., 2008), magnitudes of anti-correlation are high, indicating a good agreement between BMDI and MODIS and, to a somewhat lower degree, between BMDI and OMI-AI. Correlation magnitudes are low or insignificant in mountainous terrain, indicating some problems in comparison between IR dust load estimates like BMDI and AOD observed from satellites (see Klüser and Schepanski, 2008) for details. 4 Conclusions From MSG IR observations, the presented new Bitemporal Mineral Dust Index BMDI can be used to detect airborne mineral dust also over bright areas like the Sahara desert. This dust index is also able to reflect atmospheric dust load, limited by an assumed sensitivity to particle size and dust layer height. In contrast to AOD products originating form observations of reflected solar radiation, the BMDI is not sensitive to smoke aerosols such as from biomass burning. As biomass burning aerosols are quite common in the Sub-Saharan dry seasons and often mix with dust outbreaks, BMDI observations can also be used to estimate the mineral dust load without contribution of other external mixed aerosols. One year of BMDI observations has been analysed with respect to the dust detection capabilities of the BMDI. Correlation of BMDI with AERONET observations is r=0.796, a
quite good result, given the different dependencies of AERONET AOD and BMDI. Dependencies of this correlation on viewing geometry or the deviation between local time and UTC have not been found. Comparisons of BMDI with MODIS “Deep Blue” AOD and OMI-AI show high magnitudes on anti-correlation in the Southern and Western part of the Sahara and also in northern Libya and over the Arabian Peninsula. Low significance levels of correlations occur along mountain sides and over elevated terrain in the Sahara domain, which are assumed mainly to be a result of different viewing geometries and cloud screening techniques as well of the different regions of the spectral radiation domain used for dust detection.
Acknowledgements We thank Naif Al-Abbadi, Bernadette Chatenet, Phillippe Goloub, Jean Louis Rajot, Didier Tanré and Rick Wagener and their staff for establishing and maintaining the eight AERONET sites used in this investigation and for providing the observation data. We acknowledge to the GES-DISC Interactive Online Visualization ANd aNalysis Infrastructure (Giovanni) as part of the NASA's Goddard Earth Science (GES) Data and Information Service Center (DISC) for the OMI AI data set. We thank the MODIS Atmosphere Discipline Group for providing MODIS aerosol data. We also acknowledge to the NASA's Goddard Space Flight Center's Level 1 and Atmosphere Archive and Distribution System (LAADS) for the online distribution of the MODIS data.
References Ackerman, S.A.: Remote sensing aerosol using satellite infrared observations, J. Geophys. Res.,102(D14), 17069-17079, 1997 Brooks, N., and Legrand, M.: Dust variability over northern Africa and rainfall in the Sahel, in: Linking Climate Change to Landsurface Change, edited by S. J. McLaren and D. Kniveton, Kluwer Acad., Dordecht, Netherlands, 1-25, 2000 Chaboureau, J.-P., Tulet, P. und Mari, C.: Diurnal cycle of dust and cirrus over West Africa as seen from Meteosat Second Generation satellite and a regional forecast model, Geophys. Res. Lett., 34, L02882, doi:10.1029/2006GL027771, 2007 Dubovik, O., Holben, B., Eck, T.F., Smirnov, A., Kaufman, Y.J., King, M.D., Tanré, D., and Slutsker, I.: Variability of absorption and optical properties of key aerosol types observed in worldwide locations, J. Atmos. Sci., 59, 590-608, 2002 Herman, J.R., Bhartia, P.K., Torres, O., Hsu, C., Seftor, C., and Celarier, E.: Global distribution of UV-absorbing aerosols from Nimbus 7 TOMS data, J. Geophys. Res., 102, D14, 1691116922, 1997 Holben, B. N., Eck, T.F., Slutsker, I., Tanré, D., Buis, J.P., Setzer, A., Vermote, E., Reagan, J.A., Kaufman, Y.J., Nakajima, T., Lavenu, F., Jankowiak, I., und Smirnov, A.: AERONET - A federated instrument network and data archive for aerosol characterization, Remote Sens. Environ., 66, 1-16, 1998 Hsu, N.C., Tsay, S.C., King, M.D., and Herman, J.R.: Aerosol Properties Over Bright-Reflecting Source Regions, IEEE T. Geosci. Remote, 42, 557-569, 2004 King, M.D., Kaufman, Y.J., Tanre, D., and Nakajima, T.: Remote Sensing of Tropospheric Aerosols from Space: Past, present and Future, Bull. Am. Meteorolog. Soc., 80, 11, 2229-2259, 1999 Klüser, L., and Schepanski, K.: Remote sensing of mineral dust with MSG infrared channels: A new Bitemporal Mineral Dust Index, submitted to Remote Sens. Environ., 2008 Koren, I., Remer, L.A., Kaufman, Y.J., Rudich, Y. und Martins, J.V.: On the twilight zone between clouds and aerosols, Geophys. Res. Lett., 34, L08805, doi:10.1029/2007GL029253, 2007
Kriebel, K.T., Gesell, G., Kästner, M. und Mannstein, H.: The cloud analysis tools APOLLO: improvements and validations, Int. J. Remote Sens., 24, 12, 2389-2408, 2003 Legrand, M., Plana-Fattori, A. und N'doume, C.: Satellite detection of dust using the IR imagery of Meteosat, 1. Infrared difference dust index, J. Geophys. Res, 106 (D16), 1825118274, 2001 Li, J., Zhang, P., Schmit, T.J., Schmetz, J. und Menzel, W.P.: Quantitative monitoring of a Saharan dust event with SEVIRI on Meteosat-8, Int. J. Remote Sens., 28, 10, 2181-2186, 2007 Minnis, P., Young, D.F. und Harrison, E.F.: Examination of the relationship between outgoing infrared window and total longwave fluxes using satellite data, J. Climate, 4, 1114-1133, 1991 Pierangelo, C., Chedin, A., Heiliette, S., Jacquinet-Husson, N., and Armante, R.: Dust altitude and infrared optical depth from AIRS, Atmos. Chem. Phys., 4, 1813-1822, 2004 Schepanski, K., Tegen, I., Laurent, B., Heinold, B. und Macke, A.: A new Saharan dust source activation frequency map derived from MSG-SEVIRI IR-channels, Geophys. Res. Lett., 34, L18803, doi:10.1029/2007GL030168, 2007 Schepanski, K., Tegen, I., Todd,M. C., Heinold, B. Bönisch, G., Laurent, B., and Macke, A.: Meteorological processes forcing Saharan dust emission inferred from MSG-SEVIRI observations of sub-daily dust source activation, submitted to J. Geophys. Res., 2008 Schmetz, J. P., Pili, P., Tjemkes, S., Just, D., Kerkmann, J., Rota, S., und Ratier, A.: An Introduction to Meteosat Second Generation (MSG), Bull. Am. Meteorolog. Soc., 83, 977-992, 2002 Schroedter-Homscheidt, M., Drews, A., and Heise, S.: Total water vapor column retrieval from MSG-SEVIRI split-window measurements exploiting the daily cycle of land surface temperatures, Remote Sens. Environ., 112, 249-258 Sokolik, I.N.: The spectral radiative signature of wind-blown mineral dust: Implications for remote sensing in the thermal IR region, Geophys. Res. Lett., 29, 2154, doi:10.1029/2002GLR015910, 2002 Spearman, C.: The Method of "Right and Wrong Cases" (Constant Stimuli) without Gauss' Formulae, Brit. J. Psychol., 2, 227-242, 2908 Torres, O., P. K. Bhartia, J. R. Herman, Z. Ahmad, and J. Gleason: Derivation of aerosol properties from a satellite measurements of backscattered ultraviolet radiation: Theoretical basis, J. Geophys. Res., 103, 17099-17110, 1998