with Chugai Pharmaceutical's ethical guidelines for .... of Chugai Pharmaceutical Co., Ltd., and Mr. Takashi ... Pharmaceutical Co, Ltd., for providing the bone.
J Bone Miner Metab (2003) 21:287–293 DOI 10.1007/s00774-003-0422-x
© Springer-Verlag 2003
Bone structure and mineralization demonstrated using synchrotron radiation computed tomography (SR-CT) in animal models: preliminary findings Masako Ito1, Sadakazu Ejiri2, Hiroshi Jinnai3, Jun Kono4, Satoshi Ikeda5, Akifumi Nishida1, Kentaro Uesugi6, Naoto Yagi6, Mikako Tanaka2, and Kuniaki Hayashi1 1
Department of Radiology, Nagasaki University School of Medicine, 1-7-1 Sakamoto, Nagasaki 852-8501, Japan Department of Tissue Regeneration and Reconstruction, Section for Oral Life Science, Niigata University Graduate School of Medical and Dental Science, Niigata, Japan 3 Department of Polymer Science and Engineering, Kyoto Institute of Technology, Kyoto, Japan 4 Division of Radiology, Nagasaki Saiseikai Hospital, Nagasaki, Japan 5 Department of Orthopaedic Surgery, University of Occupational and Environmental Health, Kitakyushu, Japan 6 SPring-8/Japan Synchrotron Radiation Research Institute (JASRI), Hyogo, Japan 2
Abstract We investigated the ability of synchrotron radiation computed tomography (SR-CT) to demonstrate trabecular microstructure, detail of trabecular surfaces, and mineralization of bones. Eight rat vertebrae, six rat tibiae, and eight minipig vertebrae were scanned using SR-CT at the synchrotron radiation facility Super Photon ring-8GeV (SPring-8). Images obtained using conventional micro-CT, scanning electron microscopy (SEM), and contact microradiography (CMR) were compared with the SR-CT images. SR-CT showed high image quality without visible partial volume effect. Three-dimensional SR-CT revealed shallow concavities in the bone surface, which were considered to correspond to osteoclastic resorption areas, as well as the connectivity, anisotropy, and shape (rod- or platelike) of trabeculae. Two-dimensional SR-CT showed different density along the surface of the trabecular bone, indicating the degree of bone mineralization. In conclusion, SR-CT seems to be a useful tool for delineating trabecular surfaces, evaluating bone mineralization, and revealing precise trabecular structure. Key words synchrotron radiation (SR) · computed tomography (CT) · osteoporosis · trabeculae · mineralization
Introduction Synchrotron radiation (SR) provides an intense, laserlike collimated light in the range from infrared to hard X-rays. The use of SR as an X-ray source for highresolution microtomography of small samples was first
Offprint requests to: M. Ito Received: November 18, 2002 / Accepted: February 17, 2003
suggested by Grodzins [1]. Unlike a conventional X-ray tube, SR offers a continuous energy spectrum with a high photon flux. The optimum energy for a given sample can be selected from the SR white beam with a low-energy bandwidth (0.1%–0.01%) using a crystal monochromator, at the same time keeping the photon flux rate high enough for efficient imaging. The monochromaticity of the beam is the key point because this is a basic requirement for tomographic reconstruction. This condition is not fulfilled with conventional polychromatic X-ray sources because beam-hardening artifacts in the reconstructed images are caused by the stronger attenuation of soft X-rays in the sample. Monochromaticity of the beam is thus absolutely necessary to perform accurate density measurements. The high photon flux from synchrotron X-ray sources and the small angular source size with negligible geometrical blur make it possible to obtain images with high spatial resolution and a high signal-to-noise ratio. Because of the characteristics of the SR white beam, it can provide different densities according to mineralization or demonstrate bone structure precisely. The SR computed tomography (SR-CT) system has been applied to analyze bone microstructure for in vivo [2] and in vitro [3–8] animal studies. We scanned several bone samples by synchrotron radiation to reveal the two-dimensional (2D) and threedimensional (3D) trabecular and cortical microstructure. To confirm the ability of SR-CT to demonstrate details of trabecular surfaces and bone mineralization, the histological and microradiographic findings were compared with the SR-CT images. The aims of this study were (1) to evaluate the ability of SR-CT to detect the details of the trabecular surfaces and (2) to evaluate the ability of SR-CT to detect different degrees of mineralization or cortical porosity.
288
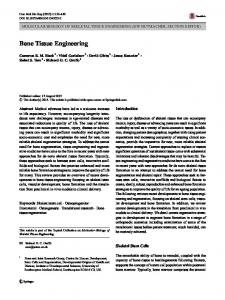
Materials and methods Synchrotron institute The CT system was set up at the beamline BL20B2 [9] in the synchrotron radiation facility Super Photon ring8GeV (SPring-8; Harima, Hyogo, Japan), which is one of three so-called third-generation hard X-ray synchrotron radiation facilities in the world [10]. The bendingmagnet beamline is allocated to medical applications and various imaging techniques in the energy range of 5–100 keV. The main optics is the standard SPring-8 bending-magnet system, which contains a fixed-exit double crystal monochromator. The double crystal monochromatometer, set to diffract in the symmetrical Bragg refraction geometry, selects the appropriate energy from the white SR beam emerging from the storage ring. The X-ray beam produced by the bending magnet passes out of the experimental hall (Fig. 1A) surrounding the storage ring. The experimental hutch (4 m long and 2.8 m wide) is located 42 m from the source point in the experimental hall. The monochromatized X-rays come out into the atmosphere by passing through a Kapton window. Experimental table Each experimental hutch consists of a flexible experimental table with long working distance X–Y translation stages (Fig. 1B,C). The experimental table is 2 m long and 1 m wide. Multiple-axis high-precision diffractometers are placed on the X–Y translation stages. These instruments are used to evaluate and de-
M. Ito et al.: Bone imaging using synchrotron radiation CT
velop various kinds of optical elements for novel imaging techniques. The high-precision stages are used for 3D microtomography. Imaging detector High-spatial-resolution 2D image detectors are prepared for radiographic imaging. The detectors are a fluorescent screen lens-coupling system. X-rays passing through the object are transformed into a visible image by the fluorescent screen. Images on the screen are read by a cooled charge-coupled device (CCD) camera with a high numerical aperture lens. The 2D detector is a Beam Monitor 2 (Hamamatsu Photonics, Hamamatsu, Japan), with a Gd2O2S:phosphor and a cooled CCD camera (Hamamatsu C4880-14A, 1000 ⫻ 1018 pixels) [11,12]. The high-spatial-resolution CCD image detectors take images of biological specimens by using techniques of microtomography. Digitized images with 14-bit resolution are captured and stored into a personal computer.
Sample scanning The sample is mounted on a goniometer including highresolution translations and rotations to position the sample and to rotate it in the beam [13]. The samples were scanned with synchrotron radiation at 22 keV, providing data for 750 ⫻ 750 ⫻ 750 voxel images with an isometric voxel size of 6 µm. For each bone sample, 360 radiographic images were acquired over an angular range of 180° with angular step of 0.2°. Reconstruction
A
C
B
D
Fig. 1. Synchrotron radiation computed tomography (SR-CT) system at the beamline BL20B2 in SPring-8. A Beamline in experimental hall. B Experimental hutch (4 m long and 2.8 m wide) and experimental table. C CT system. The goniometer is a table to mount and scan samples. D Upper part of CT system has the camera system
M. Ito et al.: Bone imaging using synchrotron radiation CT
was made with a filtered backward projection algorithm. Scanning time was approximately 2 h for each sample. 3D images were reconstructed from a set of 2D projections under different angles of view [14], with volume rendering using AVS software (Advanced Visual Systems, Waltham, MA, USA) running on Windows (Microsoft, Bellevue, WA, USA).
289
micro-X-ray source (10 µm, 25 keV), and the transmitted X-ray beam is recorded by a linear detector (CCD array; 1024 elements) after being quantitatively absorbed by apatite crystals contained in the bone. The apparatus was controlled by a DEC α-station (Digital Equipment, Marseilles, France), and an OpenVMS (virtual memory system) in cluster configuration to perform the 3D analysis [16].
Materials Materials included the following: 1. Six tibiae from 8-week-old female Lewis rats that had undergone unilateral sciatic neurectomy (NX; n ⫽ 4) or its sham operation (n ⫽ 2). 2. Eight vertebrae from 10-month-old Wister– Imamichi female rats that had undergone ovariectomy (OVX; n ⫽ 6) or its sham operation (n ⫽ 2). At 16 months of age, the rats were killed and the fourth lumbar vertebrae were sampled. 3. Eight vertebrae from 8-month-old Gottingen minipigs that were administered subcutaneously with predonisolone 0.5 mg/kg (n ⫽ 4) or distilled water 0.5 mg/kg (n ⫽ 4). Twenty-six weeks after administration, the minipigs were killed and the fourth lumbar vertebrae were sampled. Before scanning, the samples were soaked in 70% ethanol solution. These animal studies were carried out in accordance with Chugai Pharmaceutical’s ethical guidelines for animal care, and the experimental protocols were approved by the animal care committee of the Institution.
Scanning electron microscopy Specimens were treated with 10% sodium hypochlorite solution and dehydrated, critical point-dried, sputtercoated with gold, and observed by a scanning electron microscope (SEM) (S-570; Hitachi, Tokyo, Japan) under an accelerating voltage of 20 kV. Contact microradiography Specimens were dehydrated and embedded in methyl methacrylate resin (Wako, Osaka, Japan), and ground to obtain 100-µm-thick sections for contact microradiography (CMR). The section was mounted on a high-resolution film (Pelicula SO-343; Kodak, Rochester, NY, USA) and CMR was taken using a soft X-ray unit (SRO-405; Sofron, Tokyo, Japan) at 15.5 kVp, 3 mA, and an exposure time of 14 min. To compare the images, the imaging regions of micro-CT, SEM, and CMR were defined to be, as much as possible, from the same regions where SR-CT images were obtained, using the distance from the field marks in the bone. Results
Microcomputed tomography (CT) We used a µCT20 and its analyzing application from SCANCO Medical (Basserdorf, Switzerland) as a conventional micro-CT scanner [15]. This instrument has a A
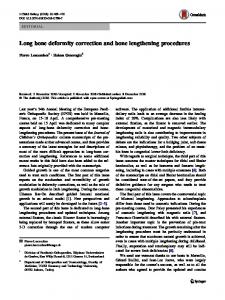
2D and 3D images of the rat vertebrae Figure 2 presents the 2D and 3D microstructure of a 10month-old sham-operated female rat vertebra. The 2D B
Fig. 2. Two-dimensional (2D) and three-dimensional (3D) trabecular microstructure SR-CT images of rat vertebra. A 2D image shows the sharp border of the trabeculae without visible partial volume effect. B 3D image shows shallow concavities in the trabecular surfaces (arrows)
290
M. Ito et al.: Bone imaging using synchrotron radiation CT
A
C
B
Fig. 3. 2D axial SR-CT images of rat tibial diaphysis. Neurectomy (NX) rat (B) shows dilatation of vessel canals in comparison with the sham-operated rat (A). Etidronate (EHDP) 10 mg/kg (C) prevented this change
image showed the sharp border of the trabeculae without visible partial volume effect, and the 3D image showed the network of trabeculae and cortical bone and also revealed shallow concavities in the trabecular surfaces.
Comparison of SR-CT image with CMR image Figure 6A shows a vertebral cortical bone of the minipig using CMR. The different densities that were detected in the surface of the trabeculae were also seen by SRCT (Fig. 4B, C).
2D images of the diaphysis of the tibiae Figure 3 shows the axial section of the rat tibial diaphysis. The image on the left was from the control rat (sham); the image on the right was from the rat after neurectomy (NX). The NX rat showed dilatation of the vessel canals. Comparison of 2D SR-CT images with 2D micro-CT images Figure 4 shows the vertebra of a minipig. The SR-CT image of the trabecular network was clear without visible partial volume effects, whereas the micro-CT image revealed a blurred trabecular border as a result of its lower spatial resolution in comparison with SR-CT. Comparison of SR-CT image with SEM image In Fig. 5, on the left are SR-CT images of the vertebra of minipig showing the irregularity of the trabecular surface. Multiple resorption cavities were demonstrated using SEM in the same region.
Discussion Bone microstructure is conventionally quantified in vitro by a 2D histomorphometric approach with thinslice histological sections. The 2D analysis has the limitation that it cannot demonstrate geometrical trabecular structure, such as direction of the trabeculae and characterizations of trabecular shape and surfaces. The 3D surface structure can be analyzed in vitro using SEM, which requires sophisticated sample preparation as well as histomorphometric study. Micro-CT has recently been developed to demonstrate 3D trabecular microstructure without destruction of bone samples. The principle of micro-CT consists of reconstruction of the linear attenuation coefficient within an object based on measurements of the attenuation of an X-ray beam passing through the object from different viewing angles [15–17]. Recent micro-CT provides 3D information on microstructure by the reconstruction of multiple 2D images with almost 10-µm resolution, and with the development of 3D structural
M. Ito et al.: Bone imaging using synchrotron radiation CT
291
A
B
Fig. 4. 2D SR-CT (A, upper panels) and conventional micro-CT images (B, lower panels) of a minipig vertebra. The SR-CT image (A) of the trabecular network is clear without visible partial volume effects, and the micro-CT image (B) reveals the blurred border of the trabeculae. A shows an abrupt disconnection of trabeculae (see the magnified image to the right). SR-CT also shows the different density in the edge of the trabeculae (open arrow)
A
C
B
D
Fig. 5. 3D SR-CT and scanning electron microscopy (SEM) images of trabecular surface of minipig vertebra. SR-CT image (A) shows irregularity of trabecular surface (magnified in B). Multiple resorption cavities can be demonstrated using SEM in the same region (C; magnified in D). SEM images are with 8-bit resolution in gray scale
292
M. Ito et al.: Bone imaging using synchrotron radiation CT
A
B
C
Fig. 6. 2D SR-CT and CMR images of vertebral bone in the minipig. Different densities can be detected in the surface of the trabeculae by SR-CT (B,C) as well as by contact microradiography (CMR) (A)
parameters the change of microstructure can be quantified for various pathophysiological effects and antiosteoporotic agents. Furthermore, finite element analysis (FEA) can be performed using 3D data derived from micro-CT [18,19], enabling us to calculate the bone strength and stress distribution of the spongiosa and cortex. However, because of the limited resolution and the characteristic spectrum of the conventional X-ray beam, neither resorption cavities on the trabecular surfaces nor differences in mineralization can be demonstrated using conventional micro-CT. The present study shows that details of the trabecular surface and different bone densitics can be demonstrated using SR-CT. Owing to the monochromaticity and high photon flux, images of trabecular structure and cortex with high spatial resolution and high signal-tonoise ratio are obtained. The spatial resolution was 6 µm in the present study. The previous study concluded that 14 µm gave a reasonably good parameterization of trabecular bone. Also, the 2-µm level images revealed interesting features of the irregularities and rupture of trabecular surface and of remodeling zones [20]. Quantification of degree of mineralization of bone (DMB) using SR-CT was recently reported. The method used was to calibrate the various dipotassium
hydrogen phosphate (K2HPO4) concentrations [21]. Although quantification of bone mineralization was not done in the present study, our research group has developed a new method to absolutely quantify calcium density in bone components using SR-CT in a subsequent study that will be reported in the future. Comparison of trabecular surface characteristics and the degree of mineralization between SR-CT images and SEM or CMR demonstrates the usefulness of SRCT in evaluation of bone quality. The resorption cavity reveals the metabolic situation and the degree of mineralization reflects the ratio of mineral to matrix content, i.e., less mineralized bone versus highly mineralized bone. It is obvious that SEM or CMR more clearly reveals resorption cavities or different bone density than does SR-CT. However, SR-CT has two advantages over SEM or CMR. First, SR-CT shows the real 3D structure, which can be observed from any direction, and second, the structure can be repeatedly observed without destruction of the bone samples. The usefulness of SR-CT in the evaluation of bone is summarized as follows: 1. A 2D SR-CT image has no visible partial volume effect and produces a high-quality image in comparison with commercially available micro-CT images. 2. A 3D SR-CT image of the trabecular structure reveals shallow concavities in the bone surface, which may correspond to osteoclastic resorption areas, as well as the connectivity, anisotropy, and shape (rodor platelike) of trabeculae. 3. A 2D image can reveal a region along the surface of the trabecular bone with a density different to that of other parts, indicating a different degree of mineralization. A 2D image can also reveal small vessel canals in the cortex. In conclusion, SR-CT seems to be a useful tool for the assessment of bone quality and the determination of precise trabecular structure, particularly for the delineation of trabecular surfaces and mineralization. Acknowledgments. This study was made under the approval of SPring-8 Project Review Committe (#2000B0153-NOL-np). We thank Ms. Ayako Shiraishi, Ms. Sayumi Higashi, and Mr. Yoshiomi Morishita of Chugai Pharmaceutical Co., Ltd., and Mr. Takashi Katsumata and Mr. Tomoyuki Tanaka of Sumitomo Pharmaceutical Co, Ltd., for providing the bone samples. Mr. Hideyuki Watashiba, Mr. Hioshi Kitagishi, and Mr. Kohei Mizuno helped us to scan the samples in SPring-8. This study was supported by a Grant-in-Aid for Scientific Research from the Ministry of Education, Culture, Sports, Science and Technology in Japan (Masako Ito; no. 13670949) and by a Grant-inAid for Encouragement of Young Scientists from the
M. Ito et al.: Bone imaging using synchrotron radiation CT
Japan Society for the Promotion of Science (Hiroshi Jinnai; no. 12750799).
References 1. Grodzins L (1983) Optimum energy for X-ray transmission tomography of small samples. Nucl Instrum Methods 206:541–543 2. Kinney JH, Lane NE, Haupt DL (1995) In vivo, threedimensional microscopy of trabecular bone. J Bone Miner Res 10:264–270 3. Bonse U, Busch F, Gunnewig D, Beckmann F, Pahl R, Delling G, Hahn M, Graeff W (1994) 3D computed X-ray tomography of human cancellous bone at 8 mm spatial and 10E-4 energy resolution. Bone Miner 25:25–38 4. Engelke K, Graeff W, Meiss L, Hahn M, Delling G (1993) High spatial resolution imaging of bone mineral using computed tomography: comparison with microradiography and undecalcified histologic sections. Invest Radiol 28:341–349 5. Lane NR, Haupt D, Kimmel DB, Modin G, Kinney JH (1999) Early estrogen replacement therapy reverses the rapid loss of trabecular bone volume and prevents further deterioration of connectivity in the rat. J Bone Miner Res 14:206–214 6. Pateyron M, Peyrin F, Laval-Jeantet AM, Spanue P, Cloetens P, Peix G (1996) 3D microtomography of cancellous bone samples using synchrotron radiation. In: Proceedings, SPIE Medical Imaging 96: Physics of Medical Imaging 2708:417–426 7. Kinney JH, Haupt DL, Balooch M, Ladd AJC, Ryaby JT, Lane NE (2000) Three-dimensional morphometry of the L6 vertebra in the ovariectomized rat model of osteoporosis: biomechanical implications. J Bone Miner Res 15:1981–1991 8. Kinney JH, Ladd AJC (1998) The relationship between threedimensional connectivity and the elastic properties of trabecular bone. J Bone Miner Res 13:839–845 9. Bonse U, Busch F (1996) X-ray computed microtomography (microCT) using synchrotron radiation (SR). Prog Biophys Mol Biol 65:133–169 10. Goto S, Takeshita K, Suzuki Y, Ohashi H, Asano Y, Kimura, H, Matsushita T, Yagi N, Isshiki M, Yamazaki H, Yoneda Y, Umetani K, Ishikawa T (2001) Construction and commissioning
293
11.
12.
13.
14.
15.
16.
17.
18.
19.
20.
21.
of a 215-m-long beamline at SPring-8. Nucl Instrum Methods A 467–468, 682–685 Uesugi K, Tsuchiyama A, Nakano T, Suzuki Y, Yagi N, Umetani K, Kohmura Y (1999) Development of a microtomography imaging system for rock and mineral samples. Proc SPIE 3772:214 Takano H, Suzuki Y, Uesugi K, Takeuchi A, Yagi N (2001) PSF measurement of imaging detectors with an x-ray microbeam. Proc SPIE 4499:26 Salome M, Peyrin F, Cloetens P, Odet C, Laval-Jeantet A-M, Baruchel J, Spanne P (1999) A synchrotron radiation microtomography system for the analysis of trabecular bone samples. Med Phys 26:2194–2204 Flannery BP, Deckman HW, Roberge WG, D’Amoco KL (1987) Three dimensional X-ray microtomography. Science 237:1439– 1444 Feldkamp LA, Goldstein SA, Parfitt AM, Jesion G, Kleerekoper M (1989) The direct measurement of three-dimensional bone architecture in vitro by computed tomography. J Bone Miner Res 4:3–1 Rüegsegger P, Koller B, Müller R (1996) A microtomographic system for the nondestructive evaluation of bone architecture. Calcif Tissue Int 58:24–29 Müller R, Hildebrand T, Rüegsegger P (1994) Non-invasive bone biopsy: a new method to analyze and display the three-dimensional structure of trabecular bone. Phys Med Biol 39:145–164 Müller R (1996) Analysis of mechanical properties of cancellous bone under conditions of simulated bone atrophy. J Biomech 29:1053–1060 Ito M, Nishida A, Koga A, Ikeda S, Shiraishi A, Uetani M, Hayashi K, Nakamura T (2002) Contribution of trabecular and cortical components to the mechanical properties of bone and their regulating parameters. Bone (NY) 31:351–358 Peyrin F, Salome M, Cloetens P, Laval-Jeantet AM, Ritman E, Rüegsegger P (1998) Micro-CT examinations of trabecular bone samples at different resolutions: 14, 7 and 2 micron level. Technol Health Care 6:391–401 Nuzzo S, Lafage-Proust MH, Martin-Badosa E, Boivin G, Thomas T, Alexandre C, Peyrin F (2002) Synchrotron radiation microtomography allows the analysis of three-dimensional microarchitecture and degree of mineralization of human iliac crest biopsy specimens: effects of etidronate treatment. J Bone Miner Res 17:1372–1382